Browse our range of reports and publications including performance and financial statement audit reports, assurance review reports, information reports and annual reports.
Performance statements audit
Auditor-General Report No. 22 of 2025–26
Performance Statements of Major Australian Government Entities — Outcomes from the 2024–25 Audit Program
Published
Thursday 5 February 2026

Portfolio
Across Entities
Entity
Across Entities
Contact
Please direct enquiries through our contact page.
Executive summary
1. Parliament requires clear and transparent information about how Commonwealth entities are performing and whether public resources are being used properly1 for the purposes intended. By having access to appropriate and meaningful performance information, Parliament can better hold government and entities accountable for their performance. This in turn helps to ensure government policies, programs and services are achieving their intended outcomes and delivering value to the public.
2. The Public Governance, Performance and Accountability Act 2013 (PGPA Act) requires Commonwealth entities to provide meaningful information to the Parliament and the public.2 It imposes specific obligations and requirements for entity performance reporting, through the preparation of annual performance statements.3 It also makes provision for annual performance statements to be examined by the Auditor-General, at the request of the Minister for Finance or the responsible minister.4
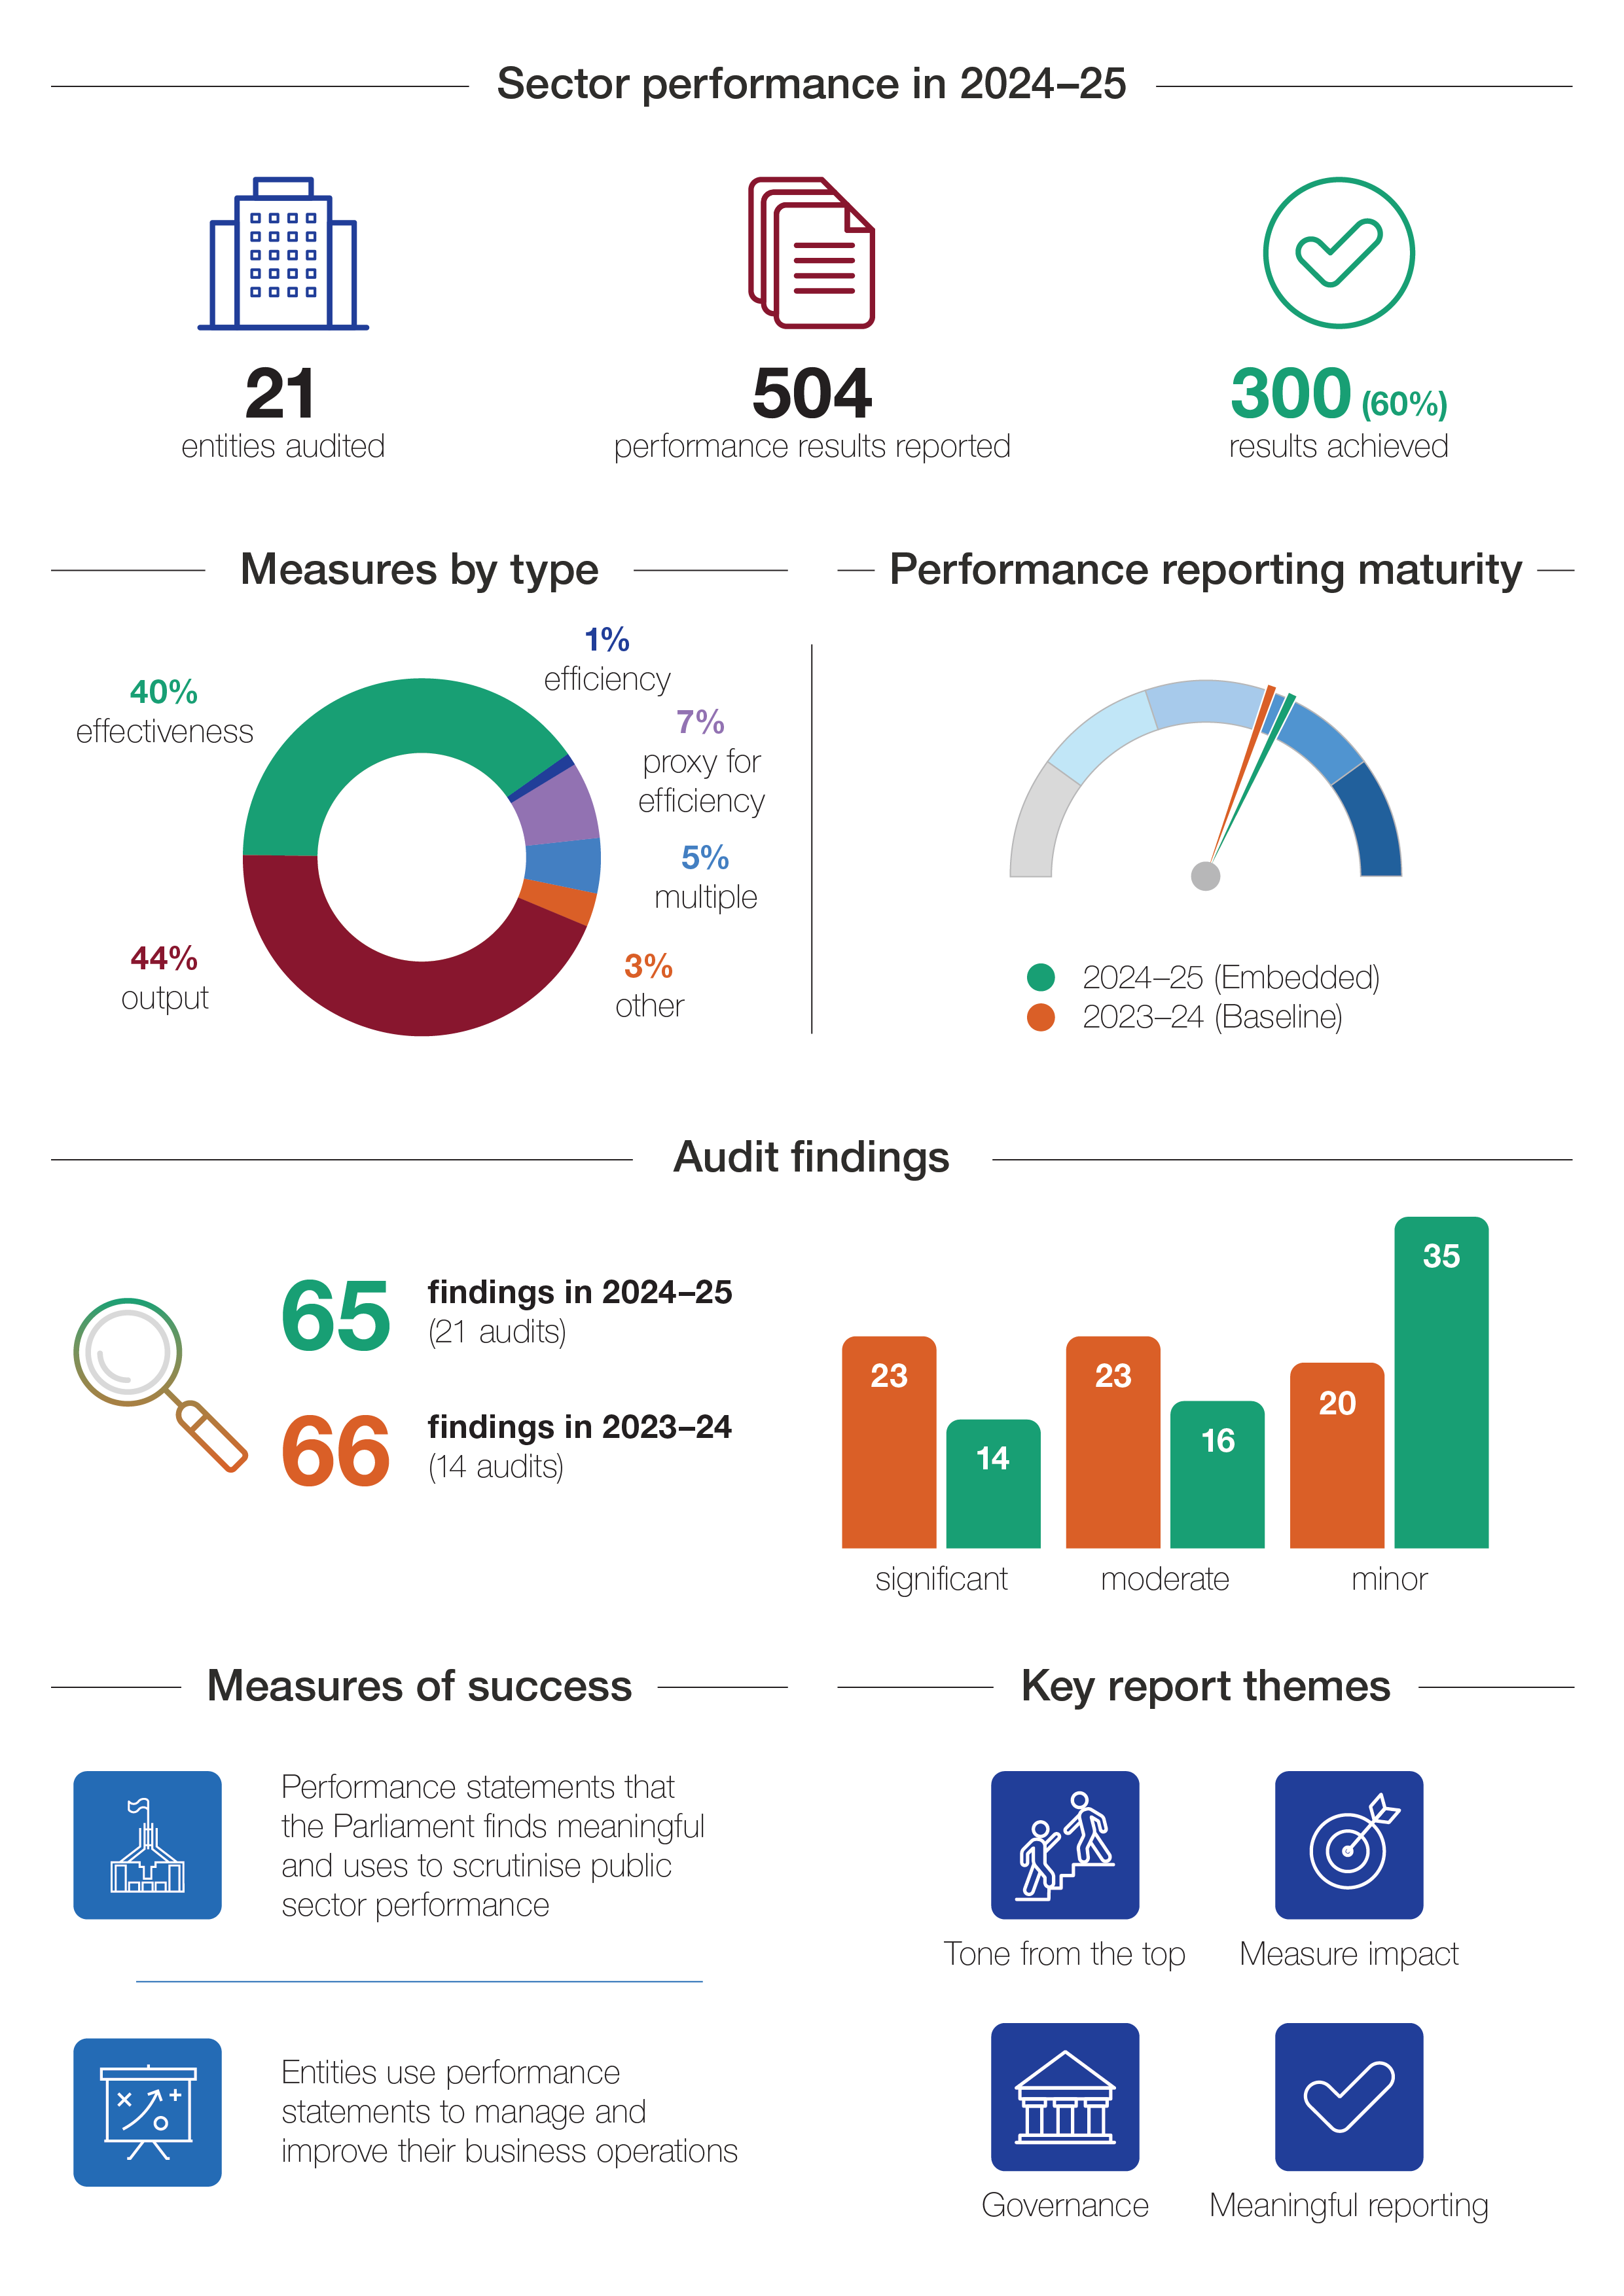
3. For the year ended 30 June 2025, the ANAO audited the performance statements of 21 entities. These include all the Departments of State, the largest department of the Parliament, the Australian Taxation Office, the National Disability Insurance Agency, the National Indigenous Australians Agency, and Services Australia.
4. The audited population is substantial in terms of accountability to Parliament, expenditure and revenue, and the functions of the Australian Government. Collectively, the 21 audited entities were responsible for $868 billion in revenue and $858 billion in expenditure in 2024–25 — over 85 per cent of all revenue and expenditure presented in public sector entities’ financial statements.
5. Auditing of annual performance statements by the ANAO provides independent assurance to the Parliament and the public that the information presented is accurate, reliable and appropriate for accountability and democratic oversight.
6. Preparing and using performance information reflects sound business management practice. It is therefore concerning when entities indicate that the performance measures reported in their annual performance statements are not useful for managing the business or have been developed specifically for inclusion in the performance statements. While it is not necessary for performance measures used for external accountability and internal management to be the same, there should be a logical linkage between them. By way of comparison, there would be little confidence in an entity that said it did not use the financial information it reported externally to manage or improve its business operations.
7. The coming years will continue to be challenging for the public sector as it continues to be asked to do more, with less, for more people, in an increasingly complex and risky environment. It is important that entities can be assessed not just on what they spend, but on the difference they make. Ensuring that entities align their performance with long-term outcomes that matter most to the community and decision-makers is crucial. Performance statements that provide meaningful information can promote accountability, transparency, and genuine improvements in entity performance and public service delivery.
Performance of the public sector (chapter 1)
8. Meaningful annual performance statements are an important way for the Parliament, the government and the public to understand whether entities are operating efficiently and effectively in achieving their purposes, and delivering public value. Over time, as performance reporting matures, it may be possible to build a consolidated view of the performance of the public sector.
9. Of the 504 results5 reported by the 21 audited entities in 2024–25:
- 300 results met the targets (60 per cent);
- 66 results partially met the targets (13 per cent);
- 93 results did not meet the targets (18 per cent); and
- 27 results did not have a target, or were unable to be used against the target (five per cent); and
- 18 results were the basis for a qualified audit conclusion (four per cent).
10. These results suggest performance by the audited entities was mixed, with areas of high performance as well as room for improvement. However, a simple count of how many performance targets are ‘met’ or ‘not met’ is insufficient to assess public sector performance. A more complete view needs to consider context and factors outside the entity’s control, such as economic conditions, legal and regulatory constraints and technological change. Variations in the way performance information is collected and categorised or whether targets have been set ambitiously or conservatively, also affect how results should be interpreted.
11. The ANAO has observed substantial improvements in the quality of reporting since the commencement of the audit program, both in the scope of what is being reported, and in the clarity, consistency, and usefulness of the performance information presented by entities in annual performance statements. Despite these improvements, gaps and shortcomings remain that limit the insights and value provided by annual performance statements. For example:
- targets may reflect relatively low thresholds. As such, meeting these targets may not indicate high performance (paragraphs 1.15 to 1.19);
- entities can aggregate different topics and data sources in one measure. Aggregated performance measures can obscure important detail, mask poor or unbalanced outcomes and reduce transparency (paragraphs 1.25 to 1.27);
- some entities define performance below the target as ‘met’ (paragraph 1.30); and
- entities report inconsistently on similar functions — this makes it difficult to compare and benchmark performance across entities and to consider which approaches are working more effectively and why (paragraphs 2.47 to 2.52).
12. The nature and complexity of many government programs and services can make it difficult to measure certain aspects of their performance, requiring expertise and time to develop. This includes measuring:
- efficiency (more output for less input) — measurement of efficiency is rare across the sector.6 Without efficiency measures, it is difficult to know whether entities are delivering value for money, improvements or savings are possible, or whether public resources are being used well (paragraphs 1.32 to 1.39); and
- outcomes and impact — enable entities to move beyond measuring activity and expenditure to assessing whether their key activities are delivering their intended results and producing meaningful change to justify the level of investment (paragraphs 1.49 to 1.54).
13. Despite these challenges, the ANAO has observed that entities can take practical steps to strengthen the quality and usefulness of performance information, even when perfect measurement is not possible. This includes focusing on a mix of measures and supplementing quantitative measures with qualitative information, such as case studies, and insightful narrative and analysis. Better linking performance and financial information could provide another way of demonstrating that public money is being well managed and may overcome challenges in developing efficiency measures (paragraphs 1.40 to 1.47).
14. Presenting the auditor’s reports and the audited performance statements together in an entity’s annual report, as is the case for financial statements, would enable users to more readily assess whether the performance statements fairly present the entity’s performance in achieving its purposes in the reporting period and whether they can rely on the statements when making decisions, allocating resources or evaluating performance.
Assessing performance requires meaningful information (chapter 2)
15. The Commonwealth Performance Framework provides flexibility for entities to develop performance statements that reflect the nature and unique purposes of each entity. This recognises that entities differ in their functions, size and organisational form. The Framework acknowledges that when it comes to performance statements:
- one size does not fit all;
- entities need flexibility to decide how best to ‘tell their performance story’ in an appropriate and meaningful way; and
- entity performance information is likely to continue to evolve over time in response to the needs and expectations of the Parliament, government and the public.
16. The 2024–25 audit program shows that entities have improved their ability to produce performance statements that comply with the minimum requirements of the Public Governance, Performance and Accountability Rule 2014 (PGPA Rule). However, audit findings show that simply meeting the minimum requirements does not necessarily produce information that is appropriate and meaningful for both the entity and external users of the performance statements. Many entities continue to primarily report what was done rather than showing what was achieved and statements can be disconnected from government priorities and long-term outcomes.
17. The Commonwealth Performance Framework does not define ‘meaningful information’, leaving entities without clear guidance for preparing effective performance statements beyond compliance only with the PGPA Rule. The ANAO has observed through its audit work that meaningful reporting involves setting out:
- ‘complete’ purposes and key activities (paragraphs 2.13 to 2.16);
- appropriate performance measures and targets (paragraphs 2.28 to 2.33); and
- clear, comprehensive and insightful narrative and analysis (paragraphs 2.40 to 2.46).
18. These elements are not always present in performance statements, even if the statements comply with the PGPA Rule. There is scope to clarify the Commonwealth Performance Framework to assist entities to better understand the qualities that make annual performance statements stakeholder focussed and meaningful (paragraph 2.8).
19. The effectiveness of many Australian government policies, programs and services can be difficult to measure and assess, particularly in a system of accountability that is focussed on individual entities. There are opportunities for the sector to consider:
- adopting common approaches to measuring similar functions or key activities across entities, such as regulation, compliance and claims processing, which could enable entities to identify better practices and benchmark their performance (paragraph 2.52); and
- leveraging linked programs in portfolio budget statements to enable performance reporting to move beyond individual entity achievements, facilitating more coordinated and coherent reporting of cross-cutting initiatives that can help users gain a clearer understanding of how well entities are working together and inform better analysis of the effectiveness of entities’ collaborative efforts in delivering public value and outcomes (paragraph 2.58).
20. One of the 21 entities audited by the ANAO reported a key activity on Closing the Gap. Of the 21 entities audited by the ANAO in 2024–25, only two had performance measures relating to Closing the Gap targets.
Performance reporting is improving — auditing incentivises improvement (chapter 3)
21. The outcomes of the 2024–25 audits show a continuing trend of improvement in performance reporting and in entities’ maturing capability to prepare performance statements. Of note:
- the proportion of entities that received a qualified audit conclusion in 2024–25 (29 per cent) decreased from 2023–24 (36 per cent);
- the same five auditees that received qualified conclusions in 2023–24 also received a qualified conclusion in 2024–25. However, the nature and extent of the qualifications were generally reduced compared to the previous year;
- new entities entering the audit program for the first time are better prepared — only one of the seven new entities audited for the first time in 2024–25 received a qualified audit conclusion;
- despite a 50 per cent increase in the number of auditees (from 14 to 21), a slightly lower number of findings was issued in 2024–25 (65) compared to 2023–24 (66). Only 46 per cent of final audit findings were significant or moderate in 2024–25, down from 70 per cent in 2023–24;
- of the 21 audited entities, two had no open findings at the close of the 2024–25 audits; and
- the average maturity ratings of entities’ capability in the 2024–25 program increased from the prior year, but maturity still differs between entities. There were improvements in each of the five maturity categories assessed by the ANAO — leadership and culture, governance, data, capability, and records and reporting.
22. Growing performance reporting maturity across the sector helped to reduce audit costs. Across the 14 entities audited in both 2023–24 and 2024–25, total audit costs fell by 20 per cent. The key contributing factor was timely preparation of high-quality performance statements by entities. This was made possible by entities having well-organised, accurate and accessible records, reliable systems, well-documented internal controls and knowledgeable staff to liaise with the audit team. Audit experience shows that entities should not need to create additional records beyond those required for effective internal management and assurance to meet audit requirement. In principle, the records and information used for effective internal management, good governance, and decision-making should also be sufficient to support an external audit.
23. The improvement in performance reporting maturity — particularly in the ‘Leadership and culture’ and ‘Governance’ categories — demonstrates a shift from a compliance approach, where entities are focussed on complying with minimum reporting requirements. Instead, there is an increasing emphasis on the value of performance information for improving business operations and the delivery of government policies, programs and services (paragraphs 3.27 to 3.32).
24. The audit results show that the tone from the top has a powerful influence on good performance reporting. When senior leaders emphasise a performance and learning culture, staff feel responsible for producing high-quality data and are confident to report results fairly, even when performance falls short. This leads to more complete, balanced and useful performance statements that enables better public accountability.7
Future focus of performance statements auditing
25. The ANAO is examining options to refine its audit approach to improve audit quality and efficiency. An area of focus in 2025–26 will be the ANAO’s approach to assessing audit risk to inform the nature and scope of audit procedures. Continued refinement of the ANAO’s risk-based approach aims to further reduce audit costs in 2025–26 for both the ANAO and audited entities without impacting audit quality (paragraphs 3.45 to 3.48).
Opportunities for improvement
Opportunities for the Department of Finance
- To consider options to require the inclusion of the auditor’s report on the performance statements in the annual report for entities (paragraph 1.5).
- To introduce guidance material to assist entities to link resource information presented in portfolio budget statements to key activities or measures in performance statements (paragraph 1.48).
- To provide guidance for entities to report, in their performance statements, on the functions of statutory authorities and office holders that are financially and administratively supported within the entity (paragraph 2.19).
- To consider how entities can best present shared outcomes, entity contributions, and coordinated delivery in performance statements (paragraph 2.58).
Opportunities for auditees
- To establish performance targets that are challenging but achievable (paragraph 1.31).
- To include narrative and analysis in the performance statements that clearly explains performance against targets and trends over time (paragraph 1.31).
- When aggregated measures combine different topics or data sources in ways that obscure important performance details, ensure there is sufficient explanation of the important details to give readers clearer performance information (paragraph 1.31).
- To report performance information that demonstrates their efficiency and productivity, through the development of efficiency measures or linking financial and non-financial performance information (paragraph 1.36).
- To effectively report on shared outcomes to demonstrate effectiveness in addressing cross-cutting initiatives and collective impact (paragraph 2.58).
- To ensure there is a logical linkage between performance measures used for external accountability and internal management purposes (paragraph 3.31).
- To properly maintain records that enable effective governance and accountability, support evidence-based decision making, inform policy development and program evaluation. This also helps preserve corporate memory and provides assurance to the accountable authority and senior leaders that the information reported to the Parliament is reliable and accurate (paragraphs 3.45 to 3.48).
Opportunities for the ANAO
- To enhance the risk-based approach to auditing performance statements, guided by the risk profile and performance reporting maturity of an entity. This includes continuing to respond to areas of high risk, reduce audit effort and cost and improve audit quality and impact (paragraph 3.53).
- To report clearly on better practice, highlighting examples of effective performance frameworks, meaningful measures, and good data practices observed across entities, encouraging peer-learning and helping lift system-wide capability (paragraph 3.53).
- To set clear expectations through audit criteria, share insights on systemic issues affecting performance reporting and inform the Commonwealth Performance Framework, guidance or legislative reform where appropriate (paragraph 3.53).
1. Performance of the public sector
Introduction
1.1 Meaningful performance statements show what entities planned to achieve in the reporting period and how well they performed. If prepared in accordance with the requirements of the Public Governance, Performance and Accountability Act 2013 (PGPA Act), they should provide meaningful information in a form that can be easily used by Parliament, government and the public to hold entities to account. They should help readers understand:
- the purposes and intended outcomes an entity has been funded to deliver;
- the key activities being undertaken by the entity in pursuit of those purposes and outcomes; and
- the results achieved, the impact the entity is having and the progress it is making.8
1.2 Financial statements are prepared under principles-based standards developed over many decades, which contain some detailed requirements regarding their structure, composition, measurement and disclosure. Their standardised format ensures they are prepared in a uniform way, enabling benchmarking across entities and sectors. The auditor’s report is presented in the entity’s annual report alongside the audited financial statements. This provides assurance that the financial statements fairly present the financial performance and position of the entity and are compliant with the financial reporting framework.
1.3 By comparison, annual performance statements are a relatively recent development, with Commonwealth entities being required to prepare them for the first time in the 2015–16 reporting period following the enactment of the PGPA Act. They are prepared under the principles-based Commonwealth Performance Framework, which provides flexibility for entities to customise their reporting to reflect their individual circumstances. Therefore, judgements need to be made about what performance information is most relevant and significant for the purpose of external reporting. These judgements can create challenges for both preparers and users, and may change over time. As a result, evaluating long-term performance trends and comparing performance across the sector can be difficult.
1.4 Unlike financial statements, the auditor’s reports on the performance statements are tabled in the Parliament by the Minister for Finance and are not included in the annual reports of audited entities. This separation makes it more difficult for a reader of the performance statements to know whether the statements fairly present the entity’s performance in achieving its purposes in the reporting period and if they are compliant with the performance reporting framework. There would be benefit in presenting the auditor’s reports alongside the audited performance statements, consistent with the current approach for financial statements, to ensure the reader receives assurance regarding the entity’s performance reporting.
Opportunity for improvement
1.5 The Department of Finance could consider options to require the auditor’s report on the performance statements to be included in the annual report for entities, to provide readers with assurance that the audited performance statements are presented fairly.
Assessing the performance of the Australian public sector
1.6 The Commonwealth Performance Framework requires the accountable authority of each Commonwealth entity to measure and assess the entity’s performance in achieving its purposes. It is a devolved framework with discretion for the accountable authority to determine the most appropriate method for measuring, assessing and reporting on their entity’s results and outcomes. Key terms used in the report for describing entity performance are outlined in Table 1.1.
Table 1.1: Key performance terms
|
Term |
Description |
|
Measure |
A performance measure is a specific indicator used to assess how well an entity is achieving an intended objective or outcome. It defines what is being measured and how success is evaluated. |
|
Target |
A performance target is the desired level of performance for a given measure or aspect of a measure, within a set time period. It specifies how much performance is expected and serves as a benchmark for success. |
|
Result |
A performance result is the actual level of performance achieved for a target over a set period of time. It shows what was accomplished and is used to compare against the target. |
1.7 A performance measure may have multiple performance targets. Some entities report their results against each target separately (see for example the Department of Social Services measure 2.1.5-1). Other entities aggregate performance across targets and report an overall result against the measure (see for example the Department of Defence measure 4.1). For consistency, the ANAO has referred to ‘results’ in this chapter to refer to entities’ assessments of their performance, irrespective of whether these results are reported at the measure level or target level.
1.8 The flexibility provided by the Commonwealth Performance Framework means performance statements and measurement frameworks differ significantly from entity to entity. This includes differences in how entities define achievement or success against a performance measure or target. Most entities use at least three categories to describe their results:
- fully met/achieved;
- partially met/achieved9; and
- not met/achieved.
1.9 The tolerances for each of these categories vary between entities. For example, if a result was 80 per cent against a target of 100 per cent, the Department of the Prime Minister and Cabinet would report ‘substantially achieved’10, Services Australia would report ‘partially achieved’, and the Department of Home Affairs would report ‘not met’. This reduces the comparability of performance results between entities.
1.10 Another challenge in evaluating the aggregate performance of the Australian public sector is that the number of results an entity reports may not be proportional to its size, role in the public sector or contribution to the lives of Australians. For instance, Services Australia, an entity that provides services to almost every Australian11, reported eight results out of the 504 reported by the 21 audited entities in 2024–25.12 By comparison, the ATO reported 41 performance results in 2024–25, the National Disability Insurance Agency reported 12 results (down from 19 results in 2023–24) and the Department of Parliamentary Services reported 13 results.
Performance against targets
1.11 Performance targets give context to reported performance information and provide the foundation for credible performance measurement, transparent public reporting, and robust accountability for the use of public resources. In the absence of targets, performance statements tend to become descriptive, making it difficult to assess whether an entity has delivered on its commitments, public funds have been used effectively, or performance information is appropriate and meaningful.
1.12 Table 1.2 shows the performance results reported by audited entities in 2024–25, including how many results were reported as met, partially met, not met, or not assessed against the targets.
Table 1.2: Performance results reported by entity in 2024–25
|
Entity |
Results met |
Results partially met |
Results not met |
Results not assessed |
Total results reporteda |
||||
|
|
# |
% |
# |
% |
# |
% |
# |
% |
# |
|
Attorney-General’s Department (AGD) |
13 |
57 |
3 |
13 |
7 |
30 |
0 |
0 |
23 |
|
Australian Taxation Office (ATO) |
24 |
62 |
7 |
18 |
5 |
13 |
3 |
8 |
39 |
|
Department of Agriculture, Fisheries and Forestry (DAFF) |
13 |
54 |
7 |
29 |
3 |
13 |
1 |
4 |
24 |
|
Department of Climate Change, Energy, the Environment and Water (DCCEEW) |
17 |
71 |
5 |
21 |
2 |
8 |
0 |
0 |
24 |
|
Department of Defence |
5 |
38 |
5 |
38 |
1 |
8 |
2 |
15 |
13 |
|
Department of Education (DoE) |
21 |
68 |
0 |
0 |
8 |
26 |
2 |
6 |
31 |
|
Department of Employment and Workplace Relations (DEWR) |
21 |
78 |
0 |
0 |
3 |
11 |
3 |
11 |
27 |
|
Department of Finance (Finance) |
25 |
68 |
5 |
14 |
1 |
3 |
6 |
16 |
37 |
|
Department of Foreign Affairs and Trade (DFAT) |
9 |
75 |
3 |
25 |
0 |
0 |
0 |
0 |
12 |
|
Department of Health, Disability and Ageing (DHDA) |
20 |
56 |
3 |
8 |
10 |
28 |
3 |
8 |
36 |
|
Department of Home Affairs (Home Affairs) |
11 |
46 |
3 |
13 |
10 |
42 |
0 |
0 |
24 |
|
Department of Industry, Science and Resources (DISR) |
12 |
67 |
4 |
22 |
1 |
6 |
1 |
6 |
18 |
|
Department of Infrastructure, Transport, Regional Development, Communications, Sport and the Arts (DITRDSCA) |
26 |
74 |
7 |
20 |
1 |
3 |
1 |
3 |
35 |
|
Department of Parliamentary Services (DPS) |
11 |
85 |
0 |
0 |
2 |
15 |
0 |
0 |
13 |
|
Department of the Prime Minister and Cabinet (PM&C) |
6 |
55 |
5 |
45 |
0 |
0 |
0 |
0 |
11 |
|
Department of Social Services (DSS) |
15 |
63 |
1 |
4 |
8 |
33 |
0 |
0 |
24 |
|
Department of the Treasury |
15 |
65 |
4 |
17 |
1 |
4 |
3 |
13 |
23 |
|
Department of Veterans’ Affairs (DVA) |
19 |
44 |
0 |
0 |
24 |
56 |
0 |
0 |
43 |
|
National Disability Insurance Agency (NDIA) |
7 |
58 |
0 |
0 |
5 |
42 |
0 |
0 |
12 |
|
National Indigenous Australians Agency (NIAA) |
5 |
56 |
2 |
22 |
1 |
11 |
1 |
11 |
9 |
|
Services Australia |
5 |
63 |
2 |
25 |
0 |
0 |
1 |
13 |
8 |
|
Total |
300 |
62 |
66 |
14 |
93 |
19 |
27 |
5 |
486 |
Note a: This table excludes results that formed part of the basis for a qualified audit conclusion.
Note: Some of the results ‘not assessed’ include where the entity has established a baseline.
Note: Some percentages for an entity do not sum to 100 due to rounding.
Source: ANAO analysis of entities’ annual performance statements. As per Footnote 3, this table has rolled up all entity performance assessments that were less than fully met, but more than not met, into the single category of ‘partially met’.
1.13 When excluding performance measures that were the basis for a qualified audit conclusion13, the 21 audited entities reported 486 performance results as follows:
- 300 results met the targets (62 per cent);
- 66 results partially met the targets (14 per cent);
- 93 results did not meet the targets (19 per cent);
- 27 results did not have a clear target, or were unable to be used to assess performance against the target (6 per cent).14
1.14 These results suggest a mixed level of performance, with areas of high performance as well as room for improvement. This simple count of how many performance targets are ‘met’ or ‘not met’ has limitations. A more complete understanding of performance needs to consider context and factors outside the entity’s control, such as economic conditions, legal and regulatory constraints and technological change. Variations in how performance information is collected and categorised or whether targets have been set ambitiously or conservatively, also affects how results should be interpreted.
1.15 For example, targets may reflect relatively low thresholds that are not ‘challenging but achievable’.15 Where an entity regularly exceeds its performance targets by large margins, it may be appropriate to consider whether the targets are set correctly to reflect ‘challenging but achievable’ thresholds that drive improvement.16
1.16 Further examination of the performance information is necessary to understand the degree of underperformance or overperformance. Missing a target by a narrow margin (for example, achieving 94 per cent against a 95 per cent target) is fundamentally different from significant underperformance, yet both may be counted as ‘not met’.17 Similarly, substantially exceeding a target does not show up in a simple count.
1.17 Table 1.3 shows that the Department of Health, Disability and Ageing has reported in the past two reporting periods on a measure relating to preventable hospitalisations that was ‘not met’ in both years but shows a significant drop in performance between years.
Table 1.3: Performance against Department of Health, Disability and Ageing performance measure: The number of Primary Health Network regions in which the rate of potentially preventable hospitalisations is declininga
|
Results |
2023–24 |
2024–25 |
ANAO analysis |
|
Target |
27 regions |
28 regions |
N/A |
|
Performance against target |
Not met |
Not met |
No change is apparent from the high-level result. |
|
Actual results |
24 regions |
2 regions |
Performance declined substantially in 2024–25. The department investigated the causes for this decline, and in its analysis for this measure, reported that ‘the observed increase in [potentially preventable hospitalisations] may be attributable to a notable decline in complex care management in the general practice sector in the previous period’. |
Note a: The full measure as published by the department is ‘The number of Primary Health Network regions in which the rate of potentially preventable hospitalisations is declining, based on the latest available Australian Institute of Health and Welfare longitudinal data’.
Source: Department of Health, Disability and Ageing 2024–25 Annual Performance Statements and Department of Health and Aged Care 2023–24 Annual Performance Statements
1.18 This example highlights the risk of relying exclusively on categorical assessments of ‘met’, ‘partially met’ or ‘not met’ to assess entity performance or whole of sector performance.
1.19 Narrative and analysis can play an important role in helping an entity explain why a performance target was not met and in maintaining the credibility and usefulness of the performance statements, as shown in Table 1.3. To assist the reader, the accompanying narrative and analysis could explain why the result happened, what it means, and planned next steps. The analysis could also describe what the entity could have influenced and what was outside its control.
Performance over time
1.20 Another dimension for evaluating the performance of the Australian public sector is to analyse performance over time. The PGPA Rule requires that an entity’s performance measures must provide a basis for an assessment of the entity’s performance over time.18 Resource Management Guide 131 explains the context for this requirement:
Many of the objectives of government are ones that will only be achieved over the medium to long term. Therefore, the ability to measure performance over time provides an entity and stakeholders with a more informed view of the entity’s progress in achieving its purposes.19
1.21 Table 1.4 presents the reported performance results for the 10 entities that the ANAO has audited since 2022–23 (excluding results that were the basis for a qualified audit conclusion).
Table 1.4: Performance over time for audited entitiesa, 2022–23 to 2024–25
|
Reported result |
Results in 2022–23 |
Results in 2023–24 |
Results in 2024–25 |
|||
|
|
Number |
% |
Number |
% |
Number |
% |
|
Met |
144 |
57 |
153 |
61 |
159 |
60 |
|
Partially met |
25 |
10 |
30 |
12 |
31 |
12 |
|
Not met |
56 |
22 |
59 |
23 |
63 |
24 |
|
Not assessedb |
26 |
10 |
10 |
4 |
12 |
5 |
|
Total results reported in-yearc |
251 |
100 |
252 |
100 |
265 |
100 |
Note a: The 10 entities that have been included in the ANAO’s audit program since 2022–23, and presented in this analysis, are: Attorney-General’s Department, Department of Agriculture, Fisheries and Forestry, Department of Education, Department of Health, Disability and Ageing, Department of Industry, Science and Resources, Department of Infrastructure, Transport, Regional Development, Communications, Sport and the Arts, Department of Social Services, Department of the Treasury, Department of Veterans’ Affairs, and Services Australia.
Note b: The ‘Not assessed’ category includes measures with no target to assess performance against, or measures where data was not available to report a result.
Note c: Across all results reported in this table, 19 have been excluded as they were the basis of a qualified audit conclusion.
Note: Some percentages do not sum to 100 due to rounding.
Source: ANAO analysis of entities’ annual performance statements.
1.22 Table 1.4 indicates that over the last three years, there have been slight increases in both the proportion of results reported as ‘met’, and in the proportion of measures reported as ‘not met’. There has also been a decline in the proportion of measures in the ‘other’ category, which may indicate an improvement in the quality of reporting as fewer measures lacked targets, or data on which to base performance assessment against the targets. Given the short time period covered and aggregate nature of this summary, it is not possible to draw firm conclusions from this data.
1.23 A richer assessment of performance over time can be obtained by complementing the information in Table 1.4 with analysis regarding the proportion of results that have increased, decreased or remained stable irrespective of whether the result is reported as ‘met’ or ‘not met’. For example, of the 14 entities audited in both 2023–24 and 2024–25:
- the Department of Foreign Affairs and Trade reported 12 measures in 2024–25, all of which were also reported in 2023–24.20 In 2024–25 the department reported nine results as met and three results as partially met. Compared to 2023–24, results improved for two of the measures in 2024–25, remained steady for nine measures and declined for one measure;
- the Department of Industry, Science and Resources reported 95 per cent of the same measures in 2024–25 as in 2023–24. In 2024–25, it reported 12 results as met, four results as partially met and one result as not met. Compared to 2023–24, results improved for four of the comparable measures in 2024–25, remained steady for eight measures and declined for five measures; and
- Services Australia reported 88 per cent of the same measures in 2024–25 as in 2023–24. In 2024–25, it reported five results as met and two results as partially met. Compared to 2023–24, results improved for two of the comparable measures in 2024–25 and remained steady for five measures.
1.24 As the quality of information presented in performance statements improves, it will become increasingly possible to track performance over time and gain insights on whether public funds have been used effectively and efficiently to achieve intended results. Table 1.5 shows an example of fluctuation in performance over time, and associated performance narrative that describes the reasons for change.
Table 1.5: Department of Employment and Workplace Relations’ performance measure: Average processing time for initial claims under the Fair Entitlements Guarantee program
|
Target |
2023–24 result |
2024–25 result |
Department of Employment and Workplace Relations narrative |
|
14 weeks or less |
17.3 weeks (not achieved) |
13.8 weeks (achieved) |
The department implemented a number of strategies that contributed to this improvement, including proactive early engagement with insolvency practitioners on larger cases to support the receipt of more timely and higher quality entitlements data and internal revisions to the operational oversight, processes, management and assessment of claims. |
Source: ANAO analysis of the Department of Employment and Workplace Relations 2024–25 Annual Performance Statements.
The risk of aggregated performance measures
1.25 Performance measure design can impact effective performance assessment and reporting, especially where entities aggregate different topics and data sources in one measure. Aggregated performance measures present risks because they can obscure important detail, mask poor or unbalanced outcomes and reduce transparency.
1.26 For example, in Services Australia’s measure on work processed within timeliness standards, the result is driven by the work type, ‘Health’. Services Australia’s 2024–25 performance statements explain that: ‘The result was influenced by automated health processing, which accounts for 98.8% of all work included in this measure’.21 In other words, social security claims, child support payments, emergency payments and non-automated Health processing account for only 1.2 per cent of all work included in the measure.
Table 1.6: Results against Services Australia performance measure: Work processed within timeliness standards
|
Target |
Reported result (%) |
Results by work type (%) |
|
|
≥90% |
92.4 (achieved) |
Social security |
85.9 |
|
Health |
92.4 |
||
|
Child support payments |
52.3 |
||
|
Emergency payments |
77.0 |
||
Source: Services Australia 2024–25 Annual Performance Statements, Table 15, p. 24.
1.27 The disaggregated information in Table 1.6 is presented in Services Australia’s 2024–25 performance statements. However, aggregating performance across the four work types has enabled an overall performance result of ‘Achieved’ to be reported. If the measure was designed to set the target for each work type separately, three out of four work types would have failed to meet the target. Entities should consider whether the information presented meets users’ needs.
Labelling results
1.28 Gaining an accurate view of performance depends on the quality of performance information. This includes consideration of what and how targets are set (see Chapter 2).
1.29 To account for the vast differences in agency activity, the PGPA Rule enables entities to use discretion in describing their results. However, it is important that these descriptions are reasonable. The integrity of targets may be reduced if an entity can claim performance below a target as fully ‘met’.
1.30 In 2024–25, the Department of Home Affairs and the Department of Infrastructure, Transport, Regional Development, Communications, Sport and the Arts both defined performance below the target as achieving the threshold of ‘met’.22 The auditor’s reports for both departments included an Emphasis of Matter paragraph, drawing the reader’s attention to this method of assessing performance.
Opportunity for improvement
1.31 Entities could improve the quality of performance reporting by ensuring that:
- targets are challenging but achievable;
- narrative and analysis in the performance statements clearly explain performance against targets and trends over time; and
- when aggregated measures combine different topics or data sources in ways that obscure important performance details, ensure there is sufficient explanation of the important details to give readers clearer performance information.
Measuring public sector efficiency
1.32 Efficiency is generally measured as the price of producing a unit of output and is generally expressed as a ratio of inputs to outputs.23 Efficiency measures are central to assessing stewardship in the public sector by demonstrating how well government entities use the resources entrusted to them to deliver government programs and services. If efficiency cannot be measured, productivity cannot be meaningfully assessed.24 Section 16EA of the PGPA Rule requires entities to report a mix of output, efficiency and effectiveness measures (that is, entities should seek to measure efficiency).
1.33 The 21 audited entities reported only four efficiency measures, as assessed by the ANAO. A further two measures had multiple targets, some of which addressed efficiency. These six measures are identified in Table 1.7.
Table 1.7: Performance measures and results addressing entity efficiency
|
Entity |
Measure |
Target |
Result |
|
Australian Taxation Office |
Cost of collection – Cost to collect $100 |
+/- 5c from previous year |
$0.54 (incl GST) $0.51 (excl GST) (Met) |
|
Department of Agriculture, Fisheries and Forestry |
Equal or reduced cost of levies administration compared with levies disbursed |
Levies administration cost is less than or equal to 1.2% of levies disbursed |
1.10% of levies disbursed (Met) |
|
Services Australia |
Cost per payment dollar administered |
Set benchmark |
2.02% (Unable to assess against a target of ‘Set benchmark’) |
|
Department of Foreign Affairs and Trade |
Australian passports are processed efficientlya |
Travel document processing efficiency is greater than or equal to 90% of the agreed benchmark |
115.8% (Met) |
|
Department of Home Affairs |
Delivery of the Migration and Citizenship Programs contributes to economic prosperity and aligns to national interestsa |
Average number of finalisations per Full Time Equivalent (FTE) visa processing officers increases across both permanent and temporary visa caseloads |
176.07 applications finalised per FTE per month (Met) |
|
Department of Employment and Workplace Relations |
Investment per employment outcome |
$3,500 or lower per employment outcome |
$3575 per employment outcome (Not met) |
Note a: These measures have multiple targets. The targets in the table are those that address entity efficiency.
Source: ANAO analysis of entities’ annual performance statements.
1.34 The above measures represent six out of the 449 measures (1 per cent) reported across the 21 audited entities. As the ANAO has observed in previous years, measures of efficiency are rare in entities’ performance statements. The majority of entities audited by the ANAO in 2024–25 did not report any efficiency measures or efficiency targets.
1.35 Several entities reported proxy measures of efficiency, usually in the form of timeliness measures. These accounted for seven per cent of all measures — 31 of 449 measures. The proxy efficiency measures related to the timeliness of a process to produce an output (such as answering a call or processing a claim); they do not assess the inputs used to produce that output. Timeliness measures only show how quickly activities are completed, but, on their own, do not assess how efficiently resources are used to achieve results.
1.36 The lack of genuine efficiency measures suggests a potential absence of efficiency measurement in the public sector. What gets measured gets done — including efficiency measures can help drive efficiency and productivity improvements in the public sector. Entities should consider opportunities to assess efficiency deliberately. Doing so supports proper use and management of public resources and show greater accountability and transparency in how taxpayer funds are used.
1.37 For an entity, efficiency can act as a bridge between financial stewardship and program and service outcomes: even effective services may not represent good public value if they consume excessive resources. Measuring efficiency can ensure that effectiveness is achieved at an acceptable cost.
1.38 Focusing too heavily on efficiency measures in the public sector carries risks because government services often have complex objectives that extend beyond producing outputs at the lowest cost. A narrow focus on efficiency may inadvertently lead entities to prioritise volume over quality, reduce services in ways that disadvantage vulnerable groups, or create incentives to avoid difficult or high-need clients who require more resources. In some areas, an overemphasis on efficiency may undermine quality, outcomes or long-term impact by encouraging short-term cost savings at the expense of meaningful results.
1.39 Linking financial and non-financial information and reporting a broad mix of measures to complement efficiency measures, such as effectiveness and outcome measures, can help to address these risks by providing a more balanced view of performance.
Linking performance results and financial information
1.40 Users of an entity’s annual performance statements can find it difficult to determine how well the entity has performed in relation to its budget. It is often difficult to evaluate how effectively public money has been used by an entity to achieve intended outcomes, as the link between appropriations, expenditure, key activities and results is often not clear.
1.41 Integrating financial and non-financial performance information can provide information on value-for-money from spending and allow for a richer, more balanced understanding of performance. Linking the two helps users understand how resources are being used relative to what is being achieved, particularly if a precise efficiency ratio cannot be calculated. For example, knowing how much funding went into a key activity or performance measure, alongside information about outputs, service quality, customer satisfaction or outcomes, provides valuable insight into whether that function is delivering value to the public. This also supports a more strategic and citizen-centred view of performance. The combined view can help identify broader patterns that might not be visible from a more specific efficiency measure.
1.42 It can also support better decision-making and strategic planning in entities. When financial information is paired with non-financial performance information, senior leaders can identify where resources are producing meaningful impact and where adjustments may be needed.
1.43 Improving links between financial and non-financial performance information may further inform assessments of public sector productivity, noting that the treatment and measurement of public service productivity has long been known to raise difficult but important issues.25
1.44 Table 1.8 shows the kind of performance information that could be presented in performance statements, when financial and non-financial information is brought together. ANAO analysis and the Department of Veterans’ Affairs (DVA) performance statements indicate that DVA has not met most of its targets under Outcome 1, and its performance metrics have declined over time. The addition of financial information from the Portfolio Budget Statements (PBS) provides additional context, that the decline in performance has occurred against a background of increases of $124 million in departmental funding and 870 additional full-time equivalent staff between 2022–23 and 2024–25.
1.45 Importantly, DVA’s performance statements provide explanations and insights into the factors influencing its results, such as a rise in both the number and complexity of claims over this period.26
Table 1.8: Department of Veterans’ Affairs, Outcome 1: performance, budget, and staffing
|
Reporting year |
Number of targets per APS |
Number of targets met per APS |
Total departmental budget per PBS ($m) |
Budgeted average staffing level per PBS |
|
2022–23 |
30 |
11a |
348b |
1,445b |
|
2023–24 |
30 |
9 |
445 |
2,006 |
|
2024–25 |
30 |
8 |
472 |
2,315 |
Note a: This count is reflective of updated results presented in the 2023–24 performance statements, that related to the 2022–23 period.
Note b: These figures are as presented in the March 2022–23 Portfolio Budget Statements. Following the 21 May 2022 federal election, the October 2022–23 Portfolio Budget Statements presented a total departmental budget of $436 million and a budgeted average staffing level of 1,818.
Source: ANAO analysis of DVA’s annual performance statements and portfolio budget statements (PBS).
1.46 Table 1.8 was created by the ANAO from disclosures in the PBS and performance statements. In practice, the financial data in the PBS is typically not directly reflected in performance information in performance statements. Key activities and their performance measures cannot always be directly linked to funding or staffing, because an entity’s PBS rarely presents financial information to enable one-to-one comparisons. This limits analysis of efficiency, value for money and return-on-investment.
1.47 There is clear benefit for the Parliament and the public if entities disclose the relationship between results achieved and the allocation and expenditure of resources in their performance statements. Even without formal efficiency measures, linking financial and non-financial information enhances transparency and improves judgments about productivity and performance. It also promotes prudent stewardship of public resources and helps ensure public funds are used effectively to achieve outcomes and impact.
Opportunity for improvement
1.48 Accountability would be strengthened if entity resource information presented in portfolio budget statements could be linked to key activities or measures in performance statements. There is scope for the Department of Finance to issue guidance on this topic.
Measuring outcomes and impact
1.49 Many of the challenges confronting the public sector are long-term or intergenerational in nature. If entities are to anticipate and successfully respond to these challenges, they need to be able to measure and assess their performance by considering both immediate outcomes and sustained, long-term results.
1.50 Entities should look for ways to directly measure their purposes and outcomes, rather than primarily focusing only on measuring their activities and outputs, if they are to improve their impact and demonstrate effective stewardship of public resources. Across the 21 audited entities outcomes and impact are less frequently measured than outputs and activities.
1.51 Effectiveness measures have the potential to indicate whether outcomes are being achieved.27 However, audit experience shows that most effectiveness measures reported by entities are not specifically designed for this purpose. Many focus on individual programs, policies, or activities and do not capture the achievement of longer-term strategic outcomes.
1.52 One example of an outcome-focused effectiveness measure is the Department of Climate Change, Energy, the Environment and Water’s performance measure CCE01, Australia’s emissions and projected emissions are on track to meet legislated outcomes. The performance result reflects the outcomes of various government and non-government initiatives and approaches to reduce emissions.
1.53 Several entities in 2024–25 have included information on impact and outcomes in the narrative and analysis in their performance statements. For example, the Department of Infrastructure, Transport, Regional Development, Communications, Sport and the Arts, uses ‘spotlight’ sections to demonstrate how performance results of output measures contributes to program outcomes. The department’s measure 2 describes whether milestone claims for payments on Infrastructure Investment Program projects have been assessed, with accurate and complete claims authorised for payment. A ‘spotlight’ beneath this measure highlights one of the Program’s projects, the Bunbury Outer Ring Road Project. It outlines the project’s design, budget, and in-year milestones, as well as the benefits of the project to the outcomes of road safety, travel time, and local employment.
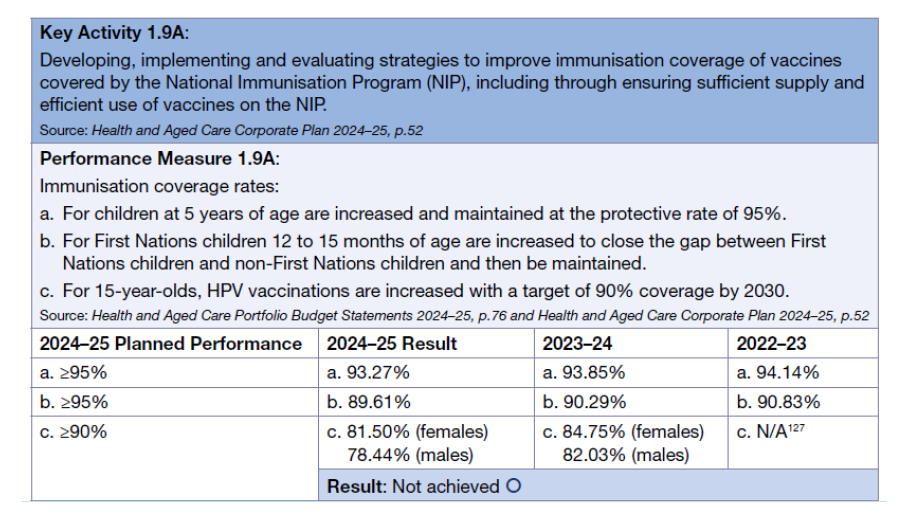
1.54 In addition, as shown below, the Department of Health, Disability and Ageing has included narrative in its performance statements regarding the desired impact of the Immunisation program.
|
Case study Department of Health, Disability and Ageing — Program 1.9 Immunisation |
|
The program’s impact is realised through increased coverage, which in turn reduces the incidence and burden of vaccine-preventable diseases. This relationship is well established: as coverage improves, rates of disease, hospitalisation and death decline. According to the AIHW 2019 report ‘The burden of vaccine preventable diseases in Australia’, studies showed the rate of vaccine-preventable burden decreased by 31% between 2005 and 2015. 124 This reduction occurred where vaccines were added to, or eligibility was extended under the NIP such as human papillomavirus (HPV), pneumococcal disease and rotavirus. This reinforces the program’s critical role in protecting individual and community health. Source: The Department of Health, Disability and Ageing 2024–25 Annual Report, page 84 |
Entities’ performance and people’s wellbeing
1.55 The Australian Government has developed a national wellbeing framework — ‘Measuring What Matters’ (MWM) — which aims to measure what Australians value for their wellbeing and track progress over time. The purpose of the MWM framework is to provide information useful in guiding national public policy to promote and improve the wellbeing of people in Australia.28 There are 50 indicators, grouped under five themes: healthy, secure, sustainable, cohesive and prosperous.
1.56 At this stage, there is limited alignment between the MWM Framework and entity performance statements. Only a few MWM indicators are reflected in performance measures in audited entities’ 2024–25 annual performance statements.29 There would be merit in entities considering whether annual performance statements could map key activities to the five wellbeing themes or align MWM indicators with corporate plans and performance statements where relevant. This could help to bring a focus to long-term or intergenerational issues that have been deemed important for measuring national progress. The Department of Veterans’ Affairs provides an example, in seeking to measure veteran wellbeing. It has introduced a dedicated wellbeing performance measure to consider how well clients perceive they are supported by the department’s services across various aspects of their lives. The intent is to enable the department to take a more holistic view of client outcomes, beyond transactional service delivery.30
2. Assessing performance requires meaningful information
Introduction
2.1 An object of the Public Governance, Performance and Accountability Act 2013 (PGPA Act) is for the Commonwealth and Commonwealth entities to provide meaningful information to the Parliament and the public. The revised Explanatory Memorandum to the PGPA Bill (that led to the PGPA Act) explained the context for meaningful information:
for the Parliament to properly fulfil its oversight function, performance information is crucial to assessing whether policy goals are being achieved. Performance information also shows how effectively the public sector has performed. The quality of information is more important than the quantity.31
2.2 In seeking to ensure meaningful information is presented to the Parliament, the PGPA Act introduced the requirement for entities to prepare a corporate plan and annual performance statements. It also makes provision for the performance statements to be audited by the Auditor-General, following a request from the Finance Minister or the responsible Minister.
2.3 The corporate plan and performance statements, together with the Portfolio Budget Statements32, provide an integrated view of what the entity aims to achieve, how it proposes to achieve it using public resources, what progress it has made and the outcomes it has achieved. The requirement for entities to prepare these documents acknowledges that public sector performance is more than financial33 and can often be a ‘blurry, elusive concept’34. Requiring entities to report against the expectations set out in a corporate plan promotes a strategic focus on entity purposes and improves accountability and transparency about how public resources are used and what results are achieved.
2.4 The 2024–25 audit program shows that entities have improved their ability to produce performance statements that meet the minimum legal requirements of the PGPA Act. While this progress is recognised, audit work shows that compliance with minimum legal requirements does not necessarily produce information that is appropriate and meaningful for the entity or for users assessing the entity’s performance in achieving its purposes.35 Entities continue to default to easily quantifiable (and auditable) performance measures, even when these do not accurately reflect the impact of their activities.
2.5 Inadequate performance information presents challenges not only for Parliament, but also for the government and accountable authorities. Parliament and the public require meaningful performance information to assess whether entities are delivering on their purposes and using public resources efficiently and effectively. Decision-makers, as stewards of public resources, require clarity to make informed decisions.
What is ‘meaningful information’?
2.6 The Department of Finance states that ‘Performance planning and reporting should [… provide] meaningful performance information’.36 However, ‘meaningful information’ is not defined for the purposes of the Commonwealth Performance Framework. It is therefore a subjective and gradable concept under current performance reporting arrangements. What is meaningful information for one reader may be less meaningful for another. Information could be described as ‘meaningful’, while recognising that it could be more meaningful.
2.7 Factors identified through the performance statements audit program that suggest information is meaningful include that it:
- complies with the requirements of the PGPA Rule;
- is complete and measures and assesses what matters the most to users, not just what is easy to measure37;
- relates directly or clearly links38 to the entity’s purposes or key activities — that is, it reflects both what an entity can directly control and where it contributes to results;
- goes beyond simply tracking activities or outputs to capture outcomes and, where possible, contributions to longer term impact;
- provides a clear, accurate and balanced presentation of the entity’s performance in achieving its purposes;
- is useful for accountability, improvement and decision-making purposes;
- is aligned with how the entity measures and assesses its performance for internal management and accountability purposes; and
- meets user needs as it is the type of performance information sought by key stakeholders, such as Parliament and the public, reflecting their interests and perspectives.
2.8 Clarity of the Commonwealth Performance Framework would assist entities to better understand the qualities that make annual performance statements stakeholder focussed and meaningful.
‘Meaningful information’ and performance statements audits
2.9 The New Zealand Accounting Standards Board (NZASB) has issued a Standard39 for the reporting of service performance information. As noted by the NZASB, the Standard establishes high-level requirements because, among other reasons:
(c) It provides flexibility for entities to determine how best to ‘tell their story’ in an appropriate and meaningful way.40
2.10 The NZASB opted for a high level, principles-based approach to provide sufficient flexibility for entities to ‘tell their story’ in a way that is meaningful for them and their users, to avoid some of the difficulties that could arise with a more prescriptive approach and to avoid imposing unnecessary costs.41
2.11 There is no equivalent Australian Standard42 to the NZASB Standard for service performance information. Rather, the Commonwealth Performance Framework, including the PGPA Act and Rule and Finance Resource Management Guides, operates as one for Commonwealth entities and has similar flexibility as in New Zealand. In addition, the ANAO’s audit criteria regarding completeness and fair presentation aim to promote reporting beyond minimum compliance with the Commonwealth Performance Framework requirements, enabling auditors to assess and evaluate whether performance statements meet the object of the PGPA Act for entities to prepare meaningful information to the Parliament and the public.43
2.12 Figure 2.1 conceptualises the key building blocks for an entity to provide appropriate and meaningful performance information to the Parliament and the public. An entity-wide performance framework is a key tool for strategic planning and developing an entity’s corporate plan. It is also what drives behaviour and business planning in an entity.44 An entity’s performance framework ensures that the key elements of meaningful information in performance statements are met:
- completeness — of purposes and key activities;
- appropriateness — of performance measures and targets; and
- clear, comprehensive and insightful narrative and analysis.
Figure 2.1: The building blocks for ‘meaningful information’
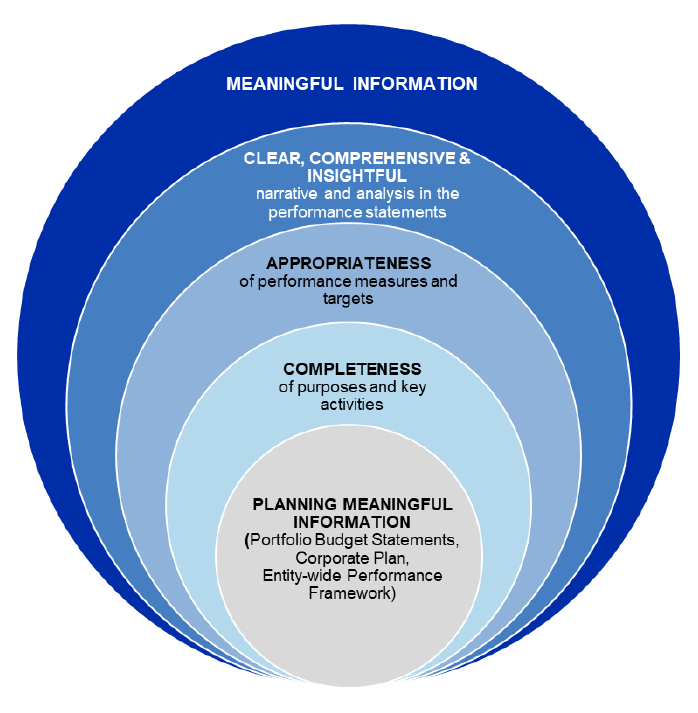
Source: ANAO
Completeness of purposes and key activities
2.13 Clearly defining an entity’s purposes45 is fundamental for reporting meaningful performance information. ‘Purposes’ should consider the entity’s outcomes and programs in its Portfolio Budget Statements, its enabling legislation and statutory obligations, and its Administrative Arrangements Order. The Department of Finance advises that an entity’s purpose statement in its corporate plan should be sufficiently specific to allow for meaningful measurement and assessment, and relevant to reflect medium to long term goals.46
2.14 Key activities represent the main things the entity does to deliver on its purposes. They form the link between purpose, performance and accountability. By clearly identifying what activities are most critical to achieving its purpose, an entity can focus resources efficiently, set appropriate performance measures and targets, and communicate its achievements and impact more clearly.
2.15 Audits show that there is benefit in entities establishing a systematic approach for identifying their key activities. Business plans, and the entity’s organisational structure, can be a good starting point. Other reference points may include the value of appropriations for programs and sub-programs, whether the initiative is a priority of government, and whether it is of public or parliamentary interest. When key activities are overlooked, important performance information may be left out of performance statements.
2.16 Most entities in the 2024–25 performance statements audit program have either an established basis to identify their purposes and key activities or have plans to develop this basis. An entity that applies a clear approach to set and review its purposes and key activities has a platform from which to develop meaningful performance information.
Reporting on statutory office holders within entities
2.17 Entities should pay particular attention to reporting on those functions that relate to statutory office holders that are not a listed entity 47 under the PGPA Act in their own right but are supported financially and administratively by a portfolio department or a listed entity. The 2024–25 audits identified a potential gap regarding whether, and in what manner, PGPA Act entities should report on the functions of such statutory authorities or office holders. This is particularly relevant for measuring and assessing the achievement of the entity’s purposes, given that many such authorities or office holders have separate reporting obligations outside the PGPA Act, while the accountable authority of the PGPA Act entity remains responsible for performance reporting under the Act.
2.18 The ANAO observed that entities had different approaches to reporting on the role of these statutory authorities and office holders, with some reporting on these functions in their performance statements and others not, without a clear rationale. One example of clarity is the Australian Taxation Office (ATO), which expressly includes the Tax Practitioner’s Board (TPB) and the Australian Charities and Not-for-profits Commission (ACNC) in the description of the ATO as a listed entity in the PGPA Rule.48
Opportunity for improvement
2.19 The Department of Finance could provide guidance for entities to report, in their performance statements, on the functions of statutory authorities and office holders that are not a separate PGPA Act entity and are financially and administratively supported within the entity, recognising that the accountable authority remains responsible for performance reporting under the PGPA Act.
Materiality is maturing
2.20 The information needs of Parliament, government and the public are diverse and wide-ranging. Performance statements are not intended to include every piece of information needed by all users for accountability or decision-making.
2.21 Materiality focuses on what is important to users when relying on the performance statements to make informed decisions. It guides auditors to identify the areas of performance information where errors or omissions could reasonably influence users’ assessments or decisions. Materiality and the assessment of risk factors, such as biased performance measures, incomplete reporting, or unreliable data, assist the auditor to focus their work on measures, disclosures, and systems that are more likely to result in a material misstatement.
2.22 The concept of materiality helps ensure that performance statements remain focused, relevant, and meaningful by guiding entities to prioritise performance information that is most relevant to stakeholders’ needs and decision-making. It enables entities to strike a balance between completeness and conciseness, helping them to avoid overloading reports with excessive or low-value information that obscures key messages. Where appropriate, entities can provide links to other relevant information for readers seeking additional detail.
2.23 When the performance statements audit program commenced in 2021–22, many entities did not have an established materiality policy or if one had been established, the primary focus was on the financial scale of a function. Notably, the 2024–25 audits found that most entities had a defined materiality policy in place that looked at a wider range of factors to determine what is material. In addition to financial factors, materiality policies also consider matters of Parliamentary attention, government priorities, and areas of public interest.
2.24 Figure 2.2 shows that entities are subject to a broad set of accountability and performance related requirements, which in many instances require the production of performance information.49 Unlike annual performance statements, most of this information is not subject to systematic assurance by the ANAO and not every report is fully scrutinised by the Parliament.
2.25 The current landscape of requirements has accumulated through incremental changes over many decades. This build-up appears to have resulted in increased reporting by entities and has made it difficult to determine how the requirements relate to each other. As a result, it is sometimes unclear if the reporting system enables Parliament to effectively hold the Executive accountable for its performance.
2.26 Ensuring that annual performance statements contain all ‘material’ information can bring a degree of coherence to the reporting landscape. Although performance statements might not be of equal relevance to all users, they can serve as a core accountability document, providing the starting point from which to explore and question for more specific purposes. For example, the ANAO encourages entities to include references to other documents and reports, where appropriate, rather than repeating content across multiple sources.50
Figure 2.2: Relationship of performance statements audits to government policies and frameworks
Source: ANAO.
2.27 The ANAO has found that entities already produce relevant and useful information, both for day-to-day management and governance purposes as well as to fulfil accountability obligations. Consequently, many entities will not generally need to collect and design information specifically for performance statements. Instead, they should first seek to determine what existing performance information can be used to tell a meaningful story of the entity’s performance in achieving its purposes.
Appropriateness of measures and targets
2.28 Performance information can be either quantitative or qualitative. While quantitative measures can at times offer advantages, including precision, in many cases qualitative approaches may be preferable — rather than measures this could include a summary of progress and stakeholder perceptions of what has been achieved. This recognises that performance measurement and reporting in the public sector is about increasing understanding and knowledge rather than seeking precision through numbers alone.
2.29 Logic models show how government policies, programs or other interventions are intended to work by illustrating causal links between inputs, activities, outputs and outcomes. They can assist entities to identify the results they aim to achieve and determine what aspects are within their direct control — and assist in establishing appropriate measures for both. Effective use of logic models demonstrates that the entity has thoughtfully considered the selection of its performance measures. Only a few entities in the 2024–25 performance statements audit program had developed and applied logic models systematically to establish their performance measures.
2.30 The 2024–25 audit results highlight a number of factors that support entity compliance with the requirements of s16EA of the PGPA Rule.51
- Providing context on why a particular measure was chosen can help readers understand its relevance.
- Performance measures should be clear and understandable, making them easy to interpret by everyone who uses them. It is important to avoid unnecessary ambiguity, complexity or technical jargon, which can make it harder for Parliament and the public to understand what the entity is trying to achieve and whether it is succeeding.
- Given that entity operations are complex, multifaceted and influenced by many factors, a single performance measure will rarely fully measure an entity’s performance in achieving its purposes. Similarly, where key activities are broadly defined, a single measure may not adequately capture all the important aspects of performance.
- In assessing whether performance measures provide adequate coverage of key activities or purposes, entities should select only those measures needed to measure and assess performance. They should avoid focussing too heavily on the quantity of measures. Too many measures can lead to information overload and obscure what truly matters.
- Among the 21 audited entities, there was significant variability in the approach to reporting performance measures against key activities. The National Disability Insurance Agency and the Department of Industry, Science and Resources both report, on average, six measures per key activity. The Department of Health, Disability and Ageing reports, on average, one measure per key activity.
2.31 An identified risk to meaningful reporting is the PGPA Rule requirement for performance measures to relate directly to an entity’s purposes or key activities. Although this requirement promotes relevance and accountability, it may also narrow the focus of an entity’s performance assessment if interpreted as requiring ‘direct control’. A narrow interpretation may lead entities to overlook indirect outcomes and long-term impacts. Additionally, entities may prioritise quantitative measures over qualitative ones, focusing on what is easy to measure rather than what is meaningful.
2.32 The 2024–25 audits identified numerous measures indicative of this risk, including those reporting on dollars spent on service provision or number of grants administered. On their own, such measures have limited value in reporting whether entities are operating efficiently and effectively in achieving their purposes, thereby delivering public value. Complementing such measures with additional measures or narrative that report on outcomes and impact would provide a more meaningful picture of performance.
2.33 As performance reporting matures, entities are increasingly complementing their purpose and key activity aligned measures with measures that capture long-term outcomes and impact. Alternatively, they include narrative and analysis that reports on the broader dimensions of performance as reflected in the following example from the Department of Health, Disability and Ageing.
|
Case study Department of Health, Disability and Ageing — Program 1.9 Immunisation |
Source: Department of Health, Disability and Ageing 2024–25 Annual Report, page 85 The Department of Health, Disability and Ageing (DHDA) developed measures related to coverage rates that it does not directly control. It also included in its narrative the aspects of performance that it does control and that are directly related to the key activity. That is: 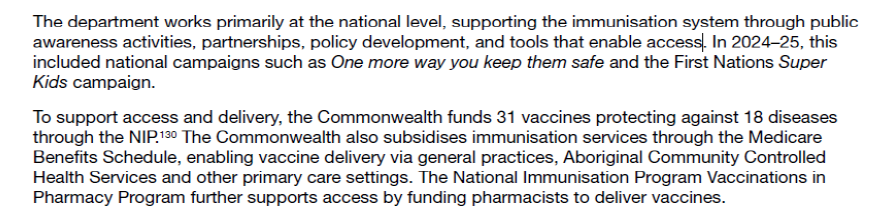
Source: Department of Health, Disability and Ageing 2024–25 Annual Report, page 86 |
Measure what matters the most
2.34 The effectiveness of many Australian government policies, programs and services can be difficult to measure, particularly in a system of accountability that is focussed on individual entities. Performance can be influenced by many factors beyond the impact of an entity’s activities, some of which may only be evident over long periods of time. Factors such as other government actions or programs, economic conditions, demographic changes, social trends and partner entity activities can all influence outcomes.
2.35 Causality is difficult to establish and can create challenges for preparers of performance statements and auditors. It can affect the reliability, credibility, and usefulness of performance information. Performance statements may unintentionally (or strategically) oversimplify cause-and-effect links to make the entity’s performance appear stronger or more direct. This can lead to conclusions that can be misrepresented or present unrealistic expectations about the effectiveness of interventions, and what policies or programs can achieve. For example, the Department of Employment and Workplace Relations might report improved job placement rates, but these could also reflect broader economic growth rather than the entity’s specific interventions.
2.36 Performance statements may also default to easily quantifiable outputs, like activity counts or service volumes, rather than meaningful outcomes. This can result in performance statements that give a misleading view of success based on actions instead of actual results.
2.37 Without thoughtful consideration of the attribution of results, little can be said about the performance of entities or the success of a policy or program; nor can evidence-based advice be provided about future directions. Preparers of performance statements must decide how to report results that they do not directly control in a balanced way without overstating their influence, while auditors must exercise significant professional judgement to assess whether the claims of impact are reasonable and supported by evidence. Without critically examining whether reported outcomes are the result of the entity’s actions, auditors may inadvertently endorse performance claims that are based on weak or coincidental relationships.
2.38 Dealing with the risks of overstating or understating causality requires a transparent and carefully designed approach. This includes preparing performance statements that clearly describe the assumptions behind performance results and acknowledge any external factors beyond the entity’s control that may have contributed to the results achieved.
2.39 The ANAO has been evolving its audit approach, learning lessons as the audit program matures and responding to feedback from the sector. An area of specific focus has been to mitigate the risk of creating perverse incentives for agencies to measure what can easily be measured and attributed to agency activity, rather than measuring what matters. Entities may hesitate to adopt ambitious or innovative performance measures, prioritising compliance over meaningful insight, due to concerns about receiving negative audit comments. Consistent data collection, clear documentation and transparent reporting of such information can strengthen confidence in reported performance and help prevent auditors and users from making overly simplistic cause-and-effect judgements.
Narrative and analysis
2.40 Providing narrative and analysis in performance statements is important because it gives context, meaning, and explanation to enhance user understanding of the raw data presented by performance measures. Performance measures assess what happened. Clear, comprehensive and insightful narrative can assist users to interpret results by explaining trends, variances, and influencing factors — for example, why a target was exceeded or missed, or how external factors such as policy changes or economic conditions affected results.
2.41 Narrative and analysis can address potential completeness issues, by complementing the performance measures and linking to other relevant information and reports produced by an entity. For example, entities that have a high proportion of output measures could provide information on outcomes and impact in the narrative and analysis, providing a more comprehensive picture of performance.
2.42 Historical performance data is valuable. Forward-looking insights and narrative, such as future performance targets and planned remedial actions by the entity to address performance shortfalls, can help stakeholders understand an entity’s preparedness to respond to upcoming developments, challenges and opportunities. This can help to build trust and confidence that the entity is committed to achieving long term outcomes and impact, rather than focusing solely on short-term performance.
Presentation
2.43 The format for presenting the performance statements is important because how the information is communicated directly affects how well it is understood, trusted, and used by the Parliament, decision-makers, stakeholders, and the public. Tables, graphs, diagrams, charts, case studies, and plain-language explanations can make complex information more accessible and engaging.52
2.44 When performance information is presented in a clear, logical, and visually accessible way, it allows readers to quickly grasp trends, achievements, and areas needing improvement. Poorly structured or overly technical reports, on the other hand, can obscure key messages and lead to misinterpretation or disengagement.
2.45 An emerging better practice is the inclusion of a departmental overview that summarises the overall results achieved across all measures. These concise summaries give readers a quick understanding of performance, enabling them to identify areas of interest and navigate directly to relevant sections for deeper analysis. An example is The Department of Social Services’ (DSS) 2024–25 performance statements, as shown in Better practice example 1 below.
|
Better practice example 1 DSS: use of charts to represent overall results |
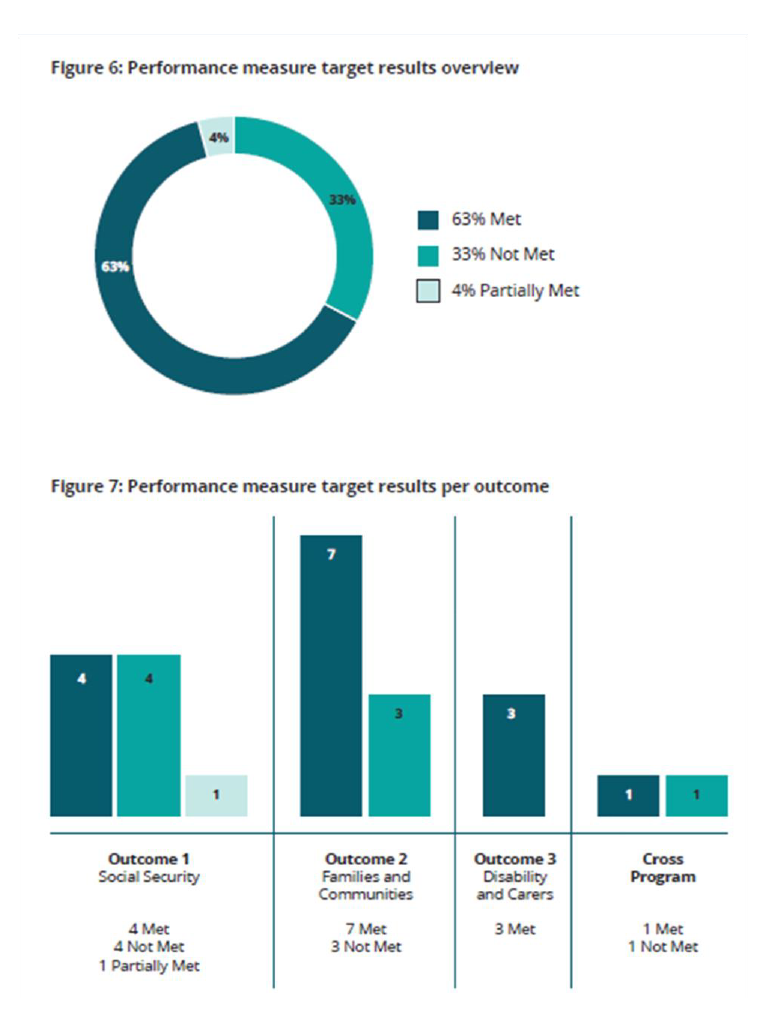
Source: Department of Social Services 2024–25 Annual Report, page 20 DSS presents its overall performance results using clear, visually engaging charts that make complex data easy to understand. This visual approach enhances transparency and improves comprehension, making it far easier for stakeholders to interpret results than text-heavy reporting alone. |
2.46 Navigation aids such as a summary of performance results and page reference numbers in performance statements are an effective tool enabling readers to quickly access detailed information on specific measures within a comprehensive report. An example of this approach can be seen in Education’s 2024–25 performance statements, as shown in Better practice example 2 below.
|
Better practice example 2 Education: use of page number references |
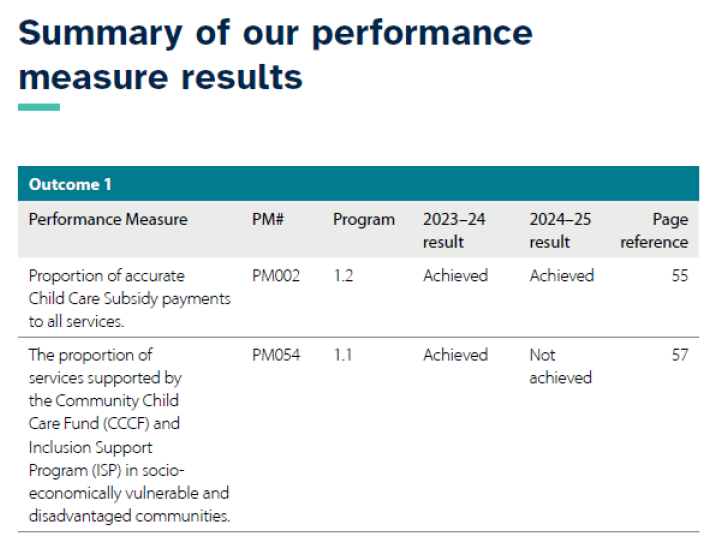
Source: Department of Education 2024–25 Annual Report, page 45 Education’s performance statements include page references for each measure, allowing readers to move seamlessly from summary tables to in-depth discussions of results, methodologies, and context. This structured approach enhances clarity, minimises search time, and improves overall usability, making complex reports more accessible and user-friendly. |
Comparing performance across entities
2.47 There are opportunities for the sector to consider the merit of a common measurement approach across entities with similar functions or key activities, such as regulation, compliance and the processing of claims.
2.48 Common performance measures across entities with similar functions offer benefits in terms of comparability, consistency, and accountability. When entities use similar indicators, it becomes easier to compare performance across entities and consider which approaches are working more effectively and why.
2.49 Table 2.1 shows an example of a similar function performed by different entities, with similar performance measures.
Table 2.1: Performance measures relating to operation of Grants Hubs
|
Entity |
Measure |
Target |
Result (%) |
|
Department of Industry, Science and Resources |
Maintaining applicant satisfaction with the business.gov.au portal grants application process |
Year-on-year maintenance of, or increase in, the proportion of applicants who are satisfied or very satisfied with their experience |
87 |
|
Department of Social Services |
Proportion of grant applicants and recipients satisfied with their Hub grant experience |
Grant applicant and recipient experience is 70% positive or above |
80 |
Note: The Department of Industry, Science and Resources administers the Business Grants Hub and the Department of Social Services administers the Community Grants Hub.
Source: Department of Industry, Science and Resources and Department of Social Services 2024–25 annual performance statements.
2.50 Common performance measures can foster collaboration, learning, and efficiency within the public sector. Entities performing similar functions can exchange better practices, learn from one another’s successes and challenges, and collectively improve service delivery. Overall, common performance measures can enhance the quality of performance management and the effectiveness of public service delivery.
2.51 Table 2.2 shows how three entities report on a comparable function of achieving employment outcomes for individuals. There are elements of overlap in methodologies, such as measurement against a 26-week timeframe by all three entities, which could enable comparison of the performance of the different programs. In other areas, there are contrasting measurement approaches, diminishing consistency and comparability. It would be easier to compare performance if common measures were adopted more widely.
Table 2.2: Employment Programs reporting in 2024–25
|
Entity |
Performance measure |
Target |
Result |
|
Department of Employment and Workplace Relations |
Proportion of Workforce Australia Services participants who achieve a 26-week employment outcome |
15% or higher |
11.7% |
|
Investment per employment outcome |
$3,500 or lower per employment outcome |
$3,575 |
|
|
National Indigenous Australians Agency |
Portion of [Community Development Program] participants that achieve a 26-week employment outcome. |
4% or higher |
4.1% |
|
Department of Social Services |
Extent to which people with disability are supported to find and maintain employment through Disability Employment Services |
≥40% to 13 weeks |
42.8% |
|
≥30% to 26 weeks |
37.3% |
||
|
≥20% to 52 weeks |
23.9% |
||
Source: Entity 2024–25 Annual Performance Statements
2.52 The ANAO sees opportunities for improved performance assessment if there was consistency across like functions. If it saw merit in a common approach for like functions, the Department of Finance would have a role to promote consistency through its Resource Management Guides.
Assessing the effectiveness of cross-cutting initiatives
2.53 When multiple entities contribute to a shared outcome or objective, it becomes challenging to determine which entity is responsible for which aspect of performance. This attribution problem complicates both internal performance management and external assurance processes.
2.54 In the Federal budget context, linked programs refer to government programs that contribute collectively to the achievement of a shared outcome or policy objective, even if they are managed by different portfolios or agencies. These programs are ‘linked’ because they work together toward a common goal: for example, multiple departments contribute to the outcome of strengthening national security.
2.55 The ANAO considers that, if used consistently and effectively, linked programs can allow performance reporting to assess not only individual entity achievements, but also the combined effectiveness of entity efforts in delivering public value. In effect, reporting through linked programs, where appropriate, could support a more integrated, outcome-focused understanding of performance across the public sector.
2.56 For example, entity funding relating to the acquisition of nuclear-powered submarines is presented as a standalone program in the Portfolio Budget Statements of seven53 of the 21 audited entities. Under the Finance Secretary’s Direction, each of these programs requires at least one associated performance measure.54 This brings a level of consistency to reporting of expenditure against this initiative and demonstrates the importance the government and Parliament places on it. All seven entities reported performance measures in their performance statements relating to these programs. Performance measures can be designed to explain the contribution an entity makes towards achieving common objectives. Narrative and analysis can then explain the contribution other entities make towards achieving those common objectives and the entities they work with to achieve their results.55
2.57 There are gaps in entity reporting on cross-cutting initiatives, making it difficult to track spending and assess value for money. The 2024–25 audits observed the following in relation to initiatives that could benefit from more integrated performance reporting.
- No audited entity has a PBS program dedicated to the National Agreement on Closing the Gap.56 Of the 17 targets under the National Agreement, only two57 are reported on as performance targets in the 21 performance statements audited in 2024–25.58 Of these performance targets, one was reported as ‘achieved’ and one ‘not on track’ in 2024–25. The National Indigenous Australians Agency has a target on delivery and implementation of the whole National Agreement.59 In 2024–25, this target was reported as ‘not achieved’, with only 52 per cent of milestones delivered within timeframes.
- The Australian Taxation Office’s performance measure ‘Tax gap—as a proportion of revenue’ no longer includes an estimate of the gap related to tobacco excise. On 1 July 2024, the government established the Illicit Tobacco and E-Cigarette Commissioner within the Department of Home Affairs. One of the Commissioner’s legislated responsibilities is to prepare a report on the illicit tobacco and e-cigarette trade in Australia. The report is to be prepared in collaboration with the Australian Taxation Office and published as soon as practicable on or after 1 July each year. The inaugural report60 was released after the performance statements were published, but provides an opportunity for linked reporting across the tax gap in the future.
Opportunity for improvement
2.58 Given the complex and interconnected nature of many government programs, there is an opportunity for entities to consider how to present shared outcomes, entity contributions, and coordinated delivery in performance statements.61 Doing so would allow entities to demonstrate how they operate in a coordinated way to ensure that relevant programs work effectively together and not at cross-purposes.
3. Performance reporting and maturity improved in 2024–25
Introduction
3.1 Overall, audited entities improved their performance reporting in 2024–25 compared to 2023–24. This continues the trend of improvement observed since the ANAO’s performance statements audit program began five years ago and reflects in part the value of the ANAO’s audit program in enhancing public sector governance and transparency to the Parliament.
2024–25 performance statements audits — what did we find?
Audit approach
3.2 The 2024–25 audits were conducted applying the same audit criteria as in previous years.
- Are the entity’s key activities, performance measures and specified targets appropriate to measure and assess the entity’s performance in achieving its purposes?
- Are the performance statements prepared based upon appropriate records that properly document and explain the entity’s performance?
- Do the annual performance statements present fairly the entity’s performance in achieving the entity’s purposes in the reporting period?
3.3 The ANAO applied these criteria to provide reasonable assurance as to whether each audited entity’s performance statements:
- present fairly the entity’s performance in achieving its purposes; and
- are prepared, in all material respects, in accordance with the requirements of the Public Governance, Performance and Accountability Act 2013 (the PGPA Act).
3.4 Fair presentation of the entity’s performance includes whether the performance statements give a balanced, complete and accurate picture of the entity’s performance, reporting both favourable and unfavourable aspects of performance in an objective manner. Fair presentation also requires information to be presented without bias, exaggeration or omission of material facts that could mislead readers about how well the entity has performed.
3.5 Collectively, the 21 audited entities were responsible for $868 billion in revenue and $858 billion in expenditure in 2024–25 — over 85 per cent of all revenue and expenditure presented in public sector entities’ financial statements.
Timing and overall results
3.6 Table 3.1 outlines the timing and results from the 21 entities audited in 2024–25.
Table 3.1: Timing and results of 2024–25 performance statements audits
|
Entity |
Date performance statements signed |
Date audit report signed |
Report type |
EoM |
|
Attorney-General’s Department (AGD) |
23 September 2025 |
24 September 2025 |
✔ |
|
|
Australian Taxation Office (ATO) |
10 October 2025 |
13 October 2025 |
Q |
E |
|
Department of Agriculture, Fisheries and Forestry (DAFF) |
29 September 2025 |
22 October 2025 |
✔ |
E |
|
Department of Climate Change, Energy, the Environment and Water (DCCEEW) |
17 September 2025 |
18 September 2025 |
✔ |
|
|
Department of Defence |
10 October 2025 |
14 October 2025 |
✔ |
E |
|
Department of Education (DoE) |
2 September 2025 |
4 September 2025 |
✔ |
|
|
Department of Employment and Workplace Relations (DEWR) |
24 September 2025 |
9 October 2025 |
✔ |
|
|
Department of Finance (Finance) |
17 October 2025 |
17 October 2025 |
✔ |
|
|
Department of Foreign Affairs and Trade (DFAT) |
11 September 2025 |
12 September 2025 |
✔ |
|
|
Department of Health, Disability and Ageing (DHDA) |
25 September 2025 |
15 October 2025 |
Q |
E |
|
Department of Home Affairs (Home Affairs) |
9 October 2025 |
28 October 2025 |
Q |
E |
|
Department of Industry, Science and Resources (DISR) |
22 September 2025 |
24 September 2025 |
✔ |
|
|
Department of Infrastructure, Transport, Regional Development, Communications, Sport and the Arts (DITRDSCA) |
12 September 2025 |
15 September 2025 |
✔ |
E |
|
Department of Parliamentary Services (DPS) |
11 September 2025 |
11 September 2025 |
✔ |
|
|
Department of the Prime Minister and Cabinet (PM&C) |
7 October 2025 |
17 October 2025 |
✔ |
|
|
Department of Social Services (DSS) |
2 October 2025 |
3 October 2025 |
✔ |
E |
|
Department of the Treasury |
24 September 2025 |
24 September 2025 |
✔ |
|
|
Department of Veterans’ Affairs (DVA) |
30 September 2025 |
30 September 2025 |
Q |
|
|
National Disability Insurance Agency (NDIA) |
18 September 2025 |
1 October 2025 |
Q |
E |
|
National Indigenous Australians Agency (NIAA) |
3 October 2025 |
7 October 2025 |
Q |
|
|
Services Australia |
26 September 2025 |
29 September 2025 |
✔ |
E |
Key: ✔ Auditor’s report unmodified, Q Auditor’s report contains a Qualification, E Auditor’s report contains an ‘Emphasis of Matter’ (EoM)
Note: Consistent with the requirements of the PGPA Act, the Auditor-General provided auditor’s reports to the Minister for Finance on 10 November 2025. The Minister for Finance tabled the auditor’s reports in the Senate on 4 December 2025.
Source: ANAO
3.7 As shown in Table 3.1, ten of the 21 entities prepared a signed set of performance statements, and received the auditor’s report, on or before 30 September 2025. The ANAO is further improving the efficiency of its audits, which will enable it to better meet this deadline. Timeliness of completion and auditing of performance statements will assist the sector to be in a position to include audit reports in annual reports in the future (see paragraph 1.4).
Audit conclusions and additional matters
3.8 Table 3.1 shows that 15 of the 21 auditees received an auditor’s report with an unmodified (or clean) conclusion. 62 The remaining six auditees received a qualified audit conclusion, identifying material areas where users could not rely on the performance statements.
3.9 The two broad reasons behind the qualified audit conclusions were:
- Completeness — the performance statements were not complete as important information was omitted. As a result, they did not present a full, balanced and accurate picture of the entity’s performance; and
- insufficient evidence — the ANAO was unable to obtain sufficient appropriate evidence to reach a conclusion regarding the entity’s annual performance statements.
3.10 Table 3.2 shows that the proportion of audited entities receiving a qualified audit conclusion has continued to gradually decrease since the start of the performance statements audit program. In addition, the proportion of entities’ measures that were the basis for a qualified conclusion decreased in 2024–25, compared to prior years. Table 3.2 defines the findings categories.
Table 3.2: Summary of audit conclusions
|
Reporting year |
Number of audited entities |
Number of Entities with qualified audit conclusions |
Proportion of entities that received qualified conclusion (%) |
Measures to the basis for a qualified conclusion as |
|
2024–25 |
21 |
6 |
29 |
4 |
|
2023–24 |
14 |
5 |
36 |
10 |
|
2022–23 |
10 |
4 |
40 |
4 |
|
2021–22 |
6 |
3 |
50 |
7 |
Note: 18 of the 449 measures reported by the 21 entities in 2024–25 were the basis for a qualified conclusion. This includes measures with multiple targets where only some of the targets were the basis for a qualified conclusion.
Source: ANAO
3.11 Where appropriate, an auditor’s report may separately include an ‘Emphasis of Matter’ paragraph. An Emphasis of Matter paragraph does not modify the auditor’s conclusion; rather, it draws the reader’s attention to a matter in the performance statements that is important for the reader to consider, when interpreting those statements. As shown in Table 3.1, nine of the 21 auditees received an auditor’s report containing an Emphasis of Matter paragraph (43 per cent of auditees). By contrast, in 2023–24, eight of the 14 entities audited had an Emphasis of Matter included in the auditor’s report (57 per cent of auditees).
Audit findings
3.12 Audit findings and recommendations are communicated to entities when the ANAO identifies potential business or performance reporting risks or opportunities to drive improvement in entity governance and performance reporting arrangements. By identifying specific issues along with their causes and potential impacts, audit findings enable entities to take corrective action, before finalising their performance statements. Where findings remain unresolved, these can be addressed by entities in the following year/s.
3.13 Audit findings are classified by the ANAO into five categories relating to the extent of risk posed and legal non-compliance. The nature of the audit findings will determine whether they also result in a qualification to the audit conclusion and guides how they should be addressed by the entity. The classification of audit findings will indicate the urgency of corrective actions, and the appropriate level of management or oversight involvement and whether they require escalation to the responsible minister. Ultimately, the classification of audit findings is designed to assist entities to implement responses that are proportionate, targeted, and effective in addressing the identified weaknesses and improve performance reporting.
Table 3.3: Audit findings ratings scale
|
Rating |
Description |
|
Category A (significant) |
Findings that pose a significant risk to the entity’s performance statements preparation; these include findings that could result in material misstatement of the entity’s performance statements. |
|
Category B (moderate) |
Findings that pose moderate risk to the entity’s performance statements preparation; these may include prior year findings that have not been satisfactorily addressed. |
|
Category C (minor) |
Findings that pose a low risk to the entity’s performance statements preparation; these may include findings that, if not addressed, could pose a moderate risk in the future. |
|
Category L1 |
Instances of significant potential or actual breaches of the Constitution, instances of significant non-compliance with the entity’s enabling legislation, legislation that the entity is responsible for administering, and the PGPA Act. |
|
Category L2 |
Instances of non-compliance with subordinate legislation, including the PGPA Rule. |
Source: ANAO reporting policy
Audit findings by category and entity type
3.14 Across the 21 audited entities in 2024–25:
- a total of 65 findings were reported to entities at the end of the final phase of the 2024–25 performance statements audits. These comprised 14 significant (category A), 16 moderate (category B) and 35 minor (category C) findings. By comparison, at the end of the 2023–24 audits, there were 23 significant (category A) findings, 23 moderate (B) and 20 minor (C) findings;
- of the 85 findings at the 2024–25 interim phase, 52 were resolved by the end of the final phase (60 per cent). By comparison, in 2023–24, 38 of the 72 findings at the interim phase (53 per cent) were resolved by the end of the final phase;
- repeat auditees resolved 24 of 66 findings from the prior year at the end of the 2024–25 interim phase (36 per cent) and 41 of 62 interim findings by the end of the final phase (66 per cent); and
- new auditees resolved 11 of 23 interim findings by the end of the 2024–25 audit cycle (48 per cent).
3.15 The 2024–25 audit results show a positive trend. The average number of findings per audited entity fell from 4.7 findings per auditee in 2023–24 to 3.1 findings per auditee in 2024–25.
3.16 The data suggests that entities that are new to the audit program are better prepared. At the end of the 2024–25 interim phase, only three of the 23 findings raised for new entities were significant (category A) findings (13 per cent). This is an improvement on the 2023–24 interim phase, where 33 per cent of findings issued to new entities were significant findings.
Significant and moderate findings by theme
3.17 The 14 significant and 16 moderate 2024–25 audit findings related to the following themes:
- Accuracy and reliability — entities could not provide sufficient and appropriate evidence that the reported information is reliable, accurate and free from bias.
- Usefulness — performance measures were not relevant, clear, reliable or aligned to the entity’s purposes or key activities.
- Preparation — entity preparation processes and practices for performance statements were not effective, including timeliness and record keeping.
- Completeness — performance statements did not present a full, balanced and accurate picture of the entity’s performance due to the omission of important information.
- Data — inadequate assurance over data extraction, reporting, and controls across the data lifecycle, from collection to reporting.
3.18 Table 3.4 shows that performance reporting in the sector continues to improve. In particular, the number of significant and moderate findings fell from 46 findings across 14 entities in 2023–24 to 30 findings across the 21 entities in 2024–25. In 2024–25, the ‘accuracy and reliability’ theme accounted for half of all significant and moderate findings. Ten of the 21 auditees received (at least) one significant or a moderate finding under this theme.
Table 3.4: Significant and moderate audit findings unresolved in 2024–25 by theme
|
|
Accuracy & reliability |
Usefulness |
Preparation |
Completeness |
Data |
|
Total 2024–25 (% of all A and B findings) |
15 (50%) |
3 (10%) |
3 (10%) |
5 (17%) |
4 (13%) |
|
Total 2023–24 (% of all A and B findings) |
11 (24%) |
9 (20%) |
8 (17%) |
11 (24%) |
7 (15%) |
Source: ANAO
Entity performance reporting maturity
3.19 To embed good practice in performance statements preparation, the ANAO has developed a maturity assessment model to assist entities to present statements that are meaningful for readers. This approach has been developed and tested with entities with positive feedback about its usefulness.
3.20 As in 2023–24, the ANAO assessed auditees’ performance reporting maturity against an assessment model comprising five categories (leadership and culture, governance, data and systems, capability, and reporting and records). Each category was assessed against five levels with ‘Establishing’ being the lowest level and ‘Advanced’ the highest, as shown in Figure 3.1.
Figure 3.1: Maturity assessment levels
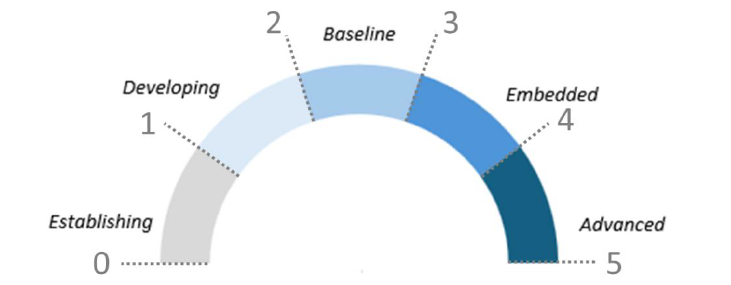
Source: ANAO
3.21 The ANAO’s maturity assessment model has been developed as an educative tool. While the maturity assessment is not part of the ANAO’s audit criteria, it indicates the capability of entities, and of the sector, to prepare performance statements that both comply with legislative requirements and report meaningful performance information.
3.22 Table 3.5 shows that across the 21 entities audited in 2024–25, the average maturity in each of the five categories increased from the previous year. Across the 21 entities, ‘Leadership and culture’ was the most mature of the five categories and ‘Data and systems’ was the least mature. The same observation was made of the 14 entities in 2023–24. The ANAO has observed that entities are strengthening their capability and accountability to drive better measurement and reporting.
Table 3.5: Assessment of entities’ performance reporting maturity (2023–24 to 2024–25)
|
|
Leadership and culture |
Governance |
Data and systems |
Capability |
Reporting and records |
|
2024–25 average |
3.5 |
3.2 |
2.7 |
3.3 |
3.1 |
|
2023–24 average |
3.3 |
3.1 |
2.6 |
3.0 |
2.8 |
Note: The 2024–25 averages reflect maturity ratings across all 21 entities audited in the 2024–25 program. Only 14 of these entities were audited in 2023–24, and are reflected in the 2023–24 averages.
Source: ANAO
3.23 Despite the positive improvement in aggregate maturity results, there is variability across entities. Figure 3.2 plots the range and the average of maturity scores for each category, reflecting the wide range of maturity across the 21 entities and all five categories.
Figure 3.2: Range of entities’ maturity scores, 2024–25
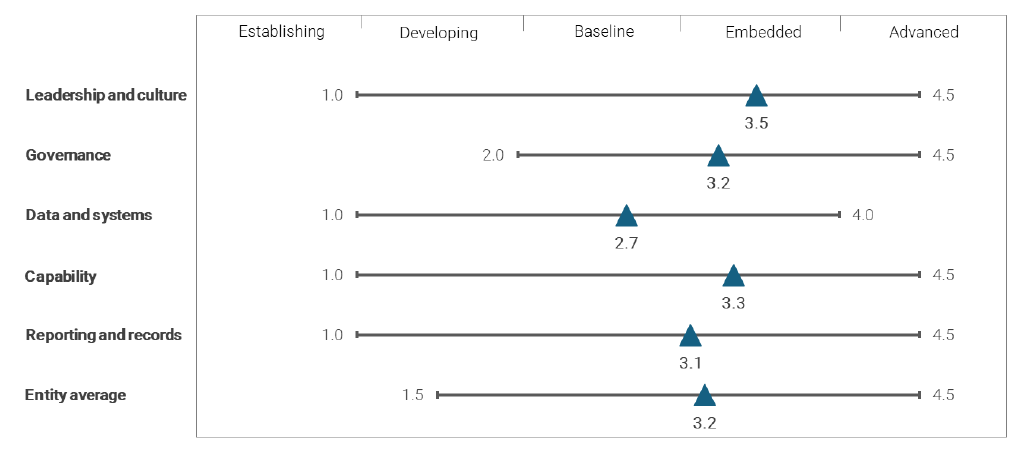
Source: ANAO
Performance maturity of new entities to the Program
3.24 Table 3.6 shows that three of the seven new entities in 2024–25 were assessed in the top third of the Program for maturity in the categories of ‘leadership and culture’ and ‘capability’. The Department of Defence and the Department of Climate Change, Energy, the Environment and Water were both within the top third for these categories. Senior leadership of these entities demonstrated that they value performance information and performance reporting, and have been consistently engaged in the performance reporting process. Entity performance reporting teams have sufficient skills and authority to fulfil their functions and effectively coordinate the efforts of the whole entity to prepare timely, high-quality performance reporting.
3.25 Table 3.6 also shows that most of the new entities were assessed in the bottom third of the Program in maturity for the categories of ‘data and systems’ and ‘records and reporting’. With the increasing use of emerging technologies, such as automation and artificial intelligence, there is a risk that without strong IT controls and data governance arrangements, errors, biases or data gaps can be amplified, leading to misleading performance information and poor policy outcomes. Entities subject to repeat audits demonstrate improved data governance and record-keeping practices.
Table 3.6: Maturity of new entities in 2024–25 compared with all entities in Program
|
Number of new entities ranked in: |
Leadership & culture |
Governance |
Data & systems |
Capability |
Reporting & records |
|
Top third of all entities |
3 |
2 |
1 |
3 |
1 |
|
Middle third of all entities |
1 |
3 |
2 |
2 |
1 |
|
Bottom third of all entities |
3 |
2 |
4 |
2 |
5 |
|
Total number of new entities |
7 |
7 |
7 |
7 |
7 |
Source: ANAO
Overall observations of entity maturity
3.26 Appendix 1 shows each entity’s overall maturity rating. The following section summarises the ANAO’s observations from the 2024–25 maturity ratings against each of the five categories.
Leadership and culture
3.27 Strategic and concerted leadership is required to embrace meaningful performance reporting as key to good management and the effective stewardship of public resources.63 Developing a culture that values and produces high quality performance information and evaluation to improve business operations, and not as a compliance exercise, takes time and perseverance.64 When entities don’t use performance information strategically, they tend to focus on actions and short-term deliverables instead of outcomes that demonstrate impact and public value.
3.28 Entities rated highly for ‘leadership and culture’ have an accountable authority and senior leaders who foster a strong performance culture and make performance monitoring, reporting, and evaluation integral to business operations. These leaders routinely monitor performance results and use these results to ensure accountability and inform decision-making. During the 2024–25 audits, seven entities improved their rating between the interim and final audit phases, and six entities improved their rating from the previous year.
Governance
3.29 Strong governance establishes clear roles and responsibilities for data collection, analysis, and reporting, supporting consistency and integrity throughout the performance reporting process. Internal controls and procedures are implemented for planning, monitoring, and reporting performance information, and for ensuring alignment between data used for internal management and external accountability purposes. This alignment minimises duplication and supports transparency, learning and continuous improvement, by connecting internal performance insights with external accountability requirements.
3.30 Entities that are assessed highly for ‘governance’ are those that have an established Enterprise Performance Framework and use it to effectively plan, monitor and report their performance and align their internal management and external accountability information. This demonstrates a shift from a compliance approach, where entities are simply focussed on complying with minimum reporting requirements or meeting the minimum standard to satisfy the auditor, to a focus on the value of performance information for improving operational performance and achieving better outcomes.
3.31 The 2024–25 performance statements audits indicate there is further improvement required in the governance of performance reporting. Not all audited entities could show a clear link between internal business plans and their corporate plan or alignment between the information used for day-to-day management and the performance information presented in annual performance statements. This suggests that some entities may not be reporting measures in their performance statements that represent the highest value metrics for running the business and measuring and assessing their performance.
3.32 Audit committees play an important independent role in strengthening performance monitoring and reporting and encouraging ongoing improvement in the quality of annual performance statements. By reviewing the adequacy of performance measures and the reliability of reported results, audit committees help ensure that the information presented in performance statements is both meaningful and credible. They can also assist to identify weaknesses in data management or record-keeping and recommend improvements that strengthen both performance reporting and audit readiness. Through ongoing analysis of annual performance statements, audit committees play a key role in nurturing a culture of performance, learning and continuous improvement.
Data and systems
3.33 Relevant, reliable, accurate and timely data is the foundation for performance reporting. Entities with higher maturity have clear documentation of data flows and have the skills and knowledge to use data effectively and interpret performance results accurately.
3.34 The Data and Digital Government Strategy envisions an Australian Public Service that provides simple, secure, and connected public services through world-class data and digital capabilities by 2030.65 To support this vision, the Department of Finance developed the Data Maturity Assessment Tool (the DMAT) to help agencies periodically measure and assess their data maturity and track their progress over time.66 The average data maturity score across the whole APS from the 2024 Data Maturity Assessment was 2.02 out of 5, suggesting that practice is ‘Developing’. A rating of developing indicates that:
agencies understand the importance of using and managing data effectively at the enterprise level, have some initiatives for increasing data capability, and have started using data to improve selected areas to advance operational efficiency, but that these improvements are still a work in progress.67
3.35 The results of the 2024–25 audits are consistent with the low level of self-assessed maturity under the 2024 data maturity assessment. The ANAO assessed three of the 21 entities as ‘Developing’ and a further eight entities as ‘Baseline’. Only one entity — the Department of the Treasury — achieved a rating of ‘Advanced’ for this category.68 Five entities improved their rating from the previous year.
3.36 Entities that were rated highly for ‘data and systems’ engaged the Chief Data Officer (or equivalent) in the development and reporting of performance measures, including how performance data is collected, managed and used across the entity. They also had procedures to gain assurance over measures relying on internal and third-party systems and data sources such as:
- access controls and user permissions — to help protect data integrity by ensuring that only authorised personnel can input, modify, or approve performance information;
- data validation and verification processes — essential to detect and correct errors; and
- version control mechanisms — ensure changes made to data are transparent and traceable.
Capability
3.37 Effective performance reporting depends on better measurement methods, skills, and implementation. Entities should treat performance reporting as a key management process and invest in their capability and capacity to design, interpret and report performance information. During the initial stages of the performance statements audit program, the ANAO observed that numerous entities did not sufficiently prioritise internal strategic performance reporting capability.
3.38 Entities that were rated highly for ‘capability’ had established a skilled and dedicated team to coordinate performance monitoring and reporting. These teams play a central role in developing methodologies, providing guidance and training, and supporting business areas to analyse, and report performance. Entities rated high in ‘capability’ often foster a culture of learning and continuous improvement and share expertise and best practices with others.
Reporting and records
3.39 Good record keeping is essential for performance reporting69 because it ensures that all data and evidence underpinning reported results is accurate, complete, and verifiable. Reliable records provide the foundation for compiling performance information, allowing entities to monitor progress, identify trends, and explain outcomes with confidence. Maintaining accurate and accessible records for performance reporting should be considered a core business function, enabling the accountable authority to have confidence in the results being reported to the Parliament, government and the public.70
3.40 Entities should not need to create new or special documentation solely to satisfy auditors’ evidentiary requirements. If an entity maintains good performance information records for sound business purposes that are in line with legal and policy requirements, these will usually be sufficient to satisfy auditors’ evidentiary requirements as auditors rely on evidence generated through normal business operations, not documentation created after the fact, for audit purposes. If records are incomplete, inconsistent, or poorly governed, auditors may still need additional evidence.
3.41 Entities that were rated highly for ‘reporting and records’ produced performance statements in 2024–25 with genuine insight into how outcomes were achieved and the value delivered to the public. They used analysis and narrative to explain results, trends, and influencing factors. These entities also maintained records that properly record and explain all reported results and facts. New audited entities in 2024–25 generally had low maturity in this category.
3.42 The 2024–25 performance audits identified ongoing deficiencies in record-keeping practices, although notable improvements are evident when compared to 2023–24. Entities subject to repeat audits showed clear improvement, particularly when a capable central performance reporting team with appropriate authority is in place to oversee the entity’s performance reporting framework. Good practices were observed in several of the entities subject to audit for the first time in 2024–25, such as the Department of Climate Change, Energy, the Environment and Water, the Department of Finance, and the Department of Parliamentary Services.
3.43 Good record keeping also supports efficient auditing, as it reduces the time spent by the entity and auditors searching for evidence, shortening the audit duration and lowering audit costs. The case study below shows how good recording keeping can improve audit efficiency.
|
Case study Audit costs and entity maturity |
|
The financial cost of an audit is a useful indicator of the level of effort and time required to conduct the audit. This cost is reduced where entities have appropriate, accessible records. In 2022–23, the cost to the ANAO of conducting the performance statements audit of the Department of the Treasury for the second time was $268,670. The entity’s score on ‘reporting’ was 3, or ‘Maturing’. In 2024–25, the cost to the ANAO of conducting the Department of Treasury audit was $126,240 and the entity improved its ‘reporting and records’ maturity score to 4.5, ‘Advanced’. The significant lift in the entity’s maturity — achieved by implementing robust mid-cycle reporting processes, providing reliable documentation and robust internal audit processes — enabled early issue identification and resolution and facilitated a faster audit with more effective management of risk and less rework to address issues, even in the context of five additional measures in Treasury’s 2024–25 performance statements due to machinery of government changes. |
3.44 As the public sector increasingly turns to artificial intelligence to inform policy, automate services and shape public sector advice for decision-makers, robust record-keeping will become more important for integrity, accountability, and credibility of performance reporting. When algorithms or automated systems are involved, there is a risk of ’black box‘ decision-making, where it becomes difficult to track how results are produced. Maintaining thorough records provides a clear and reviewable evidence trail, including of the quality and independence of training data, enabling entities to explain and support their reported results. This traceability is important for auditors and helps entities retain institutional knowledge and strengthen transparency, accountability and governance, which are fundamental for maintaining public trust in government entities.
Opportunity for improvement — audit evidence
3.45 During the initial years of the performance statements audit program, entities indicated that they were preparing evidence specifically to satisfy the ANAO’s audit requirements.
3.46 Entities should not need to produce entirely new or special evidence solely to satisfy auditors. Performance statements should be based largely on information the entity already holds and uses for its own management, accountability and decision-making purposes.71 The purpose of an audit is not to create new reporting requirements, but to independently evaluate how well the entity’s existing systems, data, and processes demonstrate performance and accountability.
3.47 If the entity’s current information is incomplete, unreliable, or poorly documented, however, the auditee may need to provide additional clarification, documentation, or analysis to meet audit standards. Rather than generating new data purely for the audit, this is to ensure that existing evidence is credible, traceable, and capable of supporting performance claims. In many cases, an audit highlights weaknesses in information systems or performance measurement processes — showing that management may not be using strong enough evidence to monitor its own results effectively.
3.48 As entity performance reporting maturity improves and changes to performance measures become less frequent, entities should be in a position to present the majority of audit evidence at the beginning of the audit process, improving audit efficiency.
Future focus of performance statements auditing
3.49 Independent assurance provided through the ANAO’s audits builds trust and credibility in the performance information reported by entities. It should not be viewed as a compliance burden, but as a tool to improve the quality and usefulness of performance statements, and thereby support better performance management.
3.50 With the benefit of lessons from the wider program of 21 audits in 2024–25, the ANAO is well placed to continue to enhance its audit approach to ensure that performance statements audits are most effective — and that the areas of audit focus and effort reflect the areas of highest audit risk. Going forward, the ANAO will continue to sharpen its consideration of risk factors such as:
- the performance reporting maturity of the entity;
- past audit results;
- implementation of measures to address audit findings;
- changes in key personnel involved in the performance reporting process;
- changes in the entity’s operations or environment, for example Machinery of Government changes or new laws/programs;
- the entity’s compliance and control culture; and
- external factors such as parliamentary reviews.
3.51 Consistent with the approach taken in developing the Performance Reporting Maturity Assessment Model, the ANAO will consult with the Performance Statements Expert Advisory Panel72 and the sector as the audit approach is refined. The aim is to enhance accountability, efficiency, and audit value.
3.52 The 2024–25 audits continued the trend of lowering audit costs for repeat auditees. Refinement of the risk methodology should further reduce audit costs in 2025–26.
Opportunity for improvement — sharing insights
3.53 In addition to enhancing its risk-based approach to auditing performance statements to support improved efficiency for the ANAO and audited entities, the ANAO will continue to support improved performance reporting capability and quality by:
- sharing information on better practices, highlighting examples of effective entity performance frameworks and good data practices; and
- setting clear audit expectations, sharing insights on systemic issues affecting performance reporting and working with the Department of Finance to enhance entity understanding of the Commonwealth Performance Framework, including to inform guidance and legislative reform where appropriate.
Appendices
Appendix 1 Entity snapshots
The following key provides an explanation of the items summarised in Appendix 1. Also identified sources, where appropriate.
Key to entity snapshots
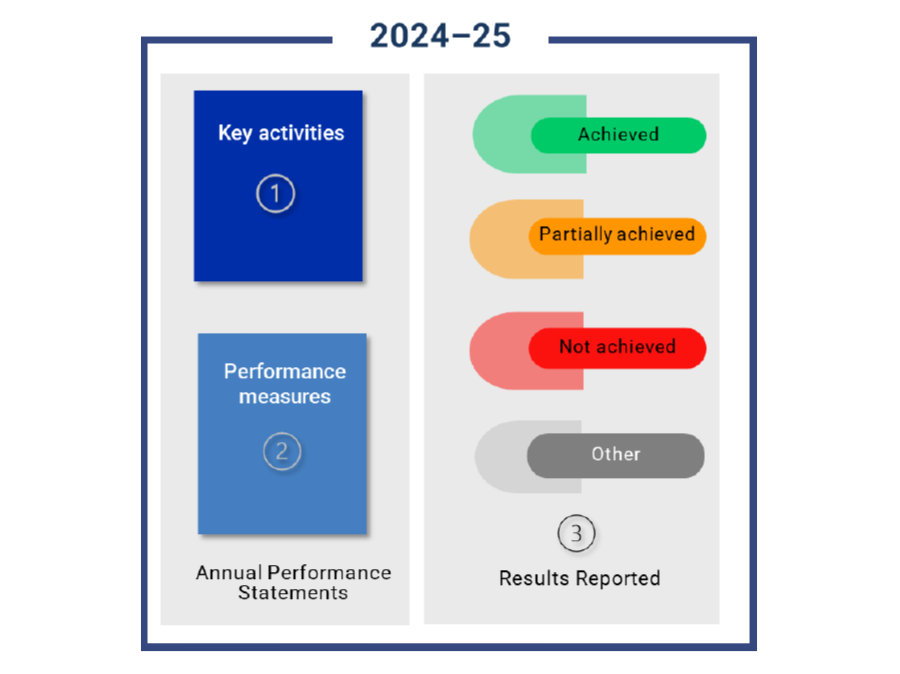
- Key activities: each activity makes a contribution towards achieving the impact implied by an entity’s purposes.
- Performance measures, how the entity’s performance is assessed: each activity may be measured using measures of different types (e.g. output, efficiency and effectiveness).
- Results reported, level of reported achievement against targets associated with specific measures: as published in entity’s 2024–25 annual performance statements.
- Met — where a reported result met the target.
- Partially met — where a reported result lies between achievement of target and non-achievement.
Entities refer to this category by various terms, including ‘mostly’, ‘substantially’ or ‘partially’ met. Some entities may define multiple thresholds, such as ‘substantially’ and ‘partially’ achieved; these have been collapsed into one category for analysis purposes by the ANAO. See footnote 9 of this report. - Not met — where reported result is below the threshold for partial achievement (or below target if no threshold is defined).
- Other — where an entity characterises achievement as something other than met, partially met or not met.
Includes where there are no targets identified against a measure, where data is not available to report or a baseline is being established (for future comparison).
Assessments of met, partially met, and not met represent only one dimension of an entity’s overall performance and are intended to serve as a starting point for deeper analysis and discussion.
Attorney-General’s Department (AGD)

AGD’s purpose is ‘to achieve a just and secure society through the maintenance and improvement of Australia’s law, justice, security and integrity frameworks’.


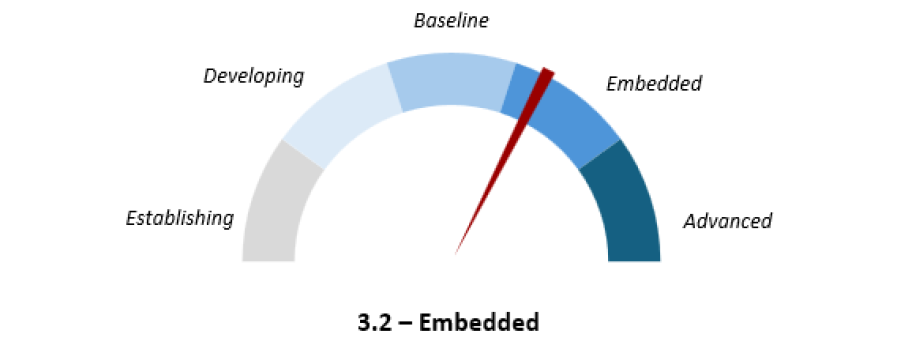
AGD’s overall maturity was assessed as Embedded. The department received ratings of ‘Embedded’ against all five maturity categories.
AGD invested in developing performance measures which complied with the PGPA rule in prior years, however there is an opportunity for AGD to uplift the quality of performance measures to more fulsomely tell its performance story. There is an opportunity to improve the department’s performance reporting culture through: alignment of internal to external reporting; selecting measures and targets that support decision making; and using the results to promote transparency and accountability.

AGD 2024–25 closing position
|
A (significant) findings |
B (moderate) findings |
C (minor) findings |
|
0 |
0 |
3 |
Source: ANAO
2024–25 closing position contains three C findings relating to:
- the effectiveness and meaningfulness of its performance reporting. The ANAO noted that more than half of AGD’s Divisions lack a business plan that is aligned to the Corporate Plan;
- the lack of documented controls with AGD’s Identity Verification System, which features in performance measures 4.7.2 and 4.7.3; and
- the lack of a documented approach to explain ongoing reliance on proxy efficiency measures.

|
Measure |
Target |
Result |
|
1.1 Australian Government Solicitor legal services |
1.1.1 Overall client satisfaction (via AGS feedback process) 75% or greater |
◆ |
|
1.2 International Law and Policy Advice |
1.2.1 Average performance rating from stakeholders of 78 index points or above out of 100 for: (i) effectiveness (ii) timeliness and responsiveness |
▲ |
|
1.3 Constitutional policy and related public law advice |
1.3.1 Average performance rating from stakeholders of 78 index points or above out of 100 for: (i) effectiveness (ii) timeliness and responsiveness |
■ |
|
1.4 Operation of Australian Government Solicitor |
1.4.1 AGS Net Production (lawyer utilisation) meets or exceeds the annual budget target |
◆ |
|
1.5 Manage significant legal issues and arrangements for Australian Government legal services |
1.5.1 Average performance rating from stakeholders of 78 index points or above out of 100 for effectiveness of initiatives to support compliance with obligations under the Legal Services Directions 2017 |
■ |
|
1.5.2 Satisfaction of government lawyers with initiatives provided by the Australian Government Legal Service (AGLS) greater than 80% |
■ |
|
|
2.1 International crime cooperation, federal offender, international family law and private international law casework |
2.1.1 Average performance rating from stakeholders of 78 index points or above out of 100 for: (i) effectiveness (ii) timeliness and responsiveness |
▲ |
|
2.1.2 A minimum of casework matters finalised: (i) 1,340 extraction, mutual assistance, international transfer of prisoners, federal offender, international family law (ii) 5 high risk terrorist offenders (iii) 400 private international law |
◆ |
|
|
2.1.3 At least 80% of extradition legal proceedings heard and determined are resolved in favour of the Commonwealth |
◆ |
|
|
3.1 Administration and advice of legal and policy frameworks |
3.1.1 Average performance rating from stakeholders of 78 index points or above out of 100 for: (i) effectiveness (ii) timeliness and responsiveness |
▲ |
|
3.1.2 100% of assessed policy advice to the Minister is rated as effective |
◆ |
|
|
4.1 Legal assistance |
4.1.1 Average performance rating from stakeholders of 78 index points or above out of 100 for: (i) effectiveness (ii) timeliness and responsiveness |
■ |
|
4.1.2 Provision of funding to support greater access to the justice system: (i) 80% of payments to states and territories and legal assistance providers are made within agreed timeframes, subject to third parties meeting relevant reporting obligations and requirements and the scheduling of third-party payment processes (ii) 80% of payments for legal financial assistance scheme grants are made within agreed timeframes, subject to third parties meeting relevant obligations and requirements |
◆ |
|
|
4.2 Family relationships services program |
4.2.1 100% of Family Law Service grant recipients provide services in line with their approved grant activities |
◆ |
|
4.3 Building counter-fraud capability across government |
4.3.1 Average performance rating from stakeholders of 78 index points or above out of 100 for: (i) effectiveness (ii) timeliness and responsiveness |
◆ |
|
4.4 Administration of the Foreign Influence Transparency Scheme, Lobbying Code of Conduct and Online Register for Modern Slavery Statements |
4.4.1 The Foreign Influence Transparency Scheme Public Register is up to date, indicated by greater than 85% of registrations and updates being published within 4 weeks |
◆ |
|
4.4.2 The Australian Government Register of Lobbyists is up to date, indicated by greater than 85% of registrations and updates being published within 5 working days |
◆ |
|
|
4.4.3 The Modern Slavery Statements Register is up to date, indicated by greater than 80% of publishable submissions being published within 60 working days |
◆ |
|
|
4.5 International law and justice programs |
4.5.1 Average performance rating from stakeholders of 78 index points or above out of 100 for: (i) effectiveness (ii) timeliness and responsiveness |
◆ |
|
4.6 Crime prevention assistance |
4.6.1 Average performance rating from stakeholders of 78 index points or above out of 100 for: (i) effectiveness (ii) timeliness and responsiveness |
■ |
|
4.7 Administration of the Document Verification Service and Face Verification Service |
4.7.1 Average performance rating from stakeholders of 78 index points or above out of 100 for: (i) effectiveness (ii) timeliness and responsiveness |
■ |
|
4.7.2 The average time to verify documents through the Document Verification Service and Face Verification Service, where a result is returned, is less than 3 seconds |
■ |
|
|
4.7.3 The Document Verification Service and Face Verification Service maintain an availability of 99% or above |
◆ |
|
Key: ◆ Achieved ▲ Partially achieved ■ Not achieved ● Other
Source: ANAO analysis of AGD’s annual performance statements (available from https://www.ag.gov.au/about-us/publications/attorney-generals-department-annual-report-2024-25).
Australian Taxation Office (ATO)
ATO’s purposes are to:
- collect tax so that government can deliver services for the Australian community (ATO);
- support public trust and confidence in the integrity of the tax profession and the tax system and ensure tax practitioner services are provided to the public in accordance with appropriate standards of professional and ethical conduct (Tax Practitioners Board); and
- promote public trust and confidence in Australian charities (Australian Charities and Not-for-profits Commission).

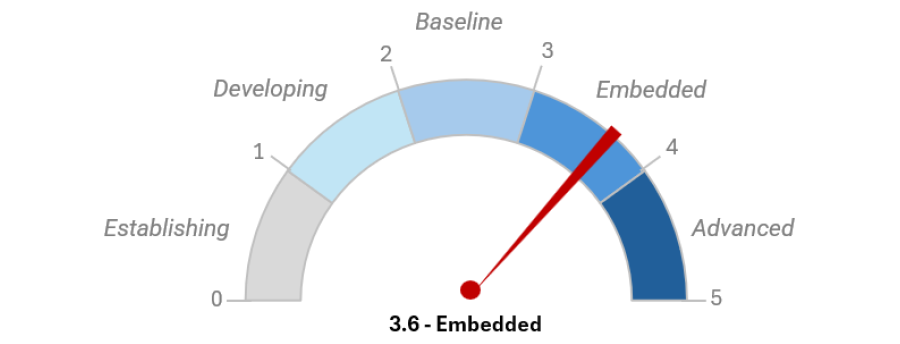
ATO’s overall maturity was rated as Embedded. The ATO’s leadership and culture, and governance, were rated ‘Advanced’. Data and systems, capability, and reporting and records were rated as ‘Embedded’.
The ANAO observed increased senior leadership involvement and clear responsibility in performance reporting. While the rating under the data and systems category improved, the lack of full integration and a reliance on manual processes limit efficiency and consistency. In relation to reporting and records, the ANAO noted that further improvements are needed to ensure reporting is consistently clear and meaningful.
ATO 2024–25 closing position
|
A (significant) findings |
B (moderate) findings |
C (minor) findings |
|
1 |
1 |
3 |
Source: ANAO
ATO’s 2024–25 closing position contains:
- an A finding on data integrity and for the design of its Registration performance measures, where the ANAO found weaknesses in tax file number governance.
- a B finding (downgraded from an A finding in 2023–24) relating to its assurance over external reporting. For the entity’s Payment measure, the ANAO highlighted the extraction of data and the need for better implementation and documenting; and
- three C findings relating to:
- shortcomings in the process to prepare performance statements;
- measure targets that do not enable effective performance reporting; and
- meaningful information and the ATO’s use of a measure that provides limited information about the ATO’s delivery of its purpose.
|
Measure |
Target |
Result |
|
Registration — Proportion of companies registered in the systema |
The ATO aims to ensure that all entities that are required to participate in the tax and superannuation systems are registered on the ATO’s client register, allowing a tolerance of 2% from the last reporting period (increase or decrease) |
◆ |
|
Registration — Proportion of individuals registered in the systema |
The ATO aims to ensure that all entities that are required to participate in the tax and superannuation systems are registered on the ATO’s client register, allowing a tolerance of 5% from the last reporting period (increase or decrease) |
◆ |
|
Lodgment — Proportion of activity statements and income tax returns lodged on time |
78% |
▲ |
|
83% |
▲ |
|
|
Tax gap – As a proportion of revenue |
7.4% |
■ |
|
Total revenue effects — Revenue from all compliance activities |
$16.0b |
◆ |
|
Payment — Proportion of liabilities paid on time by value |
88.0% |
◆ |
|
Debt — Ratio of collectable debt to net tax collections |
Between 6.5% and 7.0% |
■ |
|
Cost of collection — Cost to collect $100 |
+/- 5c from previous year |
◆ |
|
Compliance cost — Adjusted median cost to individual taxpayers of managing their tax affairs |
A decrease, or no more than 2% increase over the prior year figure |
◆ |
|
Service satisfaction — Client satisfaction with their recent interaction with the ATO |
80% |
■ |
|
Tax practitioner satisfaction |
71% |
▲ |
|
Proportion of completed risk assessments |
90% of matters are risk assessed |
◆ |
|
Sanctions are appropriate |
The TPB is committed to pursuing positive Court and Tribunal outcomes. |
▲ |
|
Increased use of the ABR as the national business dataset |
Government agencies – 550 |
◆ |
|
Community – 2.5b ABN Lookups |
◆ |
|
|
Percentage of new eligible charities registered within 15 business days of ACNC receiving all information necessary to make a decision |
90% |
▲ |
|
Percentage of time that the Charity Register is available (excluding scheduled maintenance) |
95% |
◆ |
|
Refundable film and digital games tax offset claims are subject to ATO risk detection processes |
Refundable film and digital games tax offset claims are subject to risk detection processes |
◆ |
|
All applications received are processed and taxpayers notified of their exploration credit allocation within 28 calendar days of the application period closing |
All applicants notified within 28 calendar days of the application period closing |
◆ |
|
Public reporting data uploaded on data.gov.au (and linked to ato.gov.au) after determination letters are issued |
Published within 56 calendar days of the application period closing |
◆ |
|
Fuel Tax Credits Scheme gap |
4% |
◆ |
|
Information on how to claim the NRAS offset is accurate and accessible |
Information on how to claim the NRAS offset is accurate and accessible |
◆ |
|
Product Stewardship for Oil gap |
1% |
▲ |
|
Research and Development Tax Incentives (RDTI) refundable claims are subject to RDTI-specific risk detection processes |
R&DTI refundable claims are subject to risk detection processes |
◆ |
|
Research and Development Tax Incentives (R&DTI) offset claims are amended when the Department of Industry, Science and Resources advises the ATO that R&DTI registration has been revoked |
100% |
■ |
|
Proportion of original contributions paid within 60 days |
97% |
◆ |
|
Private health insurance rebates are subject to risk preventative and corrective processes |
Private health insurance rebates are subject to risk preventative and corrective processes |
◆ |
|
Proportion of original co-contributions paid within 60 days |
97% |
◆ |
|
Superannuation guarantee gap as a proportion of superannuation guarantee contributions |
Reduce the gap to a level as low as practicable given the nature and complexity of the law and the resources available. |
▲ |
|
Value of superannuation guarantee charge raised (including penalties and interest) |
$1,099m |
◆ |
|
Value of superannuation guarantee charge collected |
$642m |
◆ |
|
Value of superannuation guarantee charge entitlements distributed to individuals or superannuation funds |
$578m |
◆ |
|
Value of superannuation guarantee charge debt on hand and the value of debt irrecoverable at law or uneconomical to pursue |
$4,000m |
◆ |
|
$183m |
■ |
|
|
Value of interest payments processed (unclaimed superannuation money) |
Not reasonably practicable |
● |
|
The ATO applies interest on overpayments and early payments of tax when required |
The ATO applies interest on overpayment and early payments of tax when required |
◆ |
|
Ratio of debt uneconomical to pursue to net tax collections |
Below 1% |
◆ |
|
Accurate information is made available to taxpayers eligible to claim the seafarer tax offset |
Accurate information is made available to taxpayers eligible to claim the seafarer tax offset |
◆ |
|
Under development |
Under development |
● (No reporting) |
|
Under development |
Under development |
● (No reporting) |
Key: ◆ Achieved ▲ Partially achieved ■ Not achieved ● Other
Note a: These measures were the basis for a qualified audit conclusion.
Source: ANAO analysis of ATO’s annual performance statements (available from https://www.ato.gov.au/about-ato/commitments-and-reporting/annual-report-and-other-reporting-to-parliament/annual-report)
Department of Agriculture, Fisheries and Forestry (DAFF)
DAFF’s purpose is ‘Working together to safeguard and grow sustainable agriculture, fisheries and forestry for all Australians.’
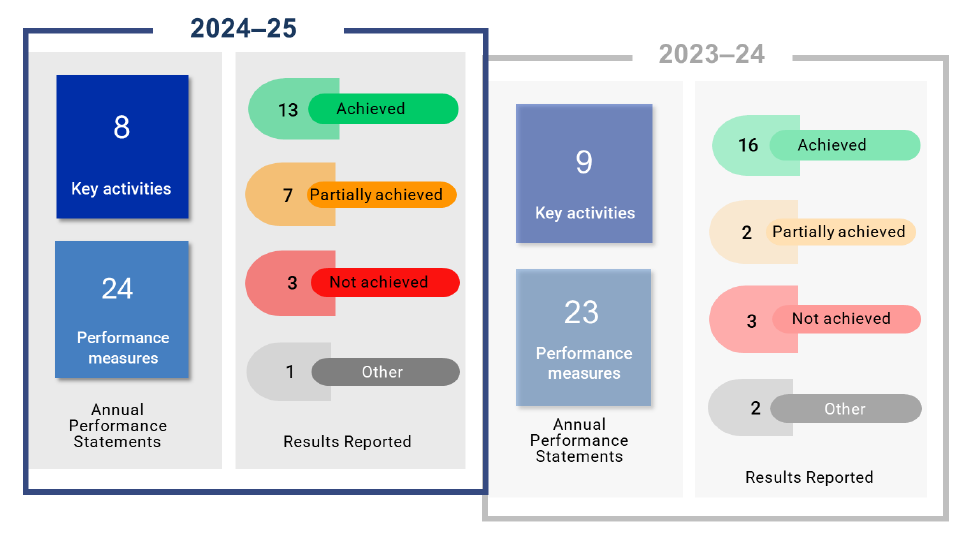
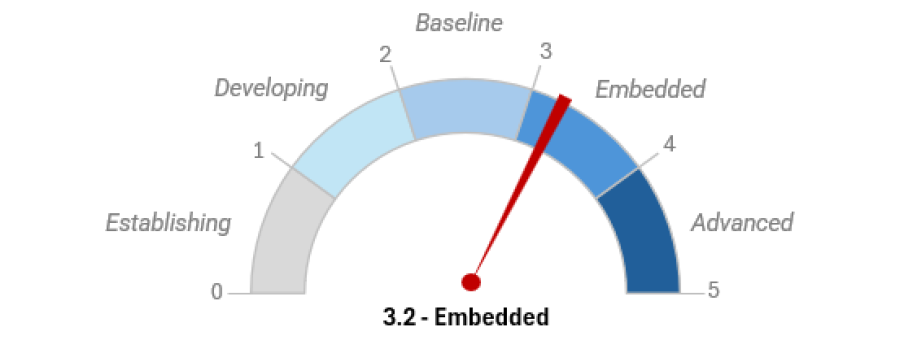
DAFF’s overall maturity was rated as Embedded. Leadership and culture, governance, data and systems and capability were rated as ‘Embedded.’ Reporting and records were rated as ‘Baseline.’
The ANAO noted improvements in the department’s reporting from the prior year. In the data and systems category, the ANAO identified room for improvement in DAFF’s documentation of performance measures and their assurance processes. Capability could improve with a more consistent assessment of performance measures against PGPA requirements.
DAFF 2024–25 closing position
|
A (significant) findings |
B (moderate) findings |
C (minor) findings |
|
0 |
1 |
1 |
Source: ANAO
DAFF’s 2024–25 closing position contains:
- a B finding relating to the appropriateness of its performance measures, with 38 per cent of the measures assessed as not sufficiently complying with PGPA requirements; and
- a C finding relating to record keeping and quality assurance processes.
|
Measure |
Target |
Result |
|
SG-01 Greater growth in average agricultural productivity (adjusted for climate and weather effects) for the past 10 years, compared with average annual market sector productivity growth over the same period |
Greater than or equal to 0% difference over the past 10 years |
◆ |
|
SG-02 Equal or reduced cost of levies administration compared with levies disbursed |
Levies administration cost is less than or equal to 1.2% of levies disbursed |
◆ |
|
SG-03 Proportion of farm businesses making new capital investments |
Increase in percentage of farm businesses making new capital investments compared to previous year (based on a 5-year moving average) |
■ |
|
SG-08 Encourage forestry industry investment in innovation |
Deliver 30% of total committed grant funding for active grants at the end of the financial year. |
■ |
|
SG-04 Grow access to a diverse range of international markets for Australian exporters of agricultural, fisheries and forestry products |
Each year, the department can qualitatively describe the impact of technical market access achievements and how these achievements grow access for Australian agricultural, fishery and forestry (AFF) producers. Achievements may include opening, improving, maintaining or restoring access. Examples need to be provided to demonstrate that different markets and commodities have had their technical access progressed. |
◆ |
|
SG-05 Significant representation of Australian interests on multilateral standard-setting bodies |
At least one meeting, with in-person attendance, to each of the multilateral trade standard-setting bodies (WTO, OECD, WOAH, IPPC, and Codex) |
◆ |
|
SG-06 Effective delivery of regulatory responsibilities for relevant export applications under the Export Control Act 2020. |
Establish a baseline. |
● (baseline established) |
|
SG-07 Increase in the number of electronic certificates issued for export |
Plus 2% of what the final 2023–24 eCert number is |
◆ |
|
RS-02 Sustainable farming practices are funded through the Climate-Smart Agriculture Program |
Deliver 100% of 2024–25 funding profile according to agreed milestones for Climate-Smart Agriculture Program. |
▲ |
|
RS-03 Increased investment in activities to build economic, social and environmental resilience to drought |
$52 million |
▲ |
|
RS-04 The proportion of Australian Government managed fish stocks that are sustainable |
The proportion of fish stocks assessed as ‘not subject to overfishing’ is maintained or increases year-on-year |
◆ |
|
RS-01 Increased pathways to support the understanding and adoption of emissions reduction opportunities, technologies and practices |
|
▲ |
|
BI-01 Proportion of biosecurity risk analyses completed within regulatory and target timeframes. |
Risk analyses are completed within regulatory and target timeframes. |
◆ |
|
BI-02 The import permit service standard is met. |
50% or more of Category 1 (standard goods) permit applications are processed and finalised within 20 business days. 50% or more of Category 2–5 (non-standard goods) permit applications are processed and finalised within 40 business days. |
◆ |
|
BI-03 Increased pre-border biosecurity assurance arrangements to manage biosecurity risks in countries exporting to Australia |
Government-to-government and/or government-to-industry arrangements are in at least 22.5% of countries in the world. |
▲ |
|
BI-04 Targeted public communication and engagement activities. |
Conduct at least 2 targeted biosecurity awareness campaigns per financial year. |
◆ |
|
BI-07 Number of consignments of imported goods with khapra beetle detections is reduced as a result of biosecurity measures implemented by the department. |
Reduction in the number of consignments of imported goods where khapra beetle is detected compared to the 2020–21 baseline. |
◆ |
|
BI-06 Reduction in risk of significant disease threats because of biosecurity measures implemented by the department |
50% or greater. |
▲ |
|
BI-08 Reduced levels of non-compliance with biosecurity regulations that apply to high-value cargo |
Reduction in high-value cargo non-compliance rate. |
◆ |
|
BI-09 Rates of non-compliance with regulations that apply to international travellers |
Post-intervention non-compliance rate for international travellers that is equal to or lower than the previous year. |
▲ |
|
BI-10 Rates of non-compliance with regulations that apply to approved arrangements. |
Reduction in non-compliance rate for approved arrangements |
■ |
|
BI-11 Biosecurity service standards conducted at the border are met |
Service standards are partially achieved. |
▲ |
|
BI-05 Strengthened emergency management capabilities. |
An overall maturity increase of at least 15% from the 2023–24 baseline. |
◆ |
|
BI-12 Investigate and respond to incidents of high-risk non-compliance through compliance and enforcement measures. |
100% of instances of high-risk non-compliance identified against the Biosecurity Act 2015, Export Control Act 2020 and other relevant portfolio legislation are subject to compliance and enforcement measures. |
◆ |
Key: ◆ Achieved ▲ Partially achieved ■ Not achieved ● Other
Source: ANAO analysis of DAFF’s annual performance statements (available from https://www.agriculture.gov.au/about/reporting/annual-report).
Department of Climate Change, Energy, the Environment and Water (DCCEEW)
DCCEEW’s purposes are to ‘drive Australian climate action; transform Australia’s energy system to support net zero emissions while maintaining its affordability, security and reliability; conserve, protect, and sustainably manage our environment and water resources through a nature positive approach; protect our cultural heritage; and contribute to international progress on these issues.’
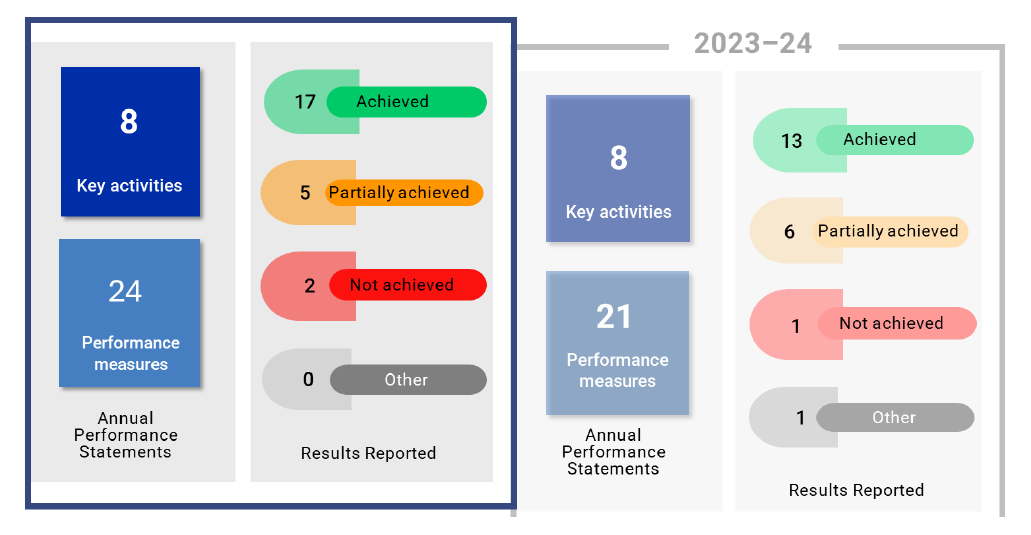

DCCEEW’s overall maturity was assessed as Embedded. Leadership and culture, governance, data and systems, and reporting and records were rated as ‘Embedded’. Capability was rated as ‘Advanced.’
The ANAO advised that governance could be improved by aligning the performance framework with business planning and budgetary processes. Additionally, further development of measure meaningfulness and completeness would enhance performance reporting
DCCEEW 2024–25 closing position
|
A (significant) findings |
B (moderate) findings |
C (minor) findings |
|
0 |
0 |
1 |
Source: ANAO
DCCEEW’s 2024–25 closing position contains a C finding relating to the meaningfulness of its performance measures. The ANAO identified opportunities for DCCEEW to report on the outcomes or delivery of a number of its key programs, and to communicate whether or not the programs’ objectives are being achieved.
|
Measure |
Target |
Result |
|
CCE01 Australia’s emissions and projected emissions are on track to meet legislated commitments |
National Inventory shows net emissions at least 21% below 2005 levels in the inventory year 2023. The latest emissions projections indicate that progress is being made to close any gap between the projected emissions and the legislated 2030 targets |
◆ |
|
CCE02 Share of renewables in Australia’s electricity mix |
Renewable electricity rising towards 82% nationally by 2030 |
◆ |
|
CCE03 The Safeguard Mechanism is on track to achieve its legislated net emissions targets |
137 Mt CO2-e in 2023-24 |
◆ |
|
CCE04 Expand the amount of renewable energy and dispatchable capacity targeted for underwriting by the Commonwealth Capacity Investment Scheme |
16 GW |
◆ |
|
CCE05 Proportion of Greenhouse and Energy Minimum Standards (GEMS) registration applications processed by the GEMS Regulator within 14 days from the time of application |
99% |
◆ |
|
CCE06 Investment leveraged through portfolio low emissions technology initiatives |
Leverage at least $2 of new investment for each $1 of Commonwealth funding |
▲ |
|
CCE07 Maintain Australia’s security of supply of quality liquid fuels |
Average days of stocks of petrol, diesel and jet fuel that meet the Australian fuel quality standards are not lower than the 2018 and 2019 average |
▲ |
|
CCE08 Australia has a plan to adapt to nationally significant climate risks |
Second stage of National Climate Risk Assessment and National Adaptation Plan completed |
▲ |
|
EN01 Stability or improvement in the: • national average of Habitat Condition Assessment System (HCAS) Scores • national average of National Connectivity Index scores (NCI) |
Maintained or improved trajectory, compared to the baseline, for the HCAS and NCI scores |
■ |
|
EN02 National average of the Threatened Species Main Index |
Maintained or improved trajectory |
◆ |
|
EN03 Percentage of Environment Protection and Biodiversity Conservation Act 1999 referral and approval decisions that meet statutory timeframes |
100% (noting tolerance of >85% equals mostly achieved) |
▲ |
|
EN04 Number of Environment Protection and Biodiversity Conservation Act 1999 approved projects that were subject to active compliance monitoring |
150 EPBC Approvals will be subject to compliance monitoring, through assessment of Annual Compliance Reports. |
■ |
|
EN05 Percentage of Australia’s land that is protected or conserved |
24% |
◆ |
|
EN06 An improvement in the proportion of National and Commonwealth Heritage assessments undertaken and completed against legislated timeframes |
75% of National and Commonwealth Heritage assessments, for nominations received after 1 July 2021, are on track, or completed within legislated timeframes |
◆ |
|
EN07 National standards to manage environmental impacts of industrial chemicals |
National standards are made and/or consolidated for a further 1,000 industrial chemicals each year (including the 12 chemical groups that Australia has previously ratified under the Stockholm Convention) |
◆ |
|
EN08 National resource recovery rate |
62% |
◆ |
|
AN01 Deliver priority Antarctic science that advances Australia’s interests |
Publish 75 peer-reviewed journal articles |
◆ |
|
AN02 Improve our understanding of Antarctica and the Southern Ocean through mapping and charting |
Improve the coverage and/or resolution and/or data domains across various maps and charts in Antarctica and the Southern Ocean |
◆ |
|
AN03 Conduct an annual deep-field activity to support Australia’s national Antarctic interest |
Conduct an annual deep-field activity to support the Australian Antarctic Program |
◆ |
|
WA01 Implement national policy and programs to improve water security and management |
National policies and programs implemented by the Commonwealth, states and territories have improved water security and management, demonstrated by statistical improvement on internationally recognised water-related targets |
◆ |
|
WA02 Increase in the volume of water recovered to enhance environmental outcomes in the Murray–Darling Basin to meet the 450 GL of additional environmental water target |
100 GL |
◆ |
|
WA03 The Water Efficiency Labelling and Standards (WELS) scheme is improved through stakeholder consultation |
Stakeholders are consulted on all significant matters that impact them |
◆ |
|
WA04 Commonwealth environmental water is managed effectively to protect and restore environmental assets |
Commonwealth environmental water is managed so that less than 5% of available volume of surface water is forfeited |
◆ |
|
WA05 Increase opportunities for First Nations people water ownership and participation in decision making |
Purchase and transfer water entitlements through the Aboriginal Water Entitlements Program (AWEP) to First Nations people in the Murray–Darling Basin. Establish baseline to measure First Nations ability to hold water and current water holdings |
▲ |
Key: ◆ Achieved ▲ Partially achieved ■ Not achieved ● Other
Source: ANAO analysis of DCCEEW’s annual performance statements (available from https://www.dcceew.gov.au/about/reporting/annual-report).
Department of Defence (Defence)
Defence’s mission and purpose is ‘to defend Australia and its national interests in order to advance Australia’s security and prosperity.’

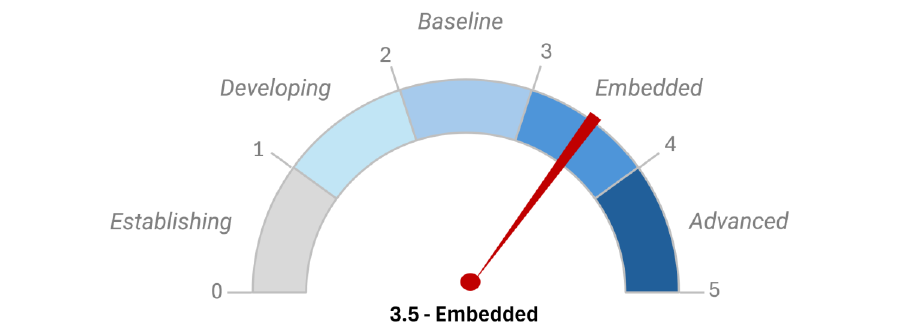
Defence’s overall maturity in 2024–25 was rated as Embedded. Leadership and culture and capability were assessed as ‘Advanced.’ Governance was ‘Embedded,’ while data and systems and reporting and records were ‘Baseline.’
The ANAO found that an addendum to the Enterprise Performance Framework provided a comprehensive approach to managing data. Nevertheless, the ANAO noted that a number of the department’s performance measures rely on manual data processes, with a limited quality assurance mechanism.
Defence 2024–25 closing position
|
A (significant) findings |
B (moderate) findings |
C (minor) findings |
|
1 |
2 |
1 |
Source: ANAO
Defence’s 2024–25 closing position contains:
- an A finding in relation to PM6.1, which measures Defence’s ability to deliver future capability with the Integrated Investment Program. The ANAO recommended reviewing the methodology and data sources, and implementing robust quality assurance of the calculations supporting the measure;
- two B findings, one relating to the effectiveness of quality assurance processes, and the other concerning data collection and record-keeping; and
- a C finding relating to the need for improvement in performance statements preparation processes.
|
Measure |
Target |
Result |
|
1.1 Defence maintains ready forces, plans and conducts operations, activities and investments as directed by Government to achieve Defence’s strategic objectives |
1.1a Defence responds to Australian Government requirements and conducts operations as directed. This will change year on year |
◆ |
|
1.2 Defence commits ADF and/or APS assistance to domestic crisis and emergency response, as directed by Government |
1.2a Defence responds to Australian Government direction as required. This will change year on year |
◆ |
|
2.1 The National Defence Strategy is operationalised and monitored through alignment with enterprise planning |
2.1a Proportion of enterprise planning activities that are aligned to the 2024 National Defence Strategy |
◆ |
|
3.1 Defence key stakeholder satisfaction of the alignment and impact of Defence Intelligence Enterprise intelligence assessments and products |
3.1a The percentage of Defence Intelligence Enterprise intelligence assessments and products aligned to the Defence Intelligence Prioritisation Framework 3.1b The percentage of satisfaction key stakeholders report in the impact of Defence Intelligence Enterprise intelligence assessments and products to their decision-making |
● (Baseline established) |
|
4.1 Defence recruits and retains an ADF and APS workforce to support the Defence mission |
4.1a Defence achieves the ADF and APS Budgeted Workforce Requirement as set out in the 2024 Defence Workforce Plan 4.1b The net flow of the ADF and APS workforce over a 12 month period is trending positive and is positioning Defence to achieve the Budgeted Workforce Requirement over the forward estimates |
◆ |
|
4.2 Defence grows the necessary skills and capabilities to enable the Defence mission |
4.2a The Defence workforce has the technical skills required to deliver the National Defence Strategy as measured through the Defence Strategic Workforce Segments 4.2b The net flow of the ADF and APS workforce over a 12 month period against the Budgeted Workforce Requirement by Strategic Workforce Segment |
▲ |
|
4.3 The Defence Values and Behaviours enable our people to deliver Australia’s National Defence |
4.3a. The proportion of ADF and Defence APS personnel that believe appropriate action will be taken if they report an incident of unacceptable behaviour has increased in the last 12 months 4.3b. The proportion of ADF and Defence APS personnel who have experienced any unacceptable behaviour in the workplace has decreased in the last 12 months 4.3c The proportion of ADF and Defence APS personnel who are of the view that Defence Values are being used in their work area has increased in the last 12 months |
■ |
|
4.4 Defence supports ADF members and their families by providing access to support services and programs having regard to lifetime wellbeing |
4.4a At least 75 per cent of eligible permanent ADF members and their families are registered with the ADF Family Health Program 4.4b 100 per cent of support services and programs are provided to permanent ADF and their families in accordance with identified service delivery timeframes 4.4c Defence suicide prevention training is practical, tailored, informed by lived experience and delivered in-person 4.4d 100 per cent of Defence-led, Government-agreed recommendations from the Royal Commission into Defence and Veteran Suicide Final Report which are on the Forward Work Plan for the Program Board in 2024-25, have approved Reform Management Plans by 30 June 2025 |
▲ |
|
5.1 The ADF has a near persistent presence in Australia’s immediate region |
5.1a Defence maintains its regional forward force presence through ADF operations, activities and investments |
● (Baseline established) |
|
5.2 Defence enhances Australia’s relationships with the Government’s priority Indo-Pacific and global partners |
5.2a Defence effectively implements action items from annual 2+2 (Foreign Affairs and Defence) ministerial meetings |
◆ |
|
6.1 Defence is delivering the right future capability at the right time within the Integrated Investment Program to ensure it is equipped to respond to future security challenges as directed by the National Defence Strategy |
6.1a 80 per cent or more of approved Integrated Investment Program projects by domain are on track to deliver the scope approved by Government 6.1b 80 per cent or more of approved Integrated Investment Program projects by domain are on track to deliver within the schedule approved by Government 6.1c 80 per cent or more of approved Integrated Investment Program projects by domain are on track to deliver within the cost (including contingency) approved by Government |
▲ |
|
7.1 Defence strengthens the sovereign defence industrial base across critical industrial capabilities |
7.1a 80 per cent or more of the Defence Industry Development Grant Program budgeted allocation is awarded 7.1b Defence supports Australian defence industry in international markets. This is demonstrated by an increase in the number and value of exports by Australian suppliers supported by the Global Supply Chain and Team Defence Australia programs. 7.1c Defence direct economic contribution to the Australian economy. This will be demonstrated by the percentage of Defence’s contribution compared to the previous year 7.1d Defence drives investment in innovation, science and technology to deliver against defence priorities as set by Government 7.1e Percentage of Defence’s contracts to Indigenous enterprises to meet the annual portfolio targets as calculated by the National Indigenous Australians Agency to comply with the Indigenous Procurement Policy 2024–28 — Australian Government annual targets for volume and value. 7.1f Defence supports the development of the domestic manufacture of guided weapons, explosive ordnance and munitions to deliver against defence priorities as set by Government |
▲ |
|
8.1 Defence improves regulatory performance and capability through the finalisation of export permit applications within benchmark timeframes and reduction of export permits to the United States and United Kingdom facilitated via the AUKUS licence-free environment |
8.1a Defence will finalise the approved export permit applications within benchmark timeframes (15 days for non-complex applications; and 35 days for complex applications). 8.1b Defence processes fewer permits each year in total to the United States and United Kingdom since the introduction of the AUKUS Licence-Free Environment (from 1 September 2024) |
▲ |
Key: ◆ Achieved ▲ Partially achieved ■ Not achieved ● Other
Source: ANAO analysis of Defence’s annual performance statements (available from https://www.defence.gov.au/about/accessing-information/annual-reports
Department of Education (Education)
Education’s purpose is to ‘create a better future for all Australians through education.’
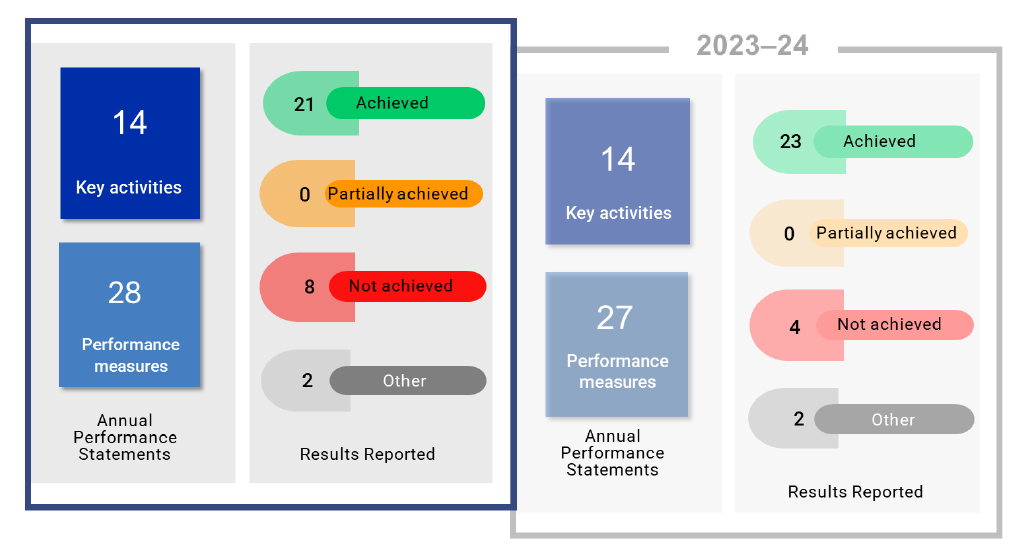

Education’s overall maturity was assessed as Embedded, and the department was rated as ‘Embedded’ against all maturity categories.
The ANAO recommended the department consider how it embeds performance reporting throughout the organisation to provide useful insights into the performance of its divisions. Performance reporting could also be used as a tool to increase transparency and accountability.
Education 2024–25 closing position
|
A (significant) findings |
B (moderate) findings |
C (minor) findings |
|
0 |
1 |
1 |
Source: ANAO.
Education’s 2024–25 closing position contains:
- a B finding relating to the meaningfulness of its performance statements. The ANAO identified weaknesses relating to the design of a number of the department’s performance measures and targets which limits the usability of the performance statements to measure and assess the achievement of purposes. Further, the analysis for some measures has limited information on the department’s role; and
- a C finding relating to delays or errors in modifying or removing user UniPay user access. UniPay is the Universities Payment IT system and generates information for measures PM012 and PM076. ANAO testing
|
Measure |
Target |
Result |
|
PM002 Proportion of accurate Child Care Subsidy payments to all services |
90% or higher |
◆ |
|
PM054 The proportion of services supported by the Community Child Care Fund (CCCF) and Inclusion Support Program (ISP) in socio-economically vulnerable and disadvantaged communities |
Increase on previous year |
■ |
|
PM055 Lower the proportion of students in the Needs Additional Support proficiency level in NAPLAN for reading for Year 3 students (nationally). |
Decrease on previous year |
■ |
|
PM056 Lower the proportion of students in the Needs Additional Support proficiency level in NAPLAN for Numeracy for Year 3 students (nationally). |
Decrease on previous year |
◆ |
|
PM059 Increase the proportion of students attending school 90% or more of the time. |
Increase on previous year |
■ |
|
PM067 Average early childhood education and care hours attended by children that are supported by Additional Child Care Subsidy |
Equal to or higher than the average early childhood education and care hours attended by children that are supported by Child Care Subsidy |
◆ |
|
PM069 Proportion of children enrolled in quality preschool programs in the year before full-time school who are enrolled for 600 hours per year. |
|
◆ |
|
◆ |
|
|
◆ |
|
|
PM070 Recurrent funding payments to approved authorities for government schools under the Australian Education Act 2013 are made in a timely manner. |
100% |
◆ |
|
PM071 Recurrent funding payments to approved authorities for non-government schools under the Australian Education Act 2013 are made in a timely manner |
100% |
◆ |
|
PM072 Increase the proportion of people (age 20–24) attaining Year 12 certification, or equivalent, or gaining a qualification at Certificate III or above |
|
■ |
|
■ |
|
|
PM073 The Australian Government will work to deliver the Better and Fairer Schools Agreement (the Agreement) with states and territories, focusing on driving real improvements in learning and wellbeing outcomes for students, with a focus on students from disadvantaged backgrounds. The Agreement will be operational from January 2025 |
The Better and Fairer Schools Agreement will be developed throughout the 2024 calendar year in consultation with states and territories, so that the Agreement is operational by January 2025 |
◆ |
|
PM077 Percentage of Office for Youth program participants who felt they influenced a government policy or program |
No target |
● (data not available) |
|
PM078 Percentage of Australian Government departments and agencies that worked with the Office for Youth and felt supported to engage with young people |
No target |
● (data not available) |
|
PM009 The proportion of the 25- to 34-year-old population with a tertiary qualification |
Increase from previous year |
■ |
|
PM010 The rate of attrition for domestic bachelor students |
Lower than 15% |
◆ |
|
PM011 Proportion of undergraduates who are employed within 4 to 6 months of completing a degree |
85% or higher |
◆ |
|
PM012 Proportion of eligible universities able to meet specified superannuation expenses |
100% |
◆ |
|
PM014 Proportion of domestic undergraduates who are from a low socio-economic background (based on Statistical Area level 1). |
16% or higher |
◆ |
|
PM015 Proportion of higher education students who are First Nations |
2% or higher |
◆ |
|
PM016 Proportion of domestic undergraduate students who rate the teaching quality at their institution positively |
80% or higher |
■ |
|
PM017 Proportion of employers who are satisfied with the skills of graduates (overall across all skills) |
85% or higher |
◆ |
|
PM018 The proportion of HELP debt not expected to be repaid on new debt |
Equal to or lower than the previous year |
◆ |
|
PM019 The proportion of research publications in the world’s top 10% most highly cited journals that are Australian research publications |
Above the Organisation for Economic Co-operation and Development (OECD) average |
◆ |
|
PM020 Proportion of domestic research postgraduates who are employed within 4 to 6 months of completing their degree |
90% or higher |
◆ |
|
PM021 First Nations higher degree by research (HDR) completions |
Increase from previous year |
◆ |
|
PM026 Proportion of international students employed after graduation |
70% or higher |
◆ |
|
PM027 Number of students enrolled in offshore education and training delivered by Australian providers |
Increase from previous year |
■ |
|
PM076 Accurate and timely allocation of Commonwealth supported places (CSP) funding, as set out within university Commonwealth funding agreements |
100% of allocations under the Nuclear Powered Submarine Program are accurately reflected in providers’ Commonwealth funding agreements, and at least 90% of payments, which are included in the broader Commonwealth Grant Scheme Higher Education Course Advance payments through the UniPay system, are made on time |
◆ |
Key: ◆ Achieved ▲ Partially achieved ■ Not achieved ● Other
Source: ANAO analysis of Education’s annual performance statements (available from https://www.education.gov.au/about-department/resources/department-education-202425-annual-report).
Department of Employment and Workplace Relations (DEWR)
DEWR’s purpose is to ‘support people in Australia to have safe, secure and well-paid work with the skills for a sustainable future.’


DEWR’s overall maturity was assessed as Embedded. Leadership and culture was rated ‘Advanced’ while, governance, data and systems, and capability were rated as ‘Embedded.’ Reporting and records was rated as ‘Baseline.’
The ANAO recommended DEWR address gaps in reporting at the key activity and program level by providing information in the group analysis that gives the reader a better understanding of program outcomes. As a first-year audit, the department has a chance to improve the analysis component of its reporting against individual measures.
DEWR 2024–25 closing position
|
A (significant) findings |
B (moderate) findings |
C (minor) findings |
|
0 |
0 |
2 |
Source: ANAO
DEWR’s 2024–25 closing position contains two C findings relating to:
- weaknesses in DEWR’s data governance and quality assurance processes to gain assurance over the completeness and accuracy of datasets relevant to several measures;
- DEWR’s performance statements preparation process, and the ANAO’s identification of gaps and inaccuracies in Performance Measure Assessment Tools.
|
Measure |
Target |
Result |
|
EM002 Proportion of participants who are satisfied with the overall quality of services delivered |
|
◆ |
|
◆ |
|
|
◆ |
|
|
EM005 Proportion of Workforce Australia Services participants who achieve a 26-week Employment Outcome |
15% or higher |
■ |
|
EM006 Proportion of participants in work or study three months after exiting services |
|
■ |
|
◆ |
|
|
◆ |
|
|
EM009 Proportion of Workforce Australia Services participants who believe working with their provider has improved their chances of getting a job |
66% or higher |
◆ |
|
EM010 Proportion of employers who are satisfied with the assistance from Australian Government employment services |
80% or higher |
◆ |
|
EM011 Investment per employment outcome |
$3,500 or lower per employment outcome |
■ |
|
EM012 Average time to process decision-ready employer applications to join the Pacific Australia Labour Mobility (PALM) scheme |
12 weeks or less |
◆ |
|
SK001 Proportion of VET graduates who are satisfied with the overall quality of the training |
|
◆ |
|
◆ |
|
|
◆ |
|
|
SK002 Proportion of VET graduates who are employed or enrolled in further study after training |
|
◆ |
|
◆ |
|
|
◆ |
|
|
SK004 Proportion of employers that report use of the VET system |
50% or higher |
● (Data not available) |
|
SK005 Proportion of participant assessments in the Skills for Education and Employment (SEE) program that show language, literacy, numeracy and digital literacy skills improvements |
80% or higher |
◆ |
|
SK007 Proportion of units of study successfully completed by VET Student Loans (VSL) students |
70% or higher |
◆ |
|
SK009 Proportion of students who report that financial barriers to training were removed by participation in the program |
No target |
● |
|
SK010 Support to the Nuclear-powered Submarine Program is provided through engagement and advice on workforce and training |
No target |
● |
|
SK011 Proportion of apprenticeship commencements in priority occupations |
Maintain or increase compared to previous year |
◆ |
|
WR001 Proportion of assessed economic data and analysis to support the effective operation of the workplace relations system that is timely |
100% |
◆ |
|
WR002 Average processing time for initial claims under the Fair Entitlements Guarantee program |
14 weeks or less |
◆ |
|
WR003 Proportion of claim payments made under the Fair Entitlements Guarantee program that are correct |
95% or higher |
◆ |
|
WR004 Total Recorded Injury Frequency Rate (TRIFR) collectively reported by companies accredited under the Work Health and Safety Accreditation Scheme |
Rate is lower than the previous calendar year |
◆ |
Key: ◆ Achieved ▲ Partially achieved ■ Not achieved ● Other
Source: ANAO analysis of DEWR’s annual performance statements (available from https://www.dewr.gov.au/about-department/resources/department-employment-and-workplace-relations-annual-report-2024-25).
Department of Finance (Finance)
Finance’s purpose is to ‘provide high quality advice, frameworks, and services to achieve value in the management of public resources for the benefit of all Australians.’

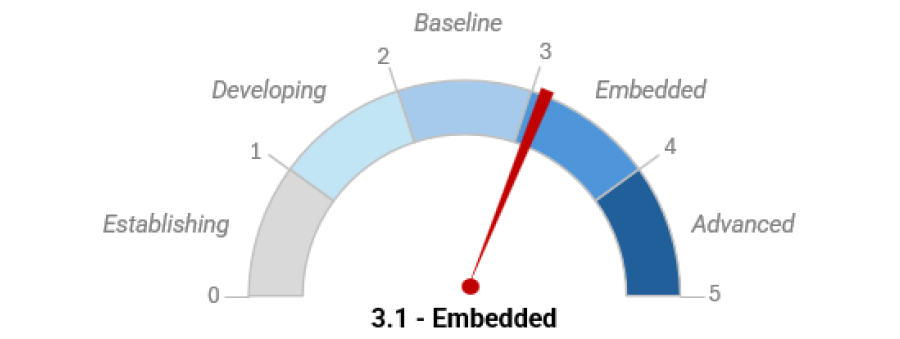
Finance’s overall maturity was assessed as Embedded. Leadership and culture, governance and capability were assessed as ‘Embedded’. ‘Data and systems and reporting and records were rated as ‘Baseline.’
The ANAO found that clear and consistent practices to gain assurance over third party data will be required to reliably measure the department’s monitoring activities and the impact of their guidance, frameworks and services. Finance could improve its capability by ensuring that line areas follow the methodologies established in performance measure records.
Finance 2024–25 closing position
|
A (significant) findings |
B (moderate) findings |
C (minor) findings |
|
0 |
0 |
4 |
Source: ANAO
The Department of Finance’s 2024–25 closing position contains four C findings relating to:
- improving the measurement and assessment of whether the frameworks that Finance owns are fit-for-purpose and working as intended;
- developing a method to establish its key activities;
- developing an efficiency measure to report on the work of the Service Delivery Office; and
- clearly documenting and following the method to support measures 6.1.3 (establishing or relocating permanent offices) and the survey measures (1.4.1, 2.1.1 and 3.3.1).
|
Measure |
Target |
Result |
|
1.1 Budget updates and appropriation bills |
1.1.1 Variances between estimated expenses and final outcome are within set parameters |
■ |
|
1.1.2 Budget papers and related updates meet timeframes set out in the Charter of Budget Honesty Act 1998 |
◆ |
|
|
1.1.3 Appropriation bills introduced at times intended by the government |
◆ |
|
|
1.2 Financial reporting |
1.2.1 The Auditor-General issues an unmodified audit report on the Consolidated Financial Statements |
◆ |
|
1.2.2 Monthly Financial Statements are prepared within 21 days of the end of the month, on average |
◆ |
|
|
1.2.3 The Consolidated Financial Statements meet timeframes set out in section 48 in the Public Governance, Performance and Accountability Act 2013 |
◆ |
|
|
1.3 Cash management |
1.3.1 100% of entities have access to cash within agreed timeframes |
◆ |
|
1.4 Finance advice |
1.4.1 Percentage of stakeholders surveyed rate Finance’s advice and support highly (establish baseline) |
● (baseline established) |
|
1.4.2 The Minister for Finance, or their representative, rate Finance’s advice as effective and timely (establish baseline) |
● (baseline established) |
|
|
2.1 Finance advice |
2.1.1 Percentage of stakeholders surveyed rate Finance’s advice and support highly (establish baseline) |
● (baseline established) |
|
2.1.2 The Minister for Finance and Special Minister of State, or their representatives, rate Finance’s advice as effective and timely (establish baseline) |
● (baseline established) |
|
|
2.2 Procurement and grants |
2.2.1 The AusTender and GrantConnect systems are available 99% of the time during business hours, excluding scheduled outages |
◆ |
|
2.2.2 75% or more panel usage rate for whole-of-Australian-Government (WoAG) coordinated procurement arrangements |
◆ |
|
|
2.3 Risk Management |
2.3.1 Sustained or positive improvement to the risk management maturity rating across the General Government Sector |
◆ |
|
2.4 Administration of pension schemes |
2.4.1 No material compliance matters in relation to the operations of the pension schemes administered by Finance |
◆ |
|
2.4.2 100% of pension payments made on time |
◆ |
|
|
2.4.3 100% of statutory reporting obligations complied with |
◆ |
|
|
3.1 Commonwealth property initiatives |
3.1.1 The whole-of-Australian Government (WoAG) Property Services Coordinated Procurement Arrangements deliver property efficiencies |
▲ |
|
3.1.2 Ratings at or above Meets Most Expectations for all Property Service Providers (PSPs) |
◆ |
|
|
3.2 Comcover |
3.2.1 As at 30 June, Comcover’s special account balance can cover at least 3 years of forecasted cash outflow, as actuarially assessed |
◆ |
|
3.2.2 No breaches of the model litigant obligation under the Legal Services Directions |
◆ |
|
|
3.3 Finance advice |
3.3.1 Percentage of stakeholders surveyed rate Finance’s advice and support highly (establish baseline) |
● (baseline established) |
|
3.3.2 The Minister for Finance and Special Minister of State, or their representatives, rate Finance’s advice as effective and timely (establish baseline) |
● (baseline established) |
|
|
4.1 Shared services hub |
4.1.1 Accounts payable – Proportion of correctly submitted invoices are processed in line with Australian government policy (target: 100%) |
◆ |
|
4.1.2 Accounts receivable – Proportion of financial documents processed, and debts administered in line with client Accountable Authority Instructions (AAIs) and Australian government policy (target: 100%) |
◆ |
|
|
4.1.3 Payroll administration – Proportion of pay slips for employees, serving board and committee members paid correctly, following delegate approval and on time (target: 100%) |
▲ |
|
|
4.1.4 HUB usage – Proportion of planned days clients can manage their services, data, and ledger maintenance activities through HUB (ERP) system (target: 100%) |
▲ |
|
|
4.1.5 The average resolution time of client requests (target: <10 days) |
◆ |
|
|
4.2 ICT systems and services |
4.2.1 ICT systems are available 99% of the time, excluding scheduled outages |
◆ |
|
4.2.2 Meet or exceed a customer satisfaction (CSAT) target of 85% for closed or resolved service requests or tickets |
◆ |
|
|
5.1 Office of the National Data Commissioner |
5.1.1 The number of new data sharing requests on Dataplace that lead to sharing increases by 30% on the previous year |
◆ |
|
5.2 Digital ID |
5.2.1 Develop and implement rules and other legislative instruments needed to support the implementation of the Digital ID Act 2024 |
◆ |
|
6.1 Ministerial and parliamentary services |
6.1.1 100% of payroll payments are made accurately and on time |
▲ |
|
6.1.2 100% of expense payments are made accurately and on time |
▲ |
|
|
6.1.3 100% of projects to establish or relocate permanent offices are delivered in accordance with the prescribed standards |
◆ |
|
|
6.1.4 The COMCAR Automated Resource System (CARS) is available 99% of the time, excluding scheduled outages, and 99% of COMCAR reservations are completed without service failure |
◆ |
|
|
6.1.5 The Parliamentary Expenses Management System (PEMS) is available 99% of time, excluding scheduled outages |
◆ |
|
Key: ◆ Achieved ▲ Partially achieved ■ Not achieved ● Other
Source: ANAO analysis of Finance’s annual performance statements (available from https://www.finance.gov.au/publications/annual-report/annual-report-2024-25).
Department of Foreign Affairs and Trade (DFAT)
DFAT’s purpose is ‘to make Australia stronger, safer and more prosperous, to provide timely and responsive consular and passport services, and to ensure a secure Australian Government presence overseas.’
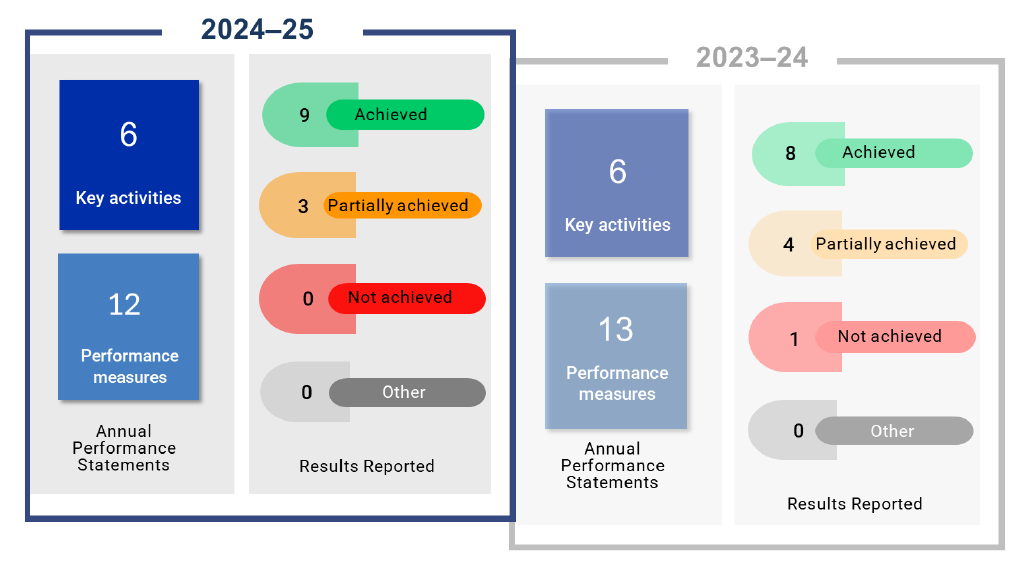

DFAT’s overall maturity was assessed as Embedded. Leadership and culture, capability and reporting and records were assessed as ‘Embedded.’ Governance was rated as ‘Advanced’ and data and systems as ‘Baseline.’
In the data and systems category, the ANAO noted that use of legacy systems was prevalent in many processes. Under leadership and culture, the delivery of case studies was seen as an example of effective management and delivery for performance reporting.
DFAT 2024–25 closing position
|
A (significant) findings |
B (moderate) findings |
C (minor) findings |
|
0 |
0 |
0 |
Source: ANAO
DFAT had no findings at the end of the 2024–25 audit.
|
Measure |
Target |
Result |
|
1. DFAT’s diplomatic efforts support favourable foreign affairs and trade policy outcomes for Australia |
Six case studies demonstrate performance.
|
▲ |
|
2. Increased number and diversity of Australian university undergraduates with Indo-Pacific capability |
|
▲ |
|
3. Australia’s standing in the region is enhanced through DFAT’s public diplomacy |
Case study on implementation of planned first-year activities of the Australia-ASEAN Centre demonstrate performance |
◆ |
|
4. Australia’s treaty obligations are met under Australia’s Comprehensive Safeguards Agreement and Additional Protocol to the satisfaction of the International Atomic Energy Agency |
The International Atomic Energy Agency (IAEA)grants a ‘broader conclusion’ for Australia confirming Australia’s compliance with its Comprehensive Safeguards Agreement and Additional Protocol treaty obligations |
◆ |
|
5. The development program is effective, efficient and responsive |
At least 85% of investments are assessed as satisfactory on both effectiveness and efficiency criteria in the investment monitoring reports process |
◆ |
|
6. Australia’s payments to multilateral development organisations generate collective action on issues impacting Australia |
Mandatory payments to multilateral development institutions are paid on time |
◆ |
|
7. International organisations reflect Australian interests and values when addressing global challenges |
Three focus areas demonstrate Australia’s influence and engagement in international institutions including: Delivery of planned strategic objectives for United Nations General Assembly High Level Week; election of Australian multilateral candidatures; and delivery of the UN Junior Professional Officer Program |
▲ |
|
8. Australians have access to consular information and services, including in times of crisis |
|
◆ |
|
9. Australian passports are processed efficiently |
|
◆ |
|
10. Customers are satisfied with passport services |
85 per cent satisfaction rate overall from customer surveys |
◆ |
|
11. Australian Government staff, information and assets overseas are protected through appropriate risk-focused security measures |
DFAT achieves the set security performance standards across a majority of its posts in the areas of compliance, culture and responsiveness to incidents |
◆ |
|
12. The overseas property estate is effectively maintained and fit-for-purpose |
|
◆ |
Key: ◆ Achieved ▲ Partially achieved ■ Not achieved ● Other
Source: ANAO analysis of DFAT’s annual performance statements (available from https://www.dfat.gov.au/about-us/publications/corporate/annual-reports).
Department of Health, Disability and Ageing (DHDA)
DHDA’s purpose is ‘We support the Government to lead and shape Australia’s health, disability and aged care systems and outcomes through evidence-based policy, well targeted programs, and best practice regulation.’
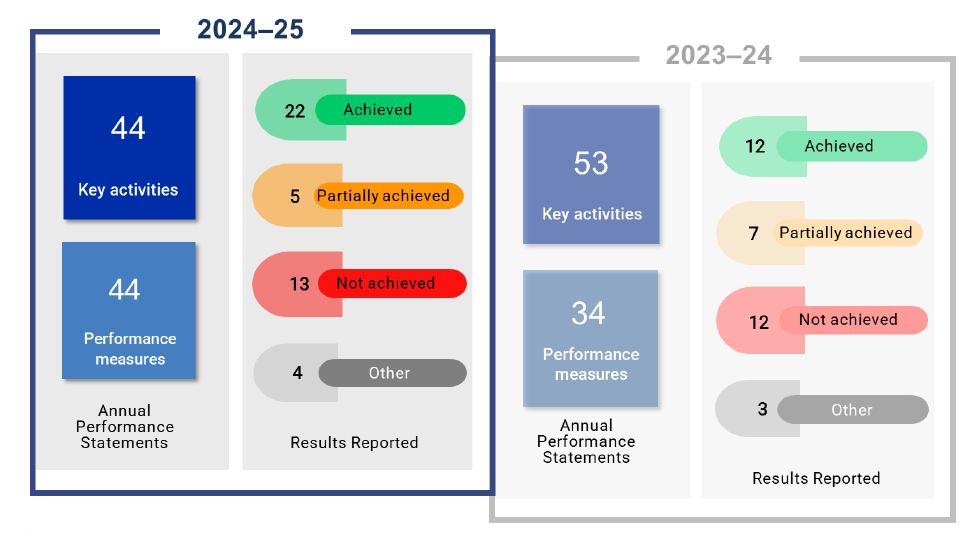

DHDA’s overall maturity was assessed as Baseline. Leadership and culture, governance, capability, and reporting and records were rated as ‘Embedded.’ Data and systems was rated as ‘Baseline.’
The ANAO found that, for some performance measures, the department’s reliance on a specific data warehouse and third-party providers presents risks. A more considered approach is required to obtain assurance that the measures are reliable and verifiable.
DHDA 2024–25 closing position
|
A (significant) findings |
B (moderate) findings |
C (minor) findings |
|
1 |
1 |
3 |
Source: ANAO
DHDA’s 2024–25 closing position contains:
- an A finding relating to the appropriateness (reliable, verifiable, unbiased basis) of several performance measures reflecting (among other issues) weaknesses in data governance and quality assurance processes;
- a B finding relating to the lack of an established methodology with clear evidentiary requirements to support the measure on the Sector Development Fund and Jobs and Market Fund;
- a C finding relating to reviewing and improving the selection of key activities and performance measures;
- a C finding relating to required improvements in planning and reporting processes, including the need for consistency in evidence packs, implementing robust quality assurance processes, and developing a performance statements preparation plan;
- a C finding relating to improved narrative and analysis for those measures where it is not possible to report in-year results.
|
Measure |
Target |
Result |
|
|
1.1A MRFF funds are disbursed towards grants of financial assistance to support research that addresses the Australian Medical Research and Innovation Priorities |
|
◆ |
|
|
1.2A PHN-commissioned mental health services used per 100,000 populationa |
Annual increase from 2023-24 |
◆ |
|
|
1.2B Patients using Medicare-subsidised mental health services per 100,000 population |
Annual increase from 2023–24 |
◆ |
|
|
1.2C Number of headspace services delivered per 100,000 population of 12 to 25 year oldsa |
Annual increase from 2023–24 |
◆ |
|
|
1.2D The Annual National Report Card is published annually by the end of June. |
National Report Card published by 30 June 2025 |
■ |
|
|
1.2E Development of the National Suicide Prevention Outcomes Framework |
Design phase of the National Suicide Prevention Outcomes Framework to be completed 30 June 2025 |
◆ |
|
|
1.3A Increase the percentage of annual Indigenous Australians’ Health Programme (IAHP) funding directed to ACCHOs |
72% |
◆ |
|
|
1.3B Increase the percentage of First Nations people attending Indigenous Australians’ Health Programme (IAHP) funded services who undertake a 715 health check |
47% |
◆ |
|
|
1.4A Effective investment in workforce programs will improve health workforce distribution in Australia.
|
MM1 2024–25
|
MM2 2024–25
|
▲ |
|
1.5A Improve overall health and wellbeing of Australians by achieving preventive health targets.
|
|
■ |
|
|
1.5B Increase the level of cancer screening participation:
|
|
▲ |
|
|
1.5C Improve overall health and wellbeing of Australians by achieving healthy eating and physical activity targets.
|
|
■ |
|
|
1.6A The number of Primary Health Network regions in which the rate of potentially preventable hospitalisations is declining, based on the latest available Australian Institute of Health and Welfare longitudinal data |
28 |
■ |
|
|
1.6B The number of calls handled on the Health Information and Advice phone line |
1,107,913 |
◆ |
|
|
1.6C The proportion of calls received on the Health Information and Advice phone line that are handled |
No target |
● (baseline established) |
|
|
1.7A Maintain Australia’s access to quality general practitioner care through the percentage of accredited general practices submitting PIP Quality Improvement Incentive data to their Primary Health Network |
≥ 95% |
■ |
|
|
1.7B Percentage of medical professionals who can access medical indemnity insurance without the application of a risk surcharge or a refusal of medical indemnity insurance cover |
95% |
● (data not available) |
|
|
1.8A Percentage of therapeutic goods evaluations that meet statutory timeframes |
100% |
■ |
|
|
1.8B Number of completed inspections of licence holders under the Narcotic Drugs Act 1967 |
30 |
◆ |
|
|
1.8C
|
|
◆ |
|
|
1.8D Proportion of Industrial chemical risk assessments completed within statutory timeframes |
≥ 95% |
◆ |
|
|
1.9A Immunisation coverage rates:
|
|
■ |
|
|
2.1A Percentage of Australians accessing Medicare Benefits Schedule services |
> 90% |
■ |
|
|
2.2A
|
|
■ |
|
|
2.3A Percentage of new medicines recommended by the Pharmaceutical Benefits Advisory Committee (PBAC) that are listed on the Pharmaceutical Benefits Scheme within 6 months of in principle agreement to listing arrangements |
≥ 80% |
◆ |
|
|
2.4A Percentage of applications to the Minister from private health insurers to change premiums charged under a complying health insurance product that are assessed within approved timeframes |
100% |
◆ |
|
|
2.5A The percentage of eligible children accessing essential dental health services through the Child Dental Benefits Schedule |
38.5% |
◆ |
|
|
2.6A Percentage of completed audits, practitioner reviews and investigations that find non-compliance |
> 80% |
◆ |
|
|
2.7A Number of people accessing subsidised products through the National Diabetes Services Scheme |
> 750,000 |
◆ |
|
|
3.1A Older people and their support networks have access to reliable and trusted information through My Aged Carea |
|
■ |
|
|
3.1B Older people are assessed for service needa |
|
■ |
|
|
3.2A Older Australians are treated with respect and dignity in receiving aged care services |
Maintain or increase the average Residents’ Experience Survey (RES) Score of 84% for residential aged care homes. |
◆ |
|
|
3.2B Older people receive residential care services that contributes to their quality of life.
|
|
▲ |
|
|
3.2C Older people with diverse backgrounds and life experiences or who live in rural and remote areas can receive culturally safe and equitable aged care services where they livea |
|
■ |
|
|
3.2D Older people receive care and support at home that contributes to quality of life.
|
|
▲ |
|
|
3.3A Aged care workforce is available and appropriately skilled to deliver safe and high-quality care to older peoplea |
|
● (baseline established) |
|
|
4.1A Extent to which wellbeing of carers who are registered with Carer Gateway local service providers is assessed as improvedb |
|
▲ |
|
|
4.1B Extent to which the evidence base is built for Australia’s Disability Strategyb |
Increase measures under ADS 2021–2031 Outcomes Framework with data reported |
◆ |
|
|
4.1C Extent to which the department contributes to attracting, recruiting, and retaining more people with disability in the Australian Public Serviceb |
That the Department of Social Services’ workforce includes at least 7% of people identifying with disability |
◆ |
|
|
4.1D Progress towards the target relating to younger people in residential aged care (YPIRAC) b |
No people under 65 years living in residential aged care by 2025 apart from in exceptional circumstances |
■ |
|
|
4.2A The department works with states and territories and the NDIA to support national implementation of the NDIS in accordance with inter government agreementsb |
Full scheme agreements signed with all states and territories by 30 June 2025 |
◆ |
|
|
4.2B The extent to which the department is advising on and/or delivering market initiatives that influence the development of the market and workforce for NDIS participantsb |
Number of market initiatives advised on and/or delivered by the department to develop the market and workforce (Target: 8) |
◆ |
|
|
4.2C National Disability Insurance Scheme cost growth is sustainableb |
Annual growth target in the total costs of the Scheme of no more than 8% by 1 July 2026, with further moderation of growth as the Scheme matures. |
● (data not available) |
|
|
4.2D Legislative amendments developed for governmentb |
Criterion is met if 3 of the 3 progress milestones are delivered |
◆ |
|
Key: ◆ Achieved ▲ Partially achieved ■ Not achieved ● Other
Note a: These measures were the basis for a qualified audit conclusion.
Note b: These measures transferred from the Department of Social Services to the Department of Health, Disability and Ageing during the 2024–25 reporting year as a result of machinery of government changes.
Source: ANAO analysis of DHDA’s annual performance statements (available from https://www.health.gov.au/resources/publications/department-of-health-disability-and-ageing-2024-25-annual-report?language=en).
Department of Home Affairs (Home Affairs)
The purpose of Home Affairs is ‘Helping build a prosperous, secure and united Australia.’
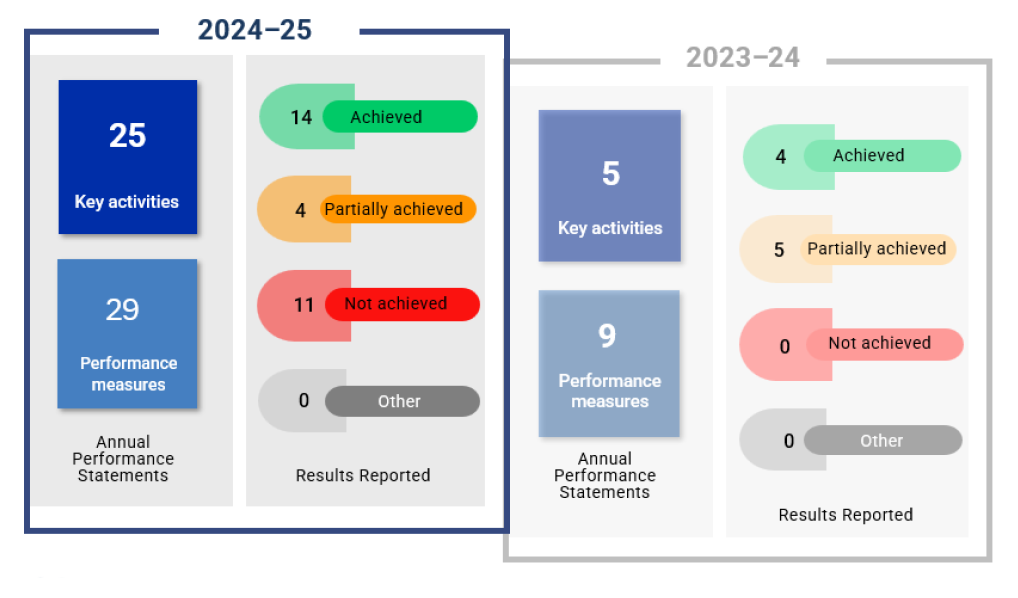
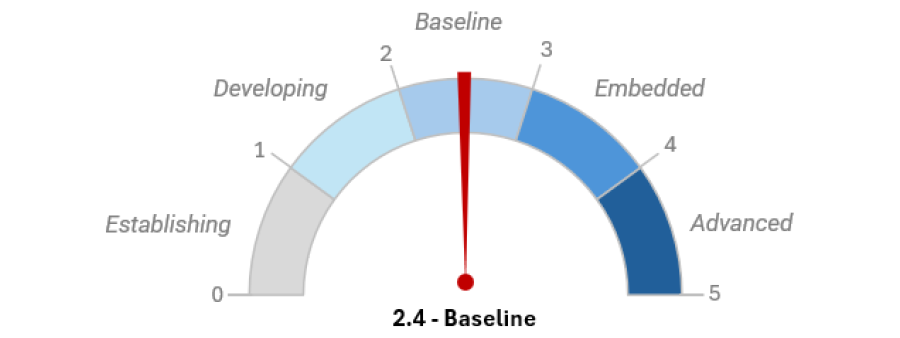
The overall maturity of Home Affairs was assessed as Baseline. Leadership and culture was rated ‘Embedded,’ and governance, capability, and reporting and records were assessed as ‘Baseline.’ Data and systems received a rating of ‘Developing.’
The ANAO highlighted data governance, noting that while policies and procedures are in place, staff are not supported in terms of building data capability to fulfill their responsibilities. The department would benefit from a more systematic approach to identifying risks and assurance processes for data outputs across its reporting functions.
Home Affairs 2024–25 closing position
|
A (significant) findings |
B (moderate) findings |
C (minor) findings |
|
4 |
2 |
0 |
Source: ANAO.
Home Affairs’ 2024–25 closing position contains four A findings relating to:
- sources of information and methodologies that do not support reliable and verifiable reporting of results. There were instances of methodologies not being followed or being changed, key terms and definitions not being identified or inconsistently applied, poor record keeping, and incomplete or inaccurate populations underpinning results;
- deficiencies in Home Affairs’ survey administration, introducing risks of bias and unreliable and unverifiable data;
- Home Affairs’ lack of assurance over the accuracy and completeness of data sets provided by third parties and used for the performance results for the targets on the Humanitarian Settlement Program and Settlement Engagement and Transition Support; and
- lack of appropriate data governance to enable accurate and complete reporting. The areas for improvement relate to script assurance and change management processes, and highly manual data recording and transfer processes.
Home Affairs’ closing position also contains two B findings relating to:
- inadequate performance statements preparation processes; and
- the meaningfulness of reporting against several targets, which the ANAO found were too narrowly defined to effectively assess the department’s key activities and objectives.
|
Measure |
Target |
Result |
|
Cross activity |
1. 80% of policy advice provided to government was assessed by stakeholders as being of high quality |
■ |
|
Capability building, engagement and regulatory activities support regulated entities to understand and comply with transport security obligations |
2. 75% of surveyed representatives of transport security stakeholder forums agree that the forum provides useful and relevant information to assist participants to understand transport security policy, and to better meet their obligations under transport security legislative frameworks 3. 75% of surveyed interlocutors participating in the Transport Security International Capability Building Program, agree that the annual program developed in response to a Last Ports of Call (LPOC) assessment has assisted them to put in place a mitigation plan or measures that reduce air cargo and/or aviation security risks 4. 100% of transport security non-compliance is corrected by industry or is the subject of follow-up regulatory inspection and/or enforcement action within:
5. 95% of applications under the administered transport security legislation relating to entry control and regulatory settings for aviation and maritime security are finalised to approve, refuse or unable to be assessed within the statutory consideration period or the negotiated timeframe |
◆ |
|
Industry engagement, background checking and regulatory activities support the protection of critical infrastructure and systems of national significance |
6. 75% of surveyed industry participants for the Critical Infrastructure Advisory Council agree that the forum provides information to assist the broader Trusted Information Sharing Network to better understand critical infrastructure security policy, and assists them in meeting their obligations under the Security of Critical Infrastructure Act 2018 7. 100% of notifications and notification exemption requests received under the Telecommunications Sector Security reforms to the Telecommunications Act 1997 are responded to within 30 calendar days for notifications and 60 calendar days for notification exemption requests. 8. 100% of instances of identified non-compliance with obligations in the Security of Critical Infrastructure Act 2018 are subject to a compliance action within 90 days 9. 75% of AusCheck background checks for applicants with no disclosable court outcomes are completed within 20 business days 10. 75% of AusCheck background checks for applicants with disclosable court outcomes are completed within 40 business days 11. The AusCheck Issuing Body (AIB) issues 90% of ASIC/MSICs within 45 business days of receiving a complete application and background check result |
◆ |
|
Progress in delivering the Cyber Security Strategy 2023–2030 contributes to Australia’s cyber security resilience |
12. 75% of department-led activities under the Cyber Security Strategy 2023–2030 Horizon 1 Action Plan are on track for completion within the Horizon 1 timeframe |
◆ |
|
Administration of the Protective Security Policy Framework supports Government cyber security resilience |
13. Complete 100% of scheduled activities required in 2024–25 to transform the Protective Security Policy Framework to a modern administrative compliance framework 14. Complete 100% of scheduled activities required to ensure the Protective Security Policy Framework assurance capability is in place ahead of the 2024–25 assessment reporting period |
■ |
|
National engagement and the delivery of exercises supports cyber security incident preparedness and response |
15. Achieve post reach and engagement rate benchmarks for National Cyber Security Coordinator social media channels 16. 80% of planned cyber security exercises to prepare for cyber incidents are completed within the financial year and any department-led actions identified through these exercises are completed within agreed timeframes 17. 90% of surveyed participants in a cyber security consequence management exercise indicated the exercise supported preparedness to respond to a cyber security incident |
▲ |
|
Counter terrorism capability programs and national coordination contributes to the management of terrorist threats |
18. 85% of surveyed participants in scheduled Australia-New Zealand Counter-Terrorism Committee (ANZCTC) training indicated the training delivered was aligned to, and supported, the expected capability uplift 19. 100% of known persons of counter-terrorism interest offshore or foreign fighters seeking to return/travel to Australia are assessed and appropriate mechanisms are developed to manage the risk associated with their return |
◆ |
|
Counter violent extremism through the delivery of training, capability and awareness programs |
20. 85% of surveyed participants are satisfied that the department’s counter violent extremism (CVE) training improved their CVE intervention capability and awareness 21. 85% of surveyed States and Territories’ CVE coordinators are satisfied with the department’s coordination of the Living Safe Together Intervention Program and High Risk Reintegration and Rehabilitation Program 22. Cost per alternative-narrative communications activities (including Rapt! and Fearlessly Australian) video view is the same or lower than the previous financial year |
▲ |
|
Counter foreign interference threats through capability and awareness activities and targeted initiatives |
23. 80% of surveyed university sector participants in counter foreign interference table top exercises and campus culture workshops are satisfied that the activity improved their understanding of foreign interference risks and would be useful to inform future mitigations 24. Deliver all announced department-led initiatives to counter foreign interference scheduled for completion in 2024–25 25. 80% of surveyed industry participants identified that TechFIT improved organisational awareness of foreign interference risks |
■ |
|
Implementation of migration reforms under the Migration Strategy: Getting migration working for the nation contributes to productivity, addressing skills shortages and supports more sustainable planning |
26. 80% of department-led initiatives funded and prioritised by government under the Migration Strategy: Getting migration working for the nation scheduled for completion by 30 June 2025 were implemented in full |
◆ |
|
Delivery of the Migration and Citizenship Programs contributes to economic prosperity and aligns to national interests |
27. The Migration Program is delivered consistent with planning levels set by government 28. Median visa processing times across four of the six key demand driven programs improve or are maintained 29. Average number of finalisations per Full Time Equivalent (FTE) visa processing officers increases across both permanent and temporary visa caseloads 30. Error rates for visa and citizenship decisions subject to quality management activities, do not exceed the pre-determined error rate benchmarks 31. 90% of citizenship by conferral applications are finalised within agreed target timeframes from lodgement to decision |
■ |
|
Delivery of Australia’s Humanitarian Program reflects government priorities and Australia’s international protection obligations |
32. The Humanitarian Program is delivered within the planning ceiling and the onshore/offshore composition set by the government 33. Deliver at least 30,000 Protection (subclass 866) visa finalisations during the 2024–25 program year 34. At least 50% of refused Protection visa applications finalised under the real time processing model during the 2024–25 program year are finalised in 90 days or less from the date of application |
◆ |
|
The management and delivery of settlement and translating and interpreting services support refugees and vulnerable migrants in contributing to and participating in the Australian communitya |
35. 85% of humanitarian entrants exiting the Humanitarian Settlement Program (HSP) have the skills and knowledge to use services in Australia 36. 80% of Settlement Engagement and Transition Support (SETS) clients assessed rated three or above (five-point rating scale) as a measure of the achievement of a client’s individual goals required to support their independence, participation and wellbeing 37. In all instances where Assisted Passage contract Key Performance Indicators (KPIs) were reported as not achieved by the service provider (through quarterly reporting), the department completes an assessment and applies an abatement or requests a remediation action plan to the service provider within 10 business days 38. 85% of enrolled students who responded to the annual AMEP client survey identified that they had improved across a minimum of three English language skills categories 39. 85% of enrolled students who responded to the annual AMEP client survey identified that they learn English for their needs including work, study and community participation 40. TIS National (Translating and Interpreting Services) are provided in a timely and reliable manner |
▲ |
|
Community engagement and multicultural grants programs support government in responding to community needs |
41. 100% of grant programs are delivered within budget and in a timely manner. 42. 80% of surveyed community stakeholders indicated that engagement with the Community Liaison Officer (CLO) Network has helped them feel supported and included in the Australian community |
▲ |
|
Coordination, research and engagement contributes to a cohesive Australia and supports democratic resilience |
43. Deliver an overview and analysis of national social cohesion initiatives, in consultation with states and territories 44. 70% of surveyed participants that attended public engagement on the strengthening Australian democracy: a practical agenda of democratic resilience report indicated that they had an improved understanding of Australian democratic values and the factors that can influence democratic resilience 45. Establish an office within the department responsible for cross-cutting policy on community cohesion |
◆ |
|
Regulation of Registered Migration Agents and implementation of migrant worker exploitation reforms supports the integrity of the visa and migration system |
46. 50% of all investigations (commenced after 1 July 2024) will be finalised within 180 days 47. Reduce the legacy caseload of investigations into Registered Migration Agents by 50% 48. 75% of all early resolution matters will be finalised in 90 days 49. 95% of all initial and repeat applications to become a Registered Migration Agent are assessed within eight weeks of lodgement 50. 80% of the endorsed package of reforms to address migrant workers exploitation are implemented in full by 30 June 2025 |
■ |
|
Character cancellation finalisations and Bridging Visa E application processing contributes to community safety and support those to stay lawfully in Australia |
51. The median Bridging Visa E (BVE) application processing time is five business days or less for all online applications and nine business days or less for paper applications 52. The department delivers at least 28,400 character and cancellation considerations |
■ |
|
Immigration compliance advice, referrals and coordination contributes to community safety |
53. 100% of cases referred to the Community Protection Board (the Board) are scheduled for the Board’s consideration within 90 days 54. 100% of individual recommendations are provided to a Bridging (Removal Pending) Visa delegate within 14 days of the Community Protection Board’s deliberation, where a change in conditions has been suggested 55. 95% of Reports of Crime referred by the department through Operation AEGIS are accepted for further investigation or action by a partner agency. |
■ |
|
Ongoing engagement with third countries supports the settlement of transitory persons outside of Australia |
56. Reduce the transitory person caseload by 17% |
◆ |
|
Effectively maintain a safe, secure and sustainable immigration detention network |
57. The number of critical incidents per 1,000 detainees in the immigration detention network remains comparable or decreases 58. Maintain capacity to accommodate 1,000 detainees in appropriate placements within immigration detention facilities at all times 59. 90% of high-risk detention-related recommendations identified through internal and external scrutiny, that were due for completion prior to 30 June 2025 are completed |
■ |
|
Delivery of facilitation and regulatory activities supports the movement of legitimate tradea |
60. Average clearance rates for air cargo and sea cargo are maintained, compared to a rolling average of clearance rates over the five past financial years 61. 100% of Australian Trusted Traders (ATTs) who fail a compliance activity have remediation action initiated within 30 days. 62. 100% of ATTs who do not successfully complete a remediation action either successfully implement a formal Improvement Plan or termination of the ATT Legal Agreement is commenced |
■ |
|
Delivery of facilitation and technology enhancements supports improved movement of people across Australia’s physical bordera |
63. Average clearance time for all air travellers is maintained or improved, compared to a rolling average clearance time over two past financial years 64. Percentage of eligible air travellers processed through the border using SmartGate technology remains consistent with the previous financial year |
◆ |
|
Examinations, enforcement and compliance activities prevents prohibited goods crossing Australia’s border and contributes to revenue protectiona |
65. Percentage of air and sea cargo examined by ABF officers that leads to an enforcement result remains consistent with previous financial year 66. Maintain the number of sea cargo inspections and examinations and air cargo examinations nationally 67. The annual revenue leakage result is less than 5% of total import value |
◆ |
|
Effective traveller intervention and enforcement activities supports the interdiction of travellers who pose a risk to the Australian communitya |
68. Percentage of air traveller interventions that led to an enforcement result improves or remains consistent with the rolling average over three past financial years |
◆ |
|
Delivery of program and reform activities supports trade and travel modernisation. |
69. 100% of key department-led milestones for design phases of the standalone facilities at Western Sydney Airport scheduled are completed 70. 80% of department-led milestones to deliver reforms under the Simplified Trade System scheduled are completed in full |
◆ |
|
Delivery of trade services, including advice to industry contributes to the trade and traveller experience |
71. 95% of eligible Tourist Refund Scheme (TRS) claims are finalised in a timely manner 72. 90% of drawback claims are finalised in a timely manner 73. 85% of advice is provided to industry on tariff classification, valuation and rules of origin in a timely manner |
■ |
|
Maintain and sustain surveillance and response capability to counter civil maritime threats |
74. 100% of monthly planned aerial surveillance (fixed wing and rotary wing) aircraft are made available 75. 100% of performance deductions for fixed wing and rotary wing to be applied for each month of contract underperformance within two months of the month in which the underperformance occurred 76. 85% operational availability of vessels in the ABF Blue Water Fleet, excluding those vessels undergoing scheduled maintenance activities including mandatory Depot Level Maintenance, Life-of-Type Extension and Scheduled Service Visits 77. 100% of safety incidents, including near misses relating to ABF vessels, are referred to Civil Maritime Sustainment Branch, reviewed and when appropriate, actioned within two months |
◆ |
|
Deterrence messaging, engagement and operational activity contributes to the OSB mission |
78. The ABF effectively supports the Joint Agency Taskforce Operation Sovereign Borders (JATF OSB) mission to deny an irregular maritime pathway to settlement in Australia 79. 80% of high risk recommendations identified in Post Activity Reports are actioned within three months |
◆ |
|
International capability and engagement activities and contract management supports offshore regional processing |
80. 100% of Quality Failures identified through monthly performance management reporting for the Nauru Health Services Contract and the Nauru Facilities, Garrison, Transferee Arrivals and Reception Services Contract are subject to an abatement within two months, and Action Plans are implemented by the service provider within agreed timeframes 81. Deliver 100% of planned capability uplift initiatives to support the Government of Nauru with regional processing operations in line with agreed delivery expectations 82. Deliver 70% of planned activities to support countering irregular migration and strengthen Australia’s regional processing enduring capability |
■ |
Key: ◆ Achieved ▲ Partially achieved ■ Not achieved ● Other
Note a: These measures were the basis of a qualified audit conclusion.
Source: ANAO analysis of Home Affairs’ annual performance statements (available from https://www.homeaffairs.gov.au/reports-and-publications/reports/annual-reports).
Department of Industry, Science and Resources (DISR)
DISR’s purpose is ‘Building a better future for all Australians through enabling a productive, resilient and sustainable economy, enriched by science and technology.’


DISR’s overall maturity was assessed as Embedded. The department was rated as ‘Embedded’ across all five maturity categories.
The ANAO recommended that DISR use its enterprise performance framework to evaluate whether its selected mix of measures deliver meaningful and complete information about their performance in relation to its stated purpose and key activities.
DISR 2024–25 closing position
|
A (significant) findings |
B (moderate) findings |
C (minor) findings |
|
0 |
0 |
1 |
Source: ANAO.
DISR’s 2024–25 closing position contains one C finding relating to:
- the effectiveness and completeness of DISR’s performance reporting, with scope to strengthen the department’s focus on measuring and assessing impact, outcomes and effectiveness.
|
Measure |
Target |
Result |
|
1. Maintaining business co-investment through portfolio initiative funding |
At least $1.20 of business co-investment for every $1.00 of grant funding for portfolio programs that require business co-investment |
◆ |
|
2. Maintaining Business Outreach Network engagement with regional businesses |
25% or more of total Business Outreach Network engagements delivered to regional businesses |
◆ |
|
3. Maintaining applicant satisfaction with the business.gov.au portal grants application process |
Year-on-year maintenance of, or increase in, the proportion of applicants who are satisfied or very satisfied with their experience |
◆ |
|
4. Ensuring compliance with Australian Industry Participation (AIP) plans and engagement of new suppliers |
Maintain or increase:
|
● (baseline set) |
|
5. Meeting legislated and World Trade Organization timeframes through Anti-Dumping Commission (ADC) case management |
Maintain or improve timeframes for a majority of case types against the benchmark year |
◆ |
|
6. Processing registrations under the R&D Tax Incentive |
95% of applications processed within:
|
◆ |
|
7. Facilitating the establishment of research-focused collaborations by businesses through portfolio programs |
Year-on-year maintenance of the number of businesses collaborating |
▲ |
|
8. Growing the number of technology-related jobs to 1.2 million by 2030 |
Maintain trajectory to meet 1.2 million technology-related jobs by 2030 |
■ |
|
9. Delivering Questacon national STEM events that reach lower socio-economic, regional and remote communities |
50% of events reaching lower socio-economic communities and 60% of events reaching regional and remote communities |
◆ |
|
10. Raising awareness of the importance of STEM through the delivery of portfolio initiatives |
87% or more Australians (parents, educators and young Australians) consider STEM skills important when considering employment |
▲ |
|
11. Maintaining National Measurement Institute measurement services through third-party accreditations to meet national and international best practice |
Maintain:
|
◆ |
|
12. Increasing compliance with fair measure regulations through National Measurement Institute trader engagement |
Follow up trader audit compliance rate is higher than the initial trader audit compliance rate |
◆ |
|
13. Assuring the safety and security of civil space activities through regulation administered by the Australian Space Agency |
Zero fatalities, serious injuries or damage to other property as a result of authorised Australian space activities |
◆ |
|
14. Growing Australia’s critical minerals sector, including by supporting development of downstream processing capacity |
Year-on-year increase in the number, progress and total capital expenditure of critical minerals projects |
▲ |
|
15. Increasing opportunities for resources project investment |
Reframe any future Commonwealth offshore exploration acreage releases consistent with the government’s Future Gas Strategy |
▲ |
|
16. Assessing Offshore Petroleum and Greenhouse Gas Storage Act 2006 (OPGGS) applications through the National Offshore Petroleum Titles Administrator (NOPTA) |
90% of assessment timeframes met |
◆ |
|
17. Supporting radioactive waste disposal policy for Nuclear-Powered Submarines through Australian Radioactive Waste Agency advice |
Evidence-based advice provided on or before agreed timeframes |
◆ |
|
18. Decommissioning the Northern Endeavour and remediating the Laminaria-Corallina oil fields |
Progress towards completing Phase 1 decommissioning works by the expected vessel disconnection and towing window of 1 July 2025 to 30 September 2025, while ensuring safety and protection of the environment |
◆ |
Key: ◆ Achieved ▲ Partially achieved ■ Not achieved ● Other
Source: ANAO analysis of DISR’s annual performance statements (available from https://www.industry.gov.au/publications/annual-report-2024-25).
Department of Infrastructure, Transport, Regional Development, Communications, Sport and the Arts (DITRDCSA)
DITRDCSA’s purpose is ‘We work with our partners to enable connected, productive, safe, sustainable and culturally vibrant communities in our cities, regions and territories to improve the lives of Australians.’


DITRDCSA’s overall maturity was assessed as Embedded. Leadership and culture, governance, capability and reporting and records were rated as ‘Embedded.’ For the data and systems category, the department was assessed as baseline.
The ANAO noted that DITRDCSA could undertake more evaluation of whether programs are achieving the desired objectives. Regarding data and systems, the department’s sources of evidence would benefit from better documentation of quality assurance checks and processes to ensure data accuracy.
DITRDCSA 2024–25 closing position
|
A (significant) findings |
B (moderate) findings |
C (minor) findings |
|
0 |
0 |
3 |
DITRDCSA’s 2024–25 closing position contains three C findings relating to:
- the meaningfulness of several policy advice performance measures with an opportunity for the Department to develop more impactful and targeted measures;
- the descriptor of ‘met’ for several targets which has the potential to mislead readers. In 2024–25, four targets were described as ‘met’ notwithstanding that performance was below the target; and
- the need for further improvement in process documents.
|
Measure |
Target |
Result |
|
PM1: Policy advice on IIP Project Proposal Report(s) |
Policy advice is high quality, timely and evidence based |
◆ |
|
PM2: Assessment of milestone claims for payments on IIP projects (listed in the relevant tables in the Federation Funding Agreements (FFAs) |
100% of milestone claims received by the Department have been assessed, with accurate and complete claims authorised for payment |
◆ |
|
PM3: Shared oversight for the delivery of Commonwealth infrastructure projects in relation to:
|
The Department provides high quality, timely and evidence based advice to government |
▲ |
|
PM4: Policy advice relating to:
|
Policy advice is high quality, timely and evidence-based |
◆ |
|
PM5: Administration of regulatory functions for:
|
|
◆ |
|
PM6: Provide effective administration of surface transport and emissions program functions:
|
Programs are administered in accordance with program guidelines, ministerial directions and funding agreements |
◆ |
|
PM7: Administration of the Road Vehicle Standards (RVS) legislation |
|
◆ |
|
PM8: Delivery of non-infrastructure road safety grants programs to support the implementation of the National Road Safety Action Plan 2023–25 |
Non-infrastructure road safety grants programs support the priorities of the National Road Safety Action Plan 2023–25 and are delivered in line with the terms of individual grant agreements |
◆ |
|
PM9: Development and Environmental Assessment of Preliminary Flight Paths for Western Sydney International (Nancy-Bird Walton) Airport |
Publish the final Environmental Impact Statement (EIS), including the Public Submission Report in quarter 4, 2024 |
◆ |
|
PM10: Percentage of Master Plans and Major Development Plans (MDP) processed for leased federal airports within statutory timeframes |
100% of Master Plans and MDPs are assessed and submitted to the Minister with sufficient time for consideration and decision within statutory timeframes in each financial year |
◆ |
|
PM11: Performance of the Regional Airports Program (RAP) and the Remote Airstrip Upgrade (RAU) Program |
RAP and RAU projects are completed in line with their funding agreements |
◆ |
|
PM12: The number of per- and poly fluoroalkyl substances (PFAS) investigations undertaken at civilian airports |
Execution of contracts to undertake PFAS investigations at 22 civilian airports |
■ |
|
PM13: Contribute to maintain or reduce the number of aviation fatalities per 100,000 people for current year’s 10-year average |
The 10-year average of annual aviation fatalities per 100,000 people is maintained or reduced |
◆ |
|
PM14: Policy advice supporting aviation safety |
Policy advice is high quality, timely and evidence-based |
◆ |
|
PM15: Delivery of the regional Precincts and Partnerships Program (rPPP) within agreed timeframes |
Payments to states and territories are authorised in alignment with the schedule to the Federation Funding Agreement — Infrastructure |
◆ |
|
PM16: Percentage of Regional Development Australia (RDA) Committees achieving agreed outcomes as demonstrated by:
|
≥ 90% of RDAs rated satisfactory or above |
◆ |
|
PM17: Policy advice on regional development and local government |
Policy advice is high quality, timely and evidence-based |
▲ |
|
PM18: Financial assistance is provided to local government in accordance with the Local Government (Financial Assistance) Act 1995 consisting of:
|
Funding is provided on time and aligned with the budget appropriation |
◆ |
|
PM19: Policy advice on Brisbane 2032 Olympic and Paralympic venue infrastructure projects |
Policy advice is high quality, timely, and evidence-based |
▲ |
|
PM20: Approval of Brisbane 2032 Olympic and Paralympic venue infrastructure project milestones in line with the Federation Funding Agreement (FFA) schedule |
≥ 90% of compliant milestones submitted by Queensland are approved within the FFA timeframe |
◆ |
|
PM21: Delivery of the urban Precincts and Partnerships Program (uPPP) within agreed timeframes |
Payments to states and territories are authorised in alignment with the schedule to the FFA — Infrastructure |
◆ |
|
PM22: Delivery of the Thriving Suburbs Program to support investment in community infrastructure |
Payments to states and territories are authorised in alignment with the schedule to the FFA — Infrastructure |
◆ |
|
PM24: Percentage of Northern Australia Infrastructure Facility (NAIF) proposal notices received within the financial year processed for Ministerial consideration within statutory timeframes |
100% of proposal notices received within the financial year are processed within statutory timeframes |
◆ |
|
PM25: Advice on governance and legislative arrangements in Australia’s Territories |
Policy advice is high quality, timely and evidence-based |
▲ |
|
PM26: Availability of key services in the non-self-governing Territories |
Active agreements are in place for the delivery of health, education and corrections services in the non-self-governing Territories |
◆ |
|
PM27: Total amount of new and improved mobile coverage delivered through the Mobile Black Spot Program and the Peri-Urban Mobile Program |
For each program ≥90% of total contracted coverage (i.e. combined total of new and improved handheld coverage) is delivered by assets for which asset completion reports are received and approved in the financial year |
◆ |
|
PM28: Total amount of new or improved contracted outcomes delivered through the Regional Connectivity Program |
≥ 90% of total contracted outcomes (i.e. new and improved coverage, or relevant key service improvement metric) are delivered by assets for which completion reports are received and approved in the financial year |
◆ |
|
PM29: Accessible communication services for Australians, through:
|
|
▲ |
|
PM30: Policy advice on the regulatory and legislative framework for spectrum management, broadband and other telecommunications matters |
Policy advice is high quality, timely and evidence-based |
▲ |
|
PM31: Policy advice about the news, broadcasting and media industry |
Policy advice is high quality, timely and evidence-based |
◆ |
|
PM32: Policy advice about harmful online and digital content and activities |
Policy advice is high quality, timely and evidence-based |
▲ |
|
PM33: Contribute to the delivery of actions within Revive, the National Cultural Policy 2023–2027 |
50% of the 54 Revive actions and components held by the Office for the Arts delivered |
◆ |
|
PM34: Administered grants are paid within a timely manner |
90% of payments are paid within 20 days from the receipt of a correctly rendered invoice |
◆ |
|
PM35: Participation in weekly sport and physical activity as measured through:
|
|
● (baseline set) |
|
PM36: Strategic coordination of Commonwealth responsibilities in relation to the planning and delivery of the following future international major sporting events in Australiaa |
Event planning:
|
◆ |
Key: ◆ Achieved ▲ Partially achieved ■ Not achieved ● Other
Note a: These measures transferred from the Department of Health, Disability and Ageing to the Department of Infrastructure, Transport, Regional Development, Communications, Sport and the Arts during the 2024–25 reporting year as a result of machinery of government changes.
Source: ANAO analysis of DITRDCSA’s annual performance statements (available from https://www.infrastructure.gov.au/about-us/corporate-reporting/annual-reports).
Department of Parliamentary Services (DPS)
DPS’s purpose is ‘DPS provides professional support, advice and facilities to Parliament and parliamentarians independently of the Executive Government of the Commonwealth. We are focused on supporting the work of the Australian Parliament by providing effective, high quality and sustainable services to parliamentarians and building occupants.’


DPS’s overall maturity was assessed as Embedded. Leadership and culture, governance and capability were assessed as ‘Embedded.’ Data and systems and reporting and records were rated as ‘Baseline.’
In relation to data and systems, the ANAO found that quality assurance documentation could be improved, and that for several systems there was no evidence of integrity testing. For reporting and records, the ANAO noted an absence of information regarding the efficiency of operations.
DPS 2024–25 closing position
|
A (significant) findings |
B (moderate) findings |
C (minor) findings |
|
0 |
1 |
3 |
Source: ANAO
DPS’ 2024–25 closing position contains:
- a B finding relating to the need for documented processes to ensure that performance measures are based on reliable and verifiable methods and data sources and an unbiased basis for assessment;
- a C finding relating to the limited coverage of measures within key activity 4;
- a C finding relating to limitation in the design and construct of three measures across two key activities; and
- a C finding relating to the lack of systematic testing or quality assurance processes to ensure that system-generated reports are fit for their intended purpose.
|
Measure |
Target |
Result |
|
90% |
◆ |
|
85% |
■ |
|
85% |
■ |
|
90% |
◆ |
|
85% |
◆ |
|
90% |
◆ |
|
85% |
◆ |
|
85% |
◆ |
|
85% |
◆ |
|
85% |
◆ |
|
Effective |
◆ |
|
100% |
◆ |
|
100% |
◆ |
Key: ◆ Achieved ▲ Partially achieved ■ Not achieved ● Other
Source: ANAO analysis of DPS’ annual performance statements (available from https://www.aph.gov.au/About_Parliament/Parliamentary_departments/Department_of_Parliamentary_Services/Publications/Annual_Reports).
Department of the Prime Minister and Cabinet (PM&C)
PM&C’s purpose is ‘to support the Prime Minister, the Cabinet, and our portfolio ministers to improve the lives of all Australians, including through coordination of government activities and effective advice.’
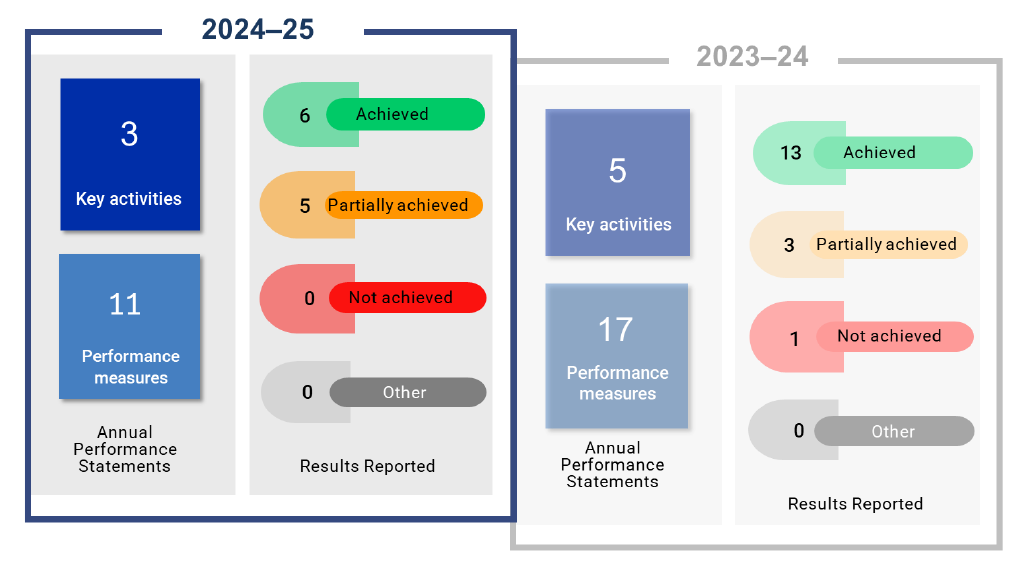
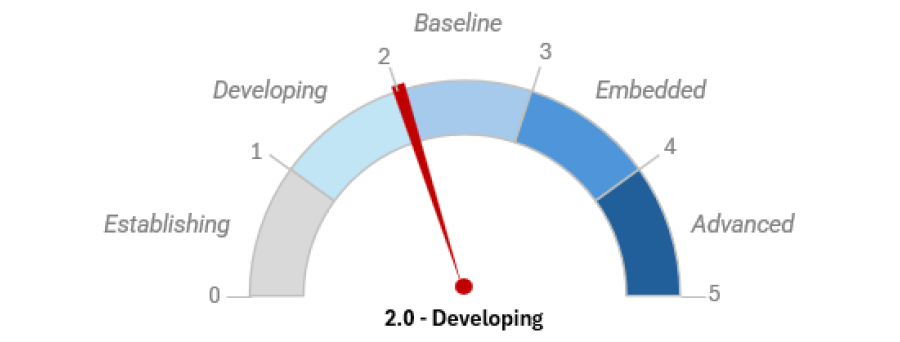
M&C’s overall maturity was assessed as Developing. Leadership and culture, governance and data and systems were rated as ‘Developing.’ Capability and reporting and records received a ‘Baseline’ assessment.
The ANAO wrote that it was important for the department’s Executive Board and its Performance and Risk Committee to take an active role in reviewing and endorsing key artefacts to plan and report performance information. The ANAO also recommended the department develop its data maturity as a matter of good governance.
PM&C 2024–25 closing position
|
A (significant) findings |
B (moderate) findings |
C (minor) findings |
|
0 |
2 |
2 |
Source: ANAO
PM&C’s 2024–25 closing position contains:
- a B finding relating to the lack of an established basis through which PM&C can plan and establish that its key activities and performance measures are ‘complete’ to report on the achievement of its purposes;
- a B finding relating to the need for established processes to establish balanced analysis and narrative in the Department’s performance statements;
- a C finding that highlights the need to report on the contribution of the Office for Women against defined medium and long-term goals; and
- a C finding relating to the late preparation of performance measure methodologies.
|
Measure |
Target |
Result |
|
1.1 Percentage of key stakeholders that are satisfied with PM&C’s advice |
77% |
◆ |
|
1.2 Percentage of ministerial briefs provided within agreed timeframes |
80% |
▲ |
|
1.3 Percentage of incoming ministerial correspondence triaged and assigned for appropriate action within 5 working days |
95% |
▲ |
|
2.1 Percentage of key stakeholders satisfied with the coordination and support provided by PM&C in the delivery of government priorities |
77% |
▲ |
|
2.2 Percentage of key stakeholders satisfied with the coordination and support provided for international engagements |
77% |
▲ |
|
2.3 PM&C’s coordination and reporting arrangements are effective in driving successful implementation of the government’s Working for Women: A Strategy for Gender Equality |
Publication of baseline data report |
◆ |
|
2.4 PM&C effectively supports Commonwealth-State relations |
77% |
◆ |
|
2.5 PM&C effectively supports Secretaries Board meetings |
As outlined in the Secretaries Board Terms of Reference |
▲ |
|
2.6 Annual review of the Australian Government Crisis Management Framework is undertaken in consultation with Australian Government agencies to ensure it remains fit-for-purpose |
Annual updates released on time |
◆ |
|
3.1 Percentage of key stakeholders satisfied with PM&C’s support to the Cabinet and its committees |
77% |
◆ |
|
3.2 PM&C provides effective support to the Cabinet and its committees |
Effective secretariat support is provided |
◆ |
Key: ◆ Achieved ▲ Partially achieved ■ Not achieved ● Other
Source: ANAO analysis of PM&C’s annual performance statements (available from https://www.pmc.gov.au/resources/department-prime-minister-and-cabinet-annual-report-2024-25).
Department of Social Services (DSS)
The purpose of DSS is ‘to improve the economic and social wellbeing of individuals, families and vulnerable members of Australian communities.’

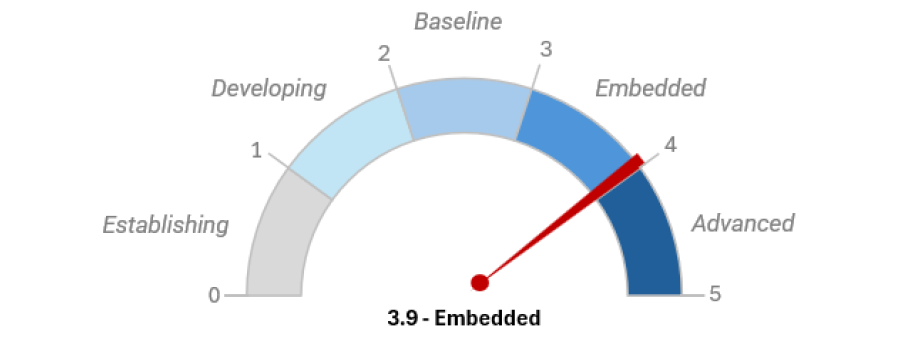
DSS’ overall maturity was assessed as Embedded. Leadership and culture, governance, and capability were rated as ‘Advanced’. Data and systems and reporting and records were rated as ‘Embedded.’
DSS’ performance framework is well established and implemented effectively. The ANAO wrote that work could be done to ensure the department’s program profiles are developed at the beginning of each reporting period. Reporting could also be improved by program areas accessing the expertise of the Data and Evaluation Division.
DSS 2024–25 closing position
|
A (significant) findings |
B (moderate) findings |
C (minor) findings |
|
0 |
1 |
1 |
Source: ANAO
DSS’ 2024–25 closing position contains:
- a B finding relating to the Our Watch component of the Women’s Safety measure, noting that a result for Our Watch will not be reported in 2024–25 and that DSS is working towards developing a more meaningful performance measure; and
- a C finding relating to the reliability and verifiability of data and methods for the Enhanced Income Management measure.
|
Measure |
Target |
Result |
|
1.1.1-1 Extent to which families with lower incomes are supported with the costs of raising children through Family Tax Benefit |
1.1.1-1A Payment targeted to low income families (67% of support received by families under the FTB lower income free area). |
■ |
|
1.1.2-1 Extent to which separated parents in the child support system are supporting their children |
1.1.2-1A At least 85% of Family Tax Benefit Part A children of separated parents meet the maintenance action test requirements |
■ |
|
1.2.1-1 Extent to which eligible families use their unreserved entitlement to Paid Parental Leave |
1.2.1-1A At least 95% of eligible Paid Parental Leave families receive payment |
◆ |
|
1.3.1-1 Extent to which people over the Age Pension qualification age are supported in their retirement through the Age Pension or other income support |
1.3.1-1A 75% or below of people of Age Pension age are supported by the Age Pension or other income support |
◆ |
|
1.4.1-1 Extent to which people of working age with a profound or severe disability are paid Disability Support Pension |
1.4.1-1A At least 90% of people with a profound or severe disability of working age are supported by the Disability Support Pension |
■ |
|
1.5.1-1 Extent to which payments are made to, or with respect to, carers unable to fully support themselves |
1.5.1-1A At least 70% of primary carers in Australia are supported by Carer Payment and/or Carer Allowance |
■ |
|
1.6.1-1 Extent to which payments are made to, or with respect to, people unable to fully support themselves |
1.6.1-1A Recipient numbers reflect the number of people who are unable to fully support themselves through work |
▲ |
|
1.7.1-1 Extent to which payment recipients have improved financial self-reliance |
1.7.1-1A The proportion of Austudy, Youth Allowance and ABSTUDY recipients who are not receiving income support 12 months after exiting student payments reflect the number of people who are able to fully support themselves through work |
◆ |
|
1XP.1-1 Australians receiving income support or family assistance payments are assisted with the cost of private rental or community housing |
1XP.1-1A Commonwealth Rent Assistance (CRA) reduces the proportion of recipient households in “rental stress” by at least 25 percentage points |
◆ |
|
2.1.1-1 Extent to which individuals have improved individual and family functioning |
2.1.1-1A - At least 75% of clients in reporting services have improved family functioning |
■ |
|
2.1.2-1 Successful implementation of DSS-led initiatives under the National Plan to End Violence against Women and Children 2022-2032 |
2.1.2-1A - Demonstrated achievement of continued successful delivery of initiatives under the National Plan to End Violence against Women and Children 2022-2032 |
◆ |
|
2.1.5-1 Extent to which individuals and families can navigate through financial crises, build financial resilience and reduce vulnerability to financial shock |
2.1.5-1A - 20% or less of people with multiple requests for Emergency Relief |
◆ |
|
2.1.5-1B - At least 70% of people report an improvement in their financial wellbeing following engagement with a funded service |
■ |
|
|
2.1.5-2 Participants on Enhanced Income Management in non-remote areas have food expenditure of a similar proportion to the food spend weighting in the Australian Bureau of Statistics’ Pensioner and Beneficiary Living Cost Index as part of the Selected Living Costs Index |
2.1.5-2A – Non-remote Enhanced Income Management participant proportional spend on food is within 5 percentage points of the food spend weighting in the ABS Pensioner and Beneficiary Living Cost Index as part of the Selected Living Costs Index |
◆ |
|
2.1.7-1 Ensure quality and timely decisions are made on applications to the Scheme |
2.1.7-1A - The Scheme will notify at least 75% of survivors about an outcome within 6 months of the date that all required information is received. |
■ |
|
2.1.7-1B - The Scheme will maintain quality decision-making, with at least 95% of initial determinations reflecting the final outcome |
◆ |
|
|
2.1.7-2 Maximise institution participation with the Scheme |
2.1.7-2A - The Scheme will engage and maintain participation, with institutions on board to cover at least 95% of applications in progress. |
◆ |
|
2.1.7-3 Provide survivors a redress payment |
2.1.7-3A - The Scheme will issue at least 80% of eligible survivors an advance payment within 7 days of receiving acceptance documentation |
◆ |
|
2.1.7-3B - The Scheme will issue at least 80% of survivors a redress payment within 14 days of receiving acceptance documentation. |
◆ |
|
|
3.1.1-1 Extent to which people with disability are supported to find and maintain employment through Disability Employment Services |
3.1.1-1A - At least 40% of job placements sustained to 13 weeks |
◆ |
|
3.1.1-1B - At least 30% of job placements sustained to 26 weeks |
◆ |
|
|
3.1.1-1C - At least 20% of job placements sustained to 52 weeks |
◆ |
|
|
CO-1 Timeliness of advice and support provided to Portfolio Ministers and Assistant Ministers by the department across the 4 outcomes |
CO-1A At least 95% of ministerial briefs and correspondence across the 4 outcomes are provided on time. |
■ |
|
CO-2 Proportion of grant applicants and recipients satisfied with their Hub grant experience |
CO-2A Grant applicant and recipient experience is 70% positive or above |
◆ |
Key: ◆ Achieved ▲ Partially achieved ■ Not achieved ● Other
Source: ANAO analysis of DSS’ annual performance statements (available from https://www.dss.gov.au/annual-reports/resource/department-social-services-annual-report-2024-25)
Department of the Treasury (Treasury)
Treasury’s purpose is ‘We provide advice to the government and implement policies and programs to achieve strong and sustainable economic and fiscal outcomes for Australians.’
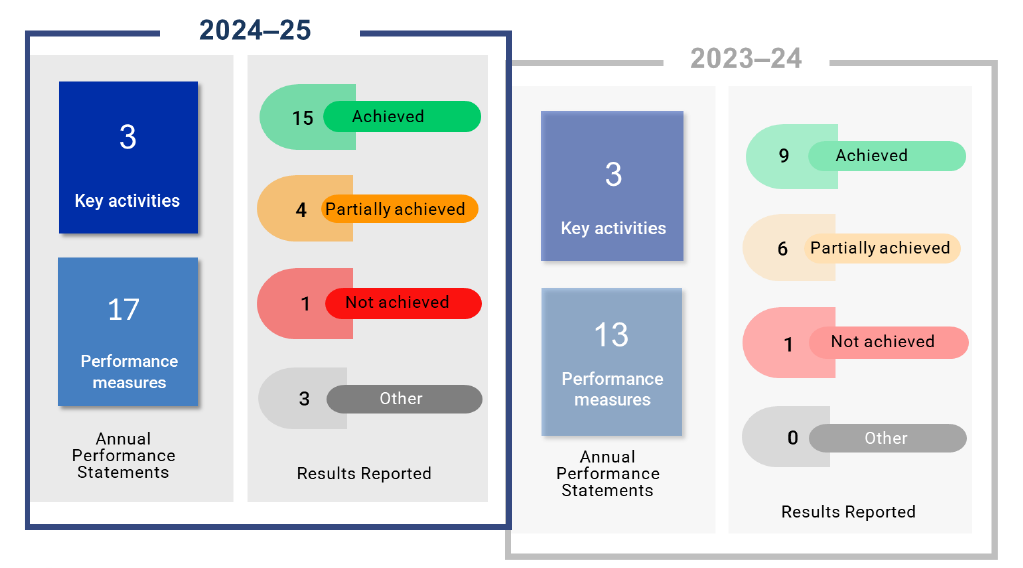
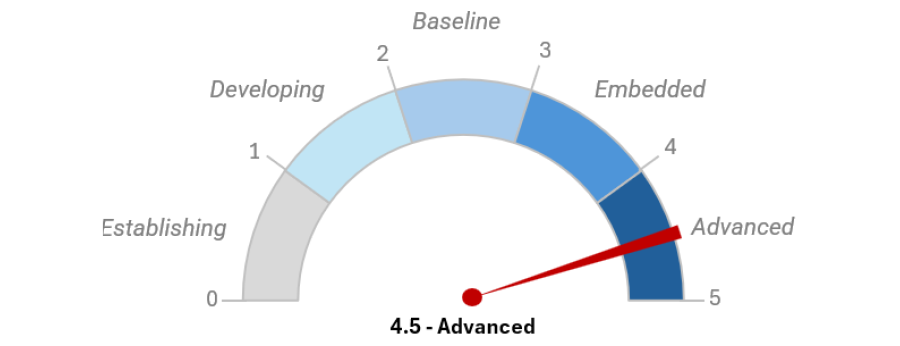
Treasury’s overall maturity was assessed as Advanced. The department was rated as ‘Advanced’ against all maturity categories.
Treasury’s Executive Board actively reviews performance reporting processes and uses performance reporting as a tool to discuss entity impact. The ANAO saw room for improvement in the department’s embedding of quality assurance into all data sources and advancing IT capabilities toward automation and analytics.
Treasury 2024–25 closing position
|
A (significant) findings |
B (moderate) findings |
C (minor) findings |
|
0 |
0 |
0 |
Source: ANAO
Treasury had no findings at the end of the 2024–25 audit.
|
Measure |
Target |
Result |
|
1 Proportion of Treasury ministers, key government entities and stakeholders that rate Treasury advice highly |
Ministerial feedback questionnaire: 83% |
◆ |
|
Stakeholder survey: 80% |
◆ |
|
|
2 Variance between actual real Gross Domestic Product (GDP) and forecast real GDP. |
Real GDP falls within 70% confidence interval of forecast real GDP |
◆ |
|
3 Variance between actual total tax receipts (excluding company tax) and forecast. |
Total tax receipts (excluding company tax) for 2024–25 falls within 70% confidence interval of forecast at the 2024–25 Budget |
◆ |
|
4 Delivered in line with the requirements of the Charter of Budget Honesty Act 1998 (Charter) |
100% |
◆ |
|
5 Australia maintains or improves its 2022 score on markets related inputs to the World Competitiveness Ranking produced by the Institute for Management Development |
Competitiveness score ≥105 |
▲ |
|
6 No disorderly failures of institutions prudentially regulated in Australia |
No disorderly failures of prudentially regulated institutions |
◆ |
|
7 Treasury contributes to the development of the Organisation for Economic Co-operation and Development Inclusive Framework on Base Erosion and Profit Shifting Action 1. |
Australia implements legislation to give domestic effect to the undertaxed payments rule under Pillar Two in accordance with the progress and timelines of the OECD (subject to government decision to implement the Pillars) |
◆ |
|
8 Proportion of legislative measures committed for delivery at the beginning of a parliamentary sitting period, adjusted for any government reprioritisation of legislative measures during the sitting period, and compared to the actual number delivered |
91% |
◆ |
|
9 Proportion of stakeholders that report a high level of satisfaction regarding: the clarity, transparency, and consistent application of Treasury’s regulatory frameworks risk-based, data driven decision making Treasury’s responsive communication and collaboration |
65% (Foreign Investment Framework) |
▲ |
|
65% (Payment Times Reporting Scheme) |
▲ |
|
|
11 Proportion of Treasury ministers, Treasury portfolio agencies and regulators, and key stakeholders that highly rate working with the Treasury |
Ministerial feedback questionnaire: 83% |
◆ |
|
Stakeholder survey 80% |
◆ |
|
|
12 Proportion of payments to international financial institutions are transferred within legislated requirements and agreements |
100% |
◆ |
|
13 Proportion of payments to the states are delivered within requirements of the Intergovernmental Agreement on Federal Financial Relations and other relevant agreements between the Commonwealth and the states |
100% |
▲ |
|
Performance measure 23: Advice on Australian cities policya |
Policy advice is high quality, timely and evidence-based |
◆ |
|
2.1.2-1 Confirmation a funded Safe Places project(s) activity details have been completed (i.e. capital works/building phase completed) and is tenantedb |
The success criterion is met if the total number of safe places delivered is greater than or equal to the prior year’s target. ≥ 713 |
■ |
|
4.1.1 All parties to the NASHH meet its requirementsb |
4.1.1-1A – a publicly available housing and homelessness strategy that meets the requirements outlined in the NASHH from each state |
◆ |
|
4.1.1-1B – complete and timely reporting by the states against the compulsory measures in the National Outcomes Framework on social housing measures, including number and change in social housing dwellings, overcrowding and dwelling condition |
● |
|
|
4.1.1-1C – complete and timely reporting by the states against the compulsory measures in the National Outcomes Framework on homelessness, including unmet demand and supported requests for homelessness services, and return to homelessness |
● |
|
|
4.1.1-1D – complete and timely reporting by the states against the Statement of Assurance |
● |
|
|
4.2.1-1 Incentives are issued in a timely manner to approved participantsb |
4.2.1-1A - At least 90% of statements of compliance are processed within 60 business days |
◆ |
|
4.2.1-2 Incentives delivered through the National Rental Affordability Scheme are maximised to improve the supply of affordable rental housing to low and moderate income householdsb |
4.2.1-2A - At least 90% of allocations set under the National Rental Affordability Scheme are active and receiving incentive payments |
◆ |
Key: ◆ Achieved ▲ Partially achieved ■ Not achieved ● Other
Note a: This measure transferred from the Department of Infrastructure, Transport, Regional Development, Communications, Sport and the Arts to the Department of the Treasury during the 2024–25 reporting year as a result of machinery of government changes.
Note b: These measures transferred from the Department of Social Services to the Department of the Treasury during the 2024–25 reporting year as a result of machinery of government changes.
Source: ANAO analysis of Treasury’s annual performance statements (available from https://treasury.gov.au/publication/p2 025-710797).
Department of Veterans’ Affairs (DVA)
DVA’s purpose is ‘to support the wellbeing of those who serve or have served in the defence of our nation, and their families, by:
- partnering with organisations and individuals to help design, implement and deliver effective policies, programs and benefits, which enhance the wellbeing of veterans and veteran families
- providing and maintaining war graves and delivering meaningful commemorative activities to promote community recognition and understanding of the service and sacrifice of veterans.’
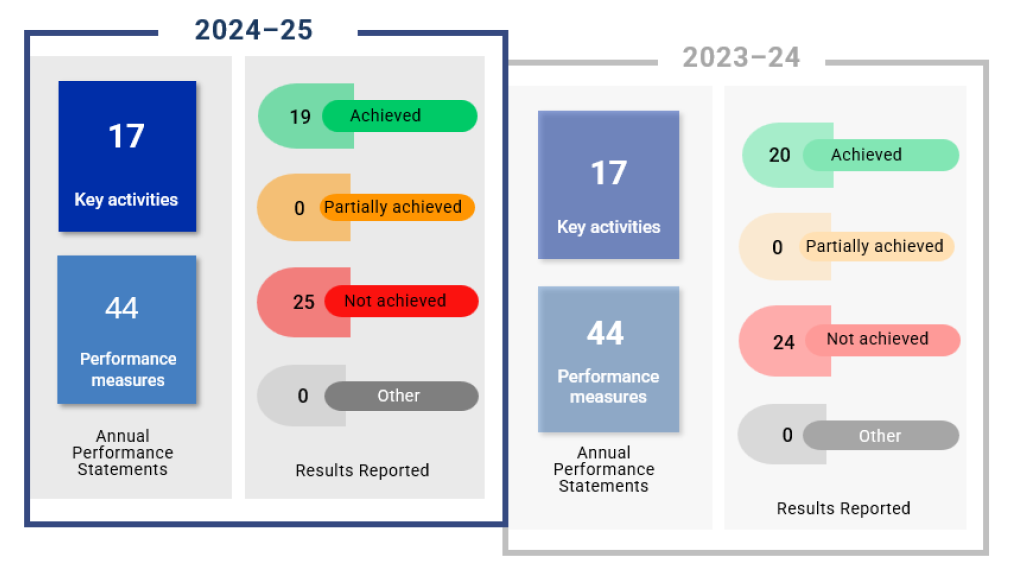
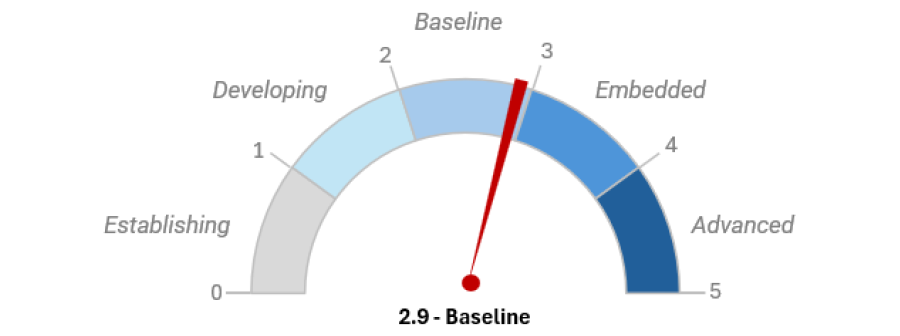
DVA’s overall maturity was assessed as Baseline. Leadership and culture was rated as ‘Embedded.’ A ‘Baseline’ assessment was given for governance, data and systems, capability, and reporting and records.
The ANAO acknowledged executive-led changes to performance information, to simplify measures and make them more meaningful. The ANAO recommended a more shared understanding of data roles and responsibilities across the entity. Documents relating to methodology and supporting information were also assessed as needing improvement.
DVA 2024–25 closing position
|
A (significant) findings |
B (moderate) findings |
C (minor) findings |
|
1 |
2 |
2 |
Source: ANAO
DVA’s 2024–25 closing position contains:
- an A finding relating to limitations with the War Graves performance measures. For one of the two measures, testing confirmed that inherent issues with the War Graves System continue to impact data reliability and verifiability;
- a B finding highlighting several deficiencies with processes to calculate and quality assure the result for measure 1.4-4 on compliance with the General Insurance Code of Practice;
- a B finding highlighting several deficiencies in methodology documents across nearly all performance measures, including inaccurate and incomplete information, methodologies that were not confirmed at the start of the reporting period, and a lack of detail on programs, transaction and business processes;
- a C finding for DVA being unable to demonstrate how it gains assurance over the completeness of datasets underpinning some measures; and
- a C finding identifying instances where, for the timeliness measures in Outcome 1, documentation did not match system records.
|
Measure |
Target |
Result |
|
1.1-1 Timeliness: The percentage of claims processed within 30 days (Veterans’ income support and allowances) |
≥50% |
◆ |
|
1.1-2 Timeliness: The percentage of change of circumstances processed within 10 days (Veterans’ income support and allowances) |
≥50% |
◆ |
|
1.1-3 Quality: Correctness rate of processed new claims (Veterans’ income support and allowances) |
≥95% |
■ |
|
1.1-4 Quality: Correctness rate of processed change of circumstances (Veterans’ income support and allowances) |
≥95% |
◆ |
|
1.1-5 Client satisfaction (Income Support): The percentage of clients satisfied with the level of customer service they received when accessing their entitlement |
≥80% |
■ |
|
1.2-1 Timeliness: The percentage of claims processed within 100 days (Veterans’ Disability Support) |
≥50% |
■ |
|
1.2-2 Quality: Correctness rate of processed claims (Veterans’ Disability Support) |
≥95% |
■ |
|
1.2-3 Client satisfaction (Disability Support): The percentage of clients satisfied with the level of customer service they received when accessing their entitlement |
≥80% |
■ |
|
1.3-1 Timeliness: The percentage of claims processed within 30 days (Assistance to Defence Widow/ers and Dependants) |
≥50% |
■ |
|
1.3-2 Quality: Correctness rate of processed claims (Assistance to Defence Widow/ers and Dependants) |
≥95% |
◆ |
|
1.3-3 Client satisfaction (War Widows): The percentage of clients satisfied with the level of customer service they received when accessing their entitlements |
≥80% |
◆ |
|
1.4-1 Timeliness: The percentage of claims processed within 10 days (Funeral benefits) |
≥50% |
◆ |
|
1.4-2 Quality: Correctness rate of processed claims (Funeral benefits) |
≥95% |
■ |
|
1.4-3 Client satisfaction (Funeral Benefits): The percentage of clients satisfied with the level of customer service they received when accessing their entitlements |
≥80% |
◆ |
|
1.4-4 Quality: DSH Insurance complies with/meets the requirements of the 2020 General Insurance Code of Practice |
≥90% |
◆ |
|
1.5-1 Timeliness: The percentage of claims processed within 28 days (Veterans’ Children Education Scheme) |
≥50% |
■ |
|
1.5-2 Quality: Correctness rate of processed claims (Veterans’ Children Education Scheme) |
≥95% |
■ |
|
1.6-1 Timeliness: The percentage of DRCA liability claims processed (determined) within 100 days |
≥50% |
■ |
|
1.6-2 Timeliness: The percentage of DRCA permanent impairment claims processed (determined) within 100 days |
≥50% |
■ |
|
1.6-3 Timeliness: The percentage of DRCA incapacity claims processed (determined) within 50 days |
≥50% |
■ |
|
1.6-4 Quality: Correctness rate of processed DRCA liability claims |
≥95% |
■ |
|
1.6-5 Quality: Correctness rate of processed DRCA permanent impairment claims |
≥95% |
■ |
|
1.6-6 Quality: Correctness rate of processed DRCA incapacity claims |
≥95% |
■ |
|
1.6-7 Timeliness: The percentage of MRCA liability claims processed (determined) within 90 days |
≥50% |
■ |
|
1.6-8 Timeliness: The percentage of MRCA permanent impairment claims processed (determined) within 90 days |
≥50% |
■ |
|
1.6-9 Timeliness: The percentage of MRCA incapacity claims processed (determined) within 50 days |
≥50% |
■ |
|
1.6-10 Quality: Correctness rate of processed MRCA liability claims |
≥95% |
■ |
|
1.6-11 Quality: Correctness rate of processed MRCA permanent impairment claims |
≥95% |
■ |
|
1.6-12 Quality: Correctness rate of processed MRCA incapacity claims |
≥95% |
■ |
|
1.6-13 Client satisfaction (Safety, Rehabilitation and Compensation – DRCA and MRCA): The percentage of clients satisfied with the level of customer service they received when accessing their entitlements |
≥80% |
■ |
|
2.1-1 Quality of service: The proportion of clients who have registered a complaint in relation to unmet access and/or quality compared to the total number of clients accessing services (General Medical Consultations and Services) |
<1% |
◆ |
|
2.2-1 Quality of service: The proportion of clients who have registered a complaint in relation to unmet access and/or quality compared to the total number of clients accessing services (Veterans’ Hospital Services) |
<1% |
◆ |
|
2.3-1 Quality of service: The proportion of clients who have registered a complaint in relation to unmet access and/or quality compared to the total number of clients accessing services (Veterans’ Pharmaceutical Benefits) |
<1% |
◆ |
|
2.4-1 Quality of service: The proportion of clients who have registered a complaint in relation to unmet access and/or quality compared to the total number of clients accessing services (Veterans’ Community Care and Support) |
<1% |
◆ |
|
2.5-1 Quality of service: The proportion of clients who have registered a complaint in relation to unmet access and/or quality compared to the total number of clients accessing services (Veterans’ Counselling and Other Health Services) |
<1% |
◆ |
|
2.5-2 Timeliness: Target percentage of claims for reimbursement processed within 28 days (Veterans’ Counselling and Other Health Services) |
≥95% |
■ |
|
2.5-4 Percentage of clients allocated to an Open Arms clinician within 2 weeks of initial intake |
≥65% |
◆ |
|
2.5-5 Client satisfaction (Veterans’ Counselling and Other Health Services) |
≥80% |
◆ |
|
2.6-1 Timeliness: The percentage of rehabilitation assessments completed within 30 days of assessment referral |
≥75% |
◆ |
|
2.6-3 Client satisfaction: An annual survey of client satisfaction with the rehabilitation program |
≥75% |
◆ |
|
3.1-1 Quality of service: New official commemorations are completed within published timeframes a |
≥75% |
■ |
|
3.1-3 Quality: Official commemorations are satisfactorily maintained to recognise the service and sacrifice of veterans |
Less than 10 complaints regarding the maintenance of any official commemoration |
■ |
|
3.2-1 Commemorative event quality: Commemorative events are conducted to commemorate veterans’ service in a dignified, solemn and respectful manner |
The number of discrete complaints is less than 1% of the estimated audience for any one event |
◆ |
|
3.2-2 Increase the public’s understanding and awareness of the service and sacrifice of those who have served Australia in wars, conflicts and peace operations |
Increased engagement with the Anzac portal |
◆ |
Key: ◆ Achieved ▲ Partially achieved ■ Not achieved ● Other
Note a: This measure was the basis for a qualified audit conclusion.
Source: ANAO analysis of DVA’s annual performance statements (available from https://www.dva.gov.au/documents-and-publications/annual-reports)
National Disability Insurance Agency (NDIA)
NDIA’s purpose is to ‘improve the independence, and the social and economic participation of eligible people with disability through the management of a financially sustainable National Disability Insurance Scheme with proper, efficient and effective use of resources.’


NDIA’s overall maturity was assessed as Baseline. Leadership and culture and reporting and records were rated as ‘Embedded.’ Governance, data and systems and capability all received a ‘Baseline’ rating.
The ANAO observed an improvement in the agency’s performance reporting processes. The ANAO noted there is an opportunity to further embed performance information to inform decision making. It also recommended developing a policy or processes to assess whether functions or programs are significant to NDIA in achieving its purposes.
NDIA 2024–25 closing position
|
A (significant) findings |
B (moderate) findings |
C (minor) findings |
|
2 |
0 |
2 |
Source: ANAO
The NDIA’s 2024–25 closing position contains two A findings relating to:
- the completeness of the NDIA’s performance information, given:
- the omission of information on fraud and payment non-compliance;
- the potential gap in information on participant perception of choice and control;
- the absence of efficiency measures; and
- the absence of a measure(s) to assess the effectiveness of early intervention supports;
- the appropriateness of performance measures. Measure 2.3 on participant Service Guarantee timeframes is subject to ongoing data availability issues. Measures 1.6 and 1.7 present a risk of bias due to late change in these targets. Measures 1.5 and 2.2 do not appear to measure the performance of the NDIA’s activities.
The NDIA’s 2024–25 closing position also contains two C findings relating to the need to further progress the NDIA’s enterprise-wide performance reporting framework and performance measure methodologies.
|
Measure |
Target |
Result |
|
1.1 Participant employment rate |
26% |
■ |
|
1.2 Participant social and community engagement rate |
46% |
■ |
|
1.3 Participant satisfaction |
76% |
■ |
|
1.4 Participant satisfaction with progress toward their goals |
70% |
■ |
|
1.5 Participants with Community and/or Mainstream supports in their plans |
>90% |
◆ |
|
1.6 Average payment per participant |
$67,200 |
◆ |
|
1.7 Annualised Scheme growth rate |
12.00% |
◆ |
|
2.1 Staff with disability |
20% |
◆ |
|
2.2 Payments made within agreed timeframes |
>90% |
◆ |
|
2.3 PSG timeframes met 95% of the time |
80% |
■ |
|
2.4 Resolution on first call to National Contact Centre |
80% |
◆ |
|
2.5 Disclosure of NDIS Quarterly Reports to Disability Ministers within prescribed timeframes |
All quarterly reports provided to the ministerial council within legislative time frames |
◆ |
Key: ◆ Achieved ▲ Partially achieved ■ Not achieved ● Other
Source: ANAO analysis of NDIA’s annual performance statements (available from https://www.ndis.gov.au/publications/annual-report)
National Indigenous Australians Agency (NIAA)
NIAA’s purpose is that ‘the NIAA works in genuine partnership to enable the self-determination and aspirations of First Nations communities. It leads and influences change across government to ensure Aboriginal and Torres Strait Islander peoples have a say in the decisions that affect them.’

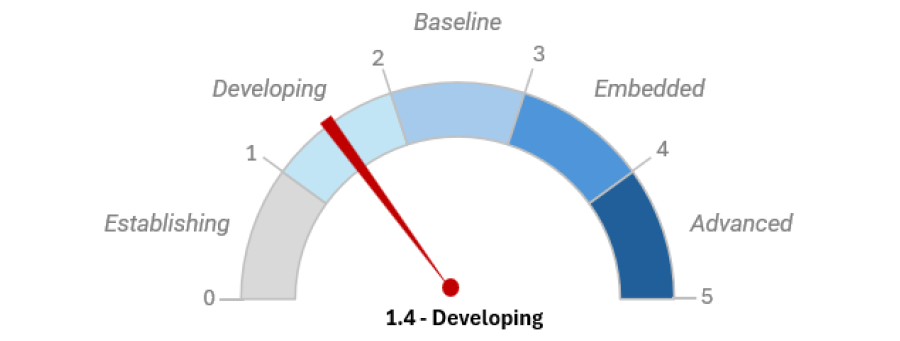
NIAA’s overall maturity was assessed as Developing. Leadership and culture, and governance were rated as ‘Baseline’. Data and systems, capability, and reporting and records were rated as ‘Developing.’
In the category of governance, the ANAO highlighted the need for improvements to methodology that would enable reperformance of calculations relevant to performance measure results. Methodology documents could be improved by featuring clearer and more precise descriptions of the processes related to data collection, data analysis, and assurance.
NIAA 2024–25 closing position
|
A (significant) findings |
B (moderate) findings |
C (minor) findings |
|
3 |
1 |
0 |
Source: ANAO
NIAA’s 2024–25 closing position contains three A findings relating to:
- the inadequate mix of measures under key activities 1 and 4, given the 2024–25 performance statements do not provide information about the outputs, effectiveness or efficiency of the NIAA’s partnerships and evaluation work;
- the omission of key functions and programs from the 2024–25 performance statements, including the promotion of reconciliation, Connect with Country, and the Central Australia Plan. These omissions resulted from the lack of a documented framework and assessment of materiality; and
- measures 3 and 4 which were assessed as not meeting the requirements of section 16EA of the PGPA Rule, while the mix of measures was assessed as not appropriate with an over-reliance on measures of input, activity and output (as above).
The NIAA’s 2024–25 closing position also contains a B finding relating to weaknesses in the NIAA’s performance statements preparation processes.
|
Measure |
Target |
Result |
|
Performance Measure 1: Proportion of Empowered Community regions that demonstrate progress in the development or implementation of Local Partnership Agreements |
100% of existing Empowered Community regions have refreshed Local Partnership Agreements in place by 30 June 2025 |
■ |
|
Performance Measure 2: The number of effective partnerships the NIAA is a party to |
Develop a register that provides a baseline data set of partnerships |
● (baseline set) |
|
Performance Measure 3: The NIAA delivers the National Agreement on Closing the Gap and implementation plan through partnerships and engagement with other Australian Government portfolios, First Nations representatives, and state, territory and local governments a |
|
▲ |
|
Performance Measure 4: The extent to which the NIAA contributes to effective implementation of the Australian Government’s Indigenous Procurement Policy (IPP) across the APSa |
|
▲ |
|
Performance Measure 5: Proportion of the NIAA’s investment through IAS grants that align with Closing the Gap outcomes and Priority Reforms |
100% of IAS grant investments contribute to Closing the Gap outcomes and Priority Reforms. |
▲ |
|
Performance Measure 6: Proportion of IAS program activities that are assessed by NIAA Agreement Managers as having core service delivery elements which meet or exceed requirements |
90% |
▲ |
|
Performance Measure 7: Portion of CDP participants that achieve a 26-week employment outcome |
4% or higher |
◆ |
|
Performance Measure 8: Percentage of applications under the Remote Jobs and Economic Development Program that are processed within 90 days |
80% |
◆ |
|
Performance Measure 9: Total number of jobs funded under the Remote Jobs and Economic Development Program |
930 jobs |
◆ |
|
Performance Measure 10: Maintain an up-to-date IAS Evaluation Work Plan on the NIAA website |
Minimum of 4 updates made to the Work Plan |
◆ |
|
Performance Measure 11: Proportion of completed IAS Evaluation Work Plan evaluations that are published within 6 months of a management response being accepted by the NIAA. |
100% of IAS Evaluation Work Plan evaluations completed in 2023 that are published in full or in summary within 6 months of a management response being accepted by the NIAA |
◆ |
Key: ◆ Achieved ▲ Partially achieved ■ Not achieved ● Other
Note a: These measures were the basis for a qualified audit conclusion.
Source: ANAO analysis of NIAA’s annual performance statements (available from https://www.niaa.gov.au/news-and-media/niaa-annual-report-2024-25)
Services Australia
Services Australia’s purpose is ‘To support Australians by efficiently delivering high-quality, accessible services and payments on behalf of government.’

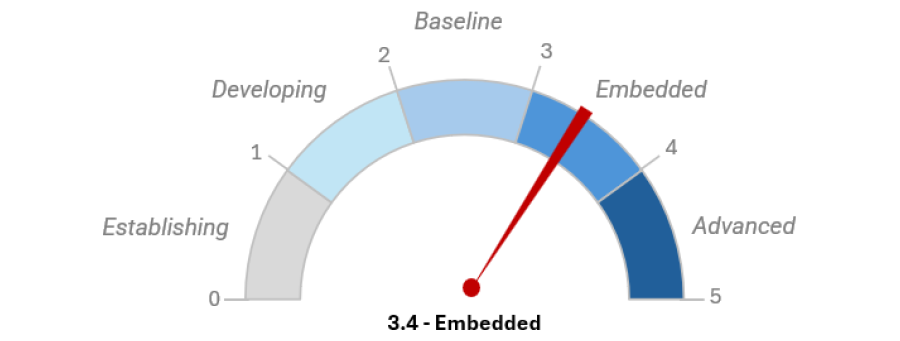
The overall maturity of Services Australia was assessed as Embedded. Leadership and culture was rated as ‘Advanced.’ Governance, capability, data and systems, and reporting and records were rated as ‘Embedded.’
The ANAO highlighted an opportunity for the agency to strengthen its collection and use of data for reporting and monitoring purposes. Governance arrangements should ensure timely updates to central areas regarding changes made to agreed service standards and other agreements. Service Australia’s process maps were highlighted as an exemplar of mapping for end-to-end processes and data flows.
Services Australia 2024–25 closing position
|
A (significant) findings |
B (moderate) findings |
C (minor) findings |
|
1 |
1 |
2 |
Source: ANAO
Services Australia’s 2024–25 closing position contains:
- an A finding relating to Services Australia’s inability to gain assurance over the telephony component of the result for one measure, and the need to ensure that new work types or changes to existing work types are accurately identified and reported for another measure;
- a B finding relating to the omission of adequate information on Services Australia’s regulatory functions;
- a C finding relating to the need to ensure that quality check results for one measure can be verified to the data source; and
- a C finding relating to the need for Services Australia to conduct a comprehensive review of the sampling rationale it uses for one measure.
|
Measure |
Target |
Result |
|
SPM1: Customer satisfaction |
>85 out of 100 |
▲ |
|
SPM 2: Customer trust |
>74 out of 100 |
◆ |
|
SPM 3: Administrative correctness of payments |
>98% |
◆ |
|
SPM 4: Customers served within 15 minutes |
>70% |
▲ |
|
SPM 5: Work processed within timeliness standards |
>90% |
◆ |
|
SPM 6: Availability of digital channels |
>99% |
◆ |
|
SPM 7: Customer interactions through digital services |
>83% |
◆ |
|
SPM 8: Cost per payment dollar administered |
N/A (set benchmark) |
● |
Key: ◆ Achieved ▲ Partially achieved ■ Not achieved ● Other
Source: ANAO analysis of Services Australia’s annual performance statements (available from https://www.servicesaustralia.gov.au/annual-report-2024-25?context=22)
Footnotes
1 Section 8 of the Public Governance, Performance and Accountability Act 2013 states that ‘proper, when used in relation to the use or management of public resources, means efficient, effective, economical and ethical’.
2 Public Governance, Performance and Accountability Act 2013, subsection 5(c)(ii).
3 ibid., Part 2-3, Division 3.
4 ibid, subsection 40(1).
5 This report draws a distinction between measures described in corporate plans and the results reported against each measure in annual performance statements. Some entities will use the flexibility provided by the Commonwealth performance framework to report multiple results against a performance measure. This means that the number of results reported in performance statements will not necessarily tally with the measure count based on an entity’s corporate plan. In 2024–25 there were 449 measures, which were reported as 504 results in the 21 audited performance statements.
6 Only four of the 449 measures reported by audited entities in 2024–25 are efficiency measures.
7 Reporting Meaningful Performance Information, ANAO, 29 June 2023, available from https://www.anao.gov.au/work/insights/reporting-meaningful-performance-information [accessed 27 November 2025]
8 Department of Finance, Developing performance measures (RMG 131), Finance, Canberra, 2025, available from https://www.finance.gov.au/government/managing-commonwealth-resources/developing-performance-measures-rmg--131 [accessed 3 December 2025] and Department of Finance, Corporate plans for Commonwealth entities (RMG 132), Finance, Canberra, 2025, available from https://www.finance.gov.au/government/managing-commonwealth-resources/corporate-plans-commonwealth-entities-rmg-132 [accessed 3 December 2025].
9 This includes any performance assessment that was below fully met, but more than not met. Terms used by entities variously included ‘mostly’ met, ‘substantially’ met, or ‘partially’ met. Some entities may report these as separate categories. For example, the Department of Infrastructure, Transport, Regional Development, Communications, Sport and the Arts reports four performance categories: ‘met’, ‘substantially met’, ‘partially met’ and ‘not met’. For the purposes of analysis and comparison between entities in this report, the ANAO has reflected all assessments below fully met, but more than not met, in this category.
10 In the assessment scale published in its 2024–25 Corporate Plan, the Department of the Prime Minister and Cabinet defined a result of 75% or greater to be ‘Achieved’. This scale was revised in its 2024–25 Annual Performance Statements.
11 Services Australia, Modernising our services, SA, Canberra, available from https://www.servicesaustralia.gov.au/sites/default/files/2022-09/modernising-our-services.pdf [accessed 4 November 2025]
12 Services Australia’s performance statements report performance against eight performance measures.
13 Across the six entities receiving a qualified audit conclusion in 2024–25, there were 18 performance results that were the basis for a qualified conclusion. This was due to misstatement, or circumstances where the ANAO was unable to obtain sufficient appropriate evidence to form a view on whether the results were misstated. This represents four per cent of all performance results reported in 2024–25 by the 21 audited entities. Misstatements in performance statements may arise from errors in reported results, issues with performance measure design, or omission of information.
14 The most common reason for being unable to assess performance against a target was that data was not available to support assessment.
15 Department of Finance, Developing performance measures (RMG 131), Finance, Canberra, 2025, available from https://www.finance.gov.au/government/managing-commonwealth-resources/developing-performance-measures-rmg--131 [accessed 25 November 2025].
16 In 2024–25, the Department of Veterans’ Affairs reported against 12 measures of the timeliness of claims processing by the department. The targets for all measures were set at meeting timeliness standards for 50 per cent of claims. For 2025–26, the department has revised these targets to 90 per cent of claims, a more challenging target that ‘[reflects] its commitment to meeting and exceeding claims timeframes set out by legislation or recommended by the Royal Commission’.
Source: Department of Veterans’ Affairs, Corporate Plan 2025–26, DVA, Canberra, 2025, available from https://www.dva.gov.au/sites/default/files/2025-08/dva-corporate-plan_2025-26.pdf [accessed 11 November 2025].
17 Some entities have performance frameworks recognising performance that ‘substantially’ or ‘partially’ meets targets.
18 Public Governance, Performance and Accountability Rule 2014, subsection 16EA(f)
19 Department of Finance, Developing performance measures (RMG 131), Finance, Canberra, 2025, available from https://www.finance.gov.au/government/managing-commonwealth-resources/developing-performance-measures-rmg--131 [accessed 4 November 2025].
20 A thirteenth performance measure reported in 2023–24 was not carried forward into 2024–25.
21 Services Australia, Annual Report 2024–25, Services Australia, Canberra, 2025, p. 24, available from https://www.servicesaustralia.gov.au/sites/default/files/2025-10/annual-report-2024-25.pdf [accessed 16 December 2025].
22 The Department of Home Affairs defined performance of 97.5 per cent of the published target and above as meeting the target. The Department of Infrastructure, Transport, Regional Development, Communications, Sport and the Arts defined performance of 95 per cent of the published target and above as meeting the target.
23 That is: Efficiency = (outputs ÷ inputs) x 100%. In a public sector context, efficiency is generally about obtaining the most benefit from available resources, that is, minimising inputs used to deliver the policy or other outputs in terms of quality, quantity, and timing.
Source: Department of Finance, Developing performance measures (RMG 131), Finance, Canberra, 2025, available from https://www.finance.gov.au/government/managing-commonwealth-resources/developing-performance-measures-rmg--131 [accessed 3 December 2025].
24 Measuring efficiency is a necessary component of assessing public sector productivity, but a comprehensive assessment also requires consideration of effectiveness, quality and outcome to determine whether activities are achieving their intended purposes and delivering public value.
25 Auditor-General Report No. 25 2024–25 Performance Statements Auditing in the Commonwealth — Outcomes from the 2023–24 Audit Program, ANAO, 2025, para 4.47, available from https://www.anao.gov.au/work/performance-statements-audit/performance-statements-auditing-the-commonwealth-outcomes-from-the-2023-24-audit-program [accessed 4 November 2025].
As noted recently by the Australian Public Service (APS) Commission, ‘APS agencies are examining how to achieve greater productivity in their operating environments. A key focus is better understanding the known drivers of productivity and performance.’ Australian Public Service Commission, State of the Service Report 2024–25, APSC, Canberra, 2025, p. 58, available from https://www.apsc.gov.au/sites/default/files/2025-11/APSC State of the Service Report 2024%E2%80%9325.pdf [accessed 27 November 2025].
26 The department’s audited financial statements for 2024–25 also showed an increase in the value of the provision for gross outstanding claims, indicating that the department anticipates continued growth in the value of future claims.
27 Across the 21 audited entities, 40 per cent of measures were classified as effectiveness measures.
28 The Treasury, Measuring What Matters, Treasury, 2023, available from https://treasury.gov.au/policy-topics/measuring-what-matters [accessed 14 August 2025].
29 The Department of Climate Change, Energy, the Environment and Water (DCCEEW), has several measures in its 2024–25 performance statements that reflect metrics under the ‘sustainable’ theme in the MWM framework. Apart from the Australian Bureau of Statistics, DCCEEW contributes the most data of any Commonwealth entity to the metrics in the MWM framework. See Auditor-General Report No. 34 2024–25 Treasury’s design and implementation of the Measuring What Matters Framework, Appendix 4..
30 Department of Veterans’ Affairs, Annual Report 2024–25, DVA, Canberra, 2025, pages 37–38, available from https://www.transparency.gov.au/publications/veterans-affairs/department-of-veterans-affairs/department-of-veterans-affairs-annual-report-2024-25 [accessed 4 November 2025].
31 Revised Explanatory Memorandum, Public Governance, Performance and Accountability Bill 2013, p. 13.
32 The Portfolio Budget Statements (PBS) are a key accountability tool. They specify the public resources proposed in the Budget to be available to an entity. They explain how the funding appropriated by Parliament will be used by government departments and agencies within each portfolio.
33 Revised Explanatory Memorandum, Public Governance, Performance and Accountability Bill 2013, p. 2 [17]
34 Tumuaki o te Mana Arotake | Controller and Auditor-General, The problems, progress and potential of performance information, Office of the Auditor-General, Wellington, October 2021, p. 5, available from https://oag.parliament.nz/2021/performance-reporting/docs/performance-reporting.pdf [accessed 16 December 2025].
35 To assist entities to report meaningful information, the ANAO published the Audit Insights product ‘Reporting Meaningful Performance Information’ in June 2023. The product is available from https://www.anao.gov.au/work/insights/reporting-meaningful-performance-information [accessed 3 November 2025].
36 Department of Finance, Commonwealth Performance Framework, Finance, Canberra, 2024, available from https://www.finance.gov.au/government/managing-commonwealth-resources/planning-and-reporting/commonwealth-performance-framework [accessed 6 January 2026].
37 The ANAO encourages entities to apply the concept of ‘materiality’ beyond just financial considerations. This helps entities to ensure that performance statements meet user needs by focusing measurement and reporting on the issues and outcomes that matter most to them.
38 Only including performance measures that directly link to an entity’s purposes or key activities may overlook the broader or longer-term changes the entity contributes to, especially when outcomes or impacts are influenced by multiple factors beyond its control. Given the challenge of attribution in the public sector, focusing solely on direct links can obscure the entity’s role in complex systems and limit understanding of its effectiveness. Including both directly and closely linked measures allows for a more realistic and comprehensive picture of performance, acknowledging contribution rather than requiring sole attribution.
39 Te Kāwai Ārahi Pūrongo Mōwaho | External Reporting Board, Public Benefit Entity Financial Reporting Standard 48 Service Performance Reporting (PBE FRS 48), XRB, Wellington, 2017, available from https://www.xrb.govt.nz/standards/accounting-standards/public-sector-standards/standards-list/pbe-frs-48/ [accessed 3 November 2025].
40 ibid., para IN3, p. 4.
41 ibid., para BC13, p. 16.
42 In 2022 the Australian Accounting Standards Board (AASB) reactivated a project on Service Performance Reporting (SPR). This project is currently in the research phase, in which it is conducting targeted stakeholder research as well as commissioning research. For the purpose of this research the New Zealand standard is the primary point of reference, subject to adaptation for the Australian context and consideration of other SPR-related frameworks.
43 Public Governance, Performance and Accountability Act 2013, subsection 5(c)(ii).
44 Australian National Audit Office, Insights: Using Performance Information to drive effectiveness, ANAO, Canberra, November 2023, available from https://www.anao.gov.au/work/insights/using-performance-information-to-drive-effectiveness [accessed 26 August 2025].
45 The Public Governance, Performance and Accountability Act 2013, section 8, defines the purposes of a Commonwealth entity as ‘including the objectives, functions or role of the entity’.
46 Department of Finance, Corporate plans for Commonwealth entities (RMG 132), Finance, Canberra, 2025, available from https://www.finance.gov.au/government/managing-commonwealth-resources/corporate-plans-commonwealth-entities-rmg-132 [accessed 9 September 2025].
47 ‘A listed entity is a non-corporate Commonwealth entity prescribed by an Act or the PGPA Rule. All non-corporate Commonwealth entities are “listed entities” except for Departments of State and Parliamentary Departments.’ Department of Finance, PGPA Act Flipchart and List, Finance, 2025, available from https://www.finance.gov.au/government/managing-commonwealth-resources/structure-australian-government-public-sector/pgpa-act-flipchart-and-list [accessed 10 November 2025].
48 See Item 7 of Schedule 1—Listed entities to the Public Governance, Performance and Accountability Rule 2014.
49 Figure 2.2 is not intended to provide a comprehensive picture of the accountability and performance reporting landscape. There are many additional requirements that are not represented. For example, many entities publish information about grants or other programs they administer, and the National Disability Insurance Agency produces quarterly reports that present participant information.
50 For example, the Department of Health, Disability and Ageing annual performance statements include references to the Report on the Operation of the Aged Care Act 1997. The Minister for Health is required to present this report to Parliament for each financial year. The most recent report shows the operation of the Act during 2024–25 (published subsequent to the department’s performance statements).
51 The ANAO has previously highlighted aspects of high quality performance measures in terms of the PGPA Rule’s requirements. Refer: Australian National Audit Office, Insights: Reporting Meaningful Performance Information, ANAO, Canberra, June 2023, available from https://www.anao.gov.au/work/insights/reporting-meaningful-performance-information [accessed 3 November 2025].
52 See subsection 17AC(2) of the Public Governance, Performance and Accountability Rule 2014.
53 The seven entities are: the Attorney-General’s Department, the Department of Defence, the Department of Education, the Department of Employment and Workplace Relations, the Department of Finance, the Department of Foreign Affairs and Trade, and the Department of Industry, Science and Resources.
Several entities not included in the ANAO’s performance statements audit program also have budgeted programs relating to nuclear-powered submarines, including the Australian Submarine Agency and the Australian Radiation Protection and Nuclear Safety Agency.
54 The Direction states that in their Portfolio Budget Statements, entities must report at least one high level performance measure for existing programs, and all performance measures for new programs.
Source: J Wilkinson, Requirements for Performance Information included in Portfolio Budget Statements, Department of Finance, Canberra, 2022, available from https://www.finance.gov.au/sites/default/files/2022-09/Finance Secretary Direction - Signed 21 August 2022_Redacted.pdf [accessed 25 November 2025].
55 Resource Management Guide 131, Department of Finance, available from https://www.finance.gov.au/government/managing-commonwealth-resources/developing-performance-measures-rmg--131/relate-purposes-and/or-key-activities [accessed 25 November 2025].
56 Some aspects of progress against Closing the Gap are reported on through other public sources, including an information repository hosted by the Productivity Commission and Annual Reports tabled by each Party to the National Agreement. Some entities, including the Department of Employment and Workplace Relations, also include narrative reporting in their Annual Performance Statements. There are limitations to the utility of these sources; for example, the Productivity Commission states in regard to the information repository that ‘It has not been possible to report data against all targets/indicators from the commencement of the Agreement.’
57 Closing the Gap Target 3, ‘By 2025, increase the proportion of Aboriginal and Torres Strait Islander children enrolled in Year Before Fulltime Schooling (YBFS) early childhood education to 95 per cent’, aligns with the Department of Education target PM069b, ‘First Nations children – 95% or higher [enrolled in quality preschool programs in the year before full-time school who are enrolled for 600 hours per year].’
Closing the Gap Target 5, ‘By 2031, increase the proportion of Aboriginal and Torres Strait Islander people (age 20–24) attaining year 12 or equivalent qualification to 96 per cent’, aligns with the Department of Education target PM072b, ‘96% of Aboriginal and Torres Strait Islander people [attaining Year 12 certification, or equivalent, or gaining a qualification at Certificate III or above] by 2031’.
Source: Closing The Gap, Closing The Gap targets and outcomes, CTG, n.d., available from https://www.closingthegap.gov.au/national-agreement/targets [accessed 4 November 2025] and Department of Education, Department of Education 2024–25 Annual Report, DoE, Canberra, 2025, pp. 72 & 79, available from https://www.education.gov.au/download/19707/department-education-2024-25-annual-report/42264/document/pdf [accessed 4 November 2025].
58 The Department of Health, Disability and Ageing does report on two measures that relate to First Nations Health. While not directly related to the National Agreement targets, they do align with Priority Reform 2 of the National Agreement on Closing the Gap.
59 Target 3.3, ‘Milestones in implementing the Priority Reform actions have been achieved (where applicable)’.
Source: National Indigenous Australians Agency, 2024–25 National Indigenous Australians Agency Annual Report, NIAA, Canberra, 2025, pp. 73–79, available from https://www.niaa.gov.au/sites/default/files/documents/2025-10/NIAA-Annual-Report-2024-25.pdf [accessed 4 November 2025].
60 Illicit Tobacco and E-cigarette Commissioner, Illicit Tobacco and E-cigarette Commissioner Report 2024-25, Canberra, 2025, available from https://www.itec.gov.au/sites/default/files/2025-12/ITEC_Commissioner-Report_2024-25.pdf [accessed 20 January 2026].
61 Department of Finance, Developing performance measures (RMG 131), Finance, Canberra, 2025, available from https://www.finance.gov.au/government/managing-commonwealth-resources/developing-performance-measures-rmg--131 [accessed 25 November 2025].
62 A modified conclusion may be expressed as a qualified conclusion, disclaimer of conclusion or adverse conclusion. See Australian Standard ASAE 3000: Assurance Engagements Other than Audits or Reviews of Historical Financial Information, paragraphs 66 and 74, available from https://standards.auasb.gov.au/asae 3000-sep- 2022 (accessed 20 November 2025).
63 Auditor-General Report No. 25 2024–25 Performance Statements Auditing in the Commonwealth — Outcomes from the 2023–24 Audit Program, ANAO, Canberra, para 1.13, available from https://www.anao.gov.au/work/performance-statements-audit/performance-statements-auditing-the-commonwealth-outcomes-from-the-2023-24-audit-program [accessed 3 November 2025].
64 ibid., para 1.18.
65 Australian Government, The Data and Digital Government Strategy, Commonwealth of Australia, n.d., available from https://www.dataanddigital.gov.au/strategy [accessed on 25 October 2025].
66 Department of Finance, Data Maturity Assessment Tool, Finance, 2025, available from https://www.finance.gov.au/government/public-data/public-data-policy/data-maturity-assessment-tool [accessed 25 October 2025].
67 Department of Finance, Australian Public Service Data Maturity Report 2024, Finance, Canberra, n.d., p. 2, available from https://www.finance.gov.au/sites/default/files/2025-03/2024_Data-Maturity-Report.pdf [accessed on 25 October 2025].
68 By comparison, in 2023–24 the ANAO assessed four of the 14 entities as ‘Developing’ and a further four entities as ‘Baseline’. One entity achieved a rating of ‘Advanced’ for this category.
69 Section 37 of the PGPA Act requires an accountable authority to keep records about performance.
70 The Archives Act 1983 outlines obligations relating to the management of Commonwealth records. Good records management is also aligned to the APS Values and Code of Conduct – refer to paragraph 1.2.17 of the Australian Public Service Commission’s Values and Code of Conduct in Practice, available from https://www.apsc.gov.au/publication/aps-values-and-code-conduct-practice [accessed 21 January 2026].
71 Section 37 of the Public Governance, Performance and Accountability Act 2013 requires accountable authorities to keep records that that properly record and explain the entity’s performance in achieving its purposes, and enable the preparation of the annual performance statements.
72 The Performance Statements Expert Advisory Panel (the Panel) was established in 2023 to provide strategic advice to the ANAO on the annual performance statements audit program to improve the quality and reliability of performance reporting in the Australian public sector. The Panel includes representatives from the Australian public sector and a number of audit committee chairs.