Browse our range of reports and publications including performance and financial statement audit reports, assurance review reports, information reports and annual reports.
Auditor-General Report No. 4 of 2026–27
Cost Recovery for Biosecurity in the Department of Agriculture, Fisheries and Forestry
Published
Wednesday 29 July 2026

Portfolio
Agriculture, Fisheries and Forestry
Entity
Department of Agriculture, Fisheries and Forestry
Contact
Please direct enquiries through our contact page.
Activity
Regulation
Sector
Agriculture
Forestry
Fisheries
Audit snapshot
Why did we do this audit?
- Australia’s biosecurity system protects its environment, economy and way of life.
- The Department of Agriculture, Fisheries and Forestry (DAFF) applies fees and charges to recover the costs of regulating Australia’s biosecurity and agricultural exports from the industries creating the demand for these services. Cost recovery from biosecurity activities makes up the majority of DAFF’s cost recovery revenue.
- DAFF’s ability to effectively perform its regulatory functions is reliant on effectively recovering these costs.
- This audit provides assurance to parliament over the effectiveness of DAFF’s biosecurity cost recovery arrangements.
Key facts
- The value of Australian agriculture, fisheries and forestry production was $100.3 billion in 2024–25.
- DAFF’s biosecurity cost recovery fees and charges were reviewed and updated in 2023 after being largely unchanged since 2015.
What did we find?
- DAFF’s administration of its biosecurity cost recovery arrangements is partly effective.
- DAFF’s arrangements for estimating costs and calculating prices for its cost recovery arrangements are partly effective. The arrangements limit DAFF’s visibility of the costs of delivery and its ability to ensure that the prices charged reflect the minimum efficient cost.
- DAFF’s implementation of its cost recovery arrangements is partly effective. Not all the prices charged are clearly linked to the prices calculated by DAFF’s pricing model. DAFF is not managing the risk of under- or over-recovery.
What did we recommend?
- The ANAO made six recommendations to DAFF related to improving visibility of prices and ensuring they reflect the minimum efficient cost to deliver services.
- DAFF agreed to four recommendations and agreed in principle to two recommendations.
$425.1m
Biosecurity cost recovery revenue in 2024–25.
81%
Prices set in 2023–24 that fully or largely matched DAFF’s modelled prices.
70%
Proportion of total cost recovery revenue from biosecurity cost recovery in 2023–24 and 2024–25.
Summary and recommendations
Background
1. Australia’s biosecurity system is essential for the protection of our environment, economy and way of life. The value of Australian agriculture, fisheries and forestry production has increased by 45 per cent in the last 20 years in real terms1 from $69.3 billion in 2004–05 to $100.3 billion in 2024–25.2 The Centre of Excellence for Biosecurity Risk Analysis estimated that:
In the absence of a biosecurity system we forecast that approximately A$671.94 billion in damages attributable to newly introduced pests and diseases would be incurred by [assets vulnerable to biosecurity hazards] over the next 50 years. Instead, we estimate that these damages would decline by approximately A$325.26 billion (the benefit) to A$346.67 billion in response to the system’s operation …3
2. Biosecurity cost recovery arrangements were reviewed in 2015 to coincide with the commencement of the Biosecurity Act 2015. The prices set in 2015 remained largely unchanged until 2023, despite the changing biosecurity environment and increasing costs for DAFF.
3. From July 2021 to December 2022, DAFF conducted a ‘comprehensive review of the biosecurity cost recovery arrangement to determine adjustments needed to stabilise the cost base’ (2021–22 review). The review proposed changes to existing prices to align them with the actual cost to deliver biosecurity and imported food activities. The 2021–22 review found that the cost base had grown by $121 million between 2015–16 and 2023–24 due to the impact of inflation ($62.8 million), implementation of government measures ($38.5 million) and increased effort and system costs ($19.7 million).
4. On 7 June 2023, the minister approved the final 2023–24 Biosecurity Cost Recovery Implementation Statement (CRIS), incorporating the new fees and charges. Legislative amendments required to implement the changes passed in June 2023. The changes, including a provision for indexation of fees and charges, came into effect on 1 July 2023. Following the changes made to the biosecurity cost recovery arrangements for 2023–24, DAFF’s cost recovery revenue for biosecurity has been higher than its expenses.
Rationale for undertaking the audit
5. DAFF applies fees and charges4 to individuals and industry to recover the costs of its regulatory services. DAFF’s ability to perform its regulatory functions is reliant on effectively recovering its costs. Recovered costs should reflect the accurate and efficient costs of regulation to minimise the impact on regulated industries.
6. This audit provides assurance to the Parliament on whether the department is effectively administering its cost recovery arrangements.
Audit objective and criteria
7. The objective of the audit was to assess whether the Department of Agriculture, Fisheries and Forestry (DAFF) is effectively administering its biosecurity cost recovery arrangements.
8. To form a conclusion against the objective, the following criteria were adopted:
- Has DAFF established effective arrangements to support cost recovery?
- Has DAFF effectively implemented its cost recovery arrangements?
9. The audit focuses on DAFF’s cost recovery arrangements for its biosecurity activities. Cost recovery for its biosecurity activities comprises the majority of DAFF’s cost recovery revenue (see Table 1.1).
Conclusion
10. The Department of Agriculture, Fisheries and Forestry’s administration of its cost recovery arrangements for biosecurity is partly effective. Under the Australian Government Cost Recovery Policy, efficiency and effectiveness depends on a charging model that accurately measures and reflects costs, while balancing precision with the cost of developing and maintaining a more complex model.5 Although DAFF has established a charging model, it could not demonstrate that the prices it sets reflect actual or minimum efficient costs, and its charging model was not applied consistently in setting prices.
11. DAFF’s arrangements to estimate costs and calculate prices to support its cost recovery arrangements are partly effective. DAFF has established a charging model to estimate the cost of its outputs and to inform the prices for its fees and charges. It has not mapped or assigned costs to the key business processes required to deliver outputs. This limits DAFF’s visibility of the cost of delivering its activities and increases the risk that the estimated costs of its outputs do not accurately represent DAFF’s actual costs. As a result, DAFF’s ability to ensure prices reflect minimum efficient costs is reduced, as is its capacity to demonstrate to stakeholders that cost-recovered activities are delivered at minimum efficient cost. DAFF conducted three reviews regarding the effectiveness of its charging model in 2024. The reviews identified risks related to the accuracy of DAFF’s cost estimates and prices. DAFF engages with stakeholders regarding changes to biosecurity fees and charges.
12. DAFF’s implementation of its cost recovery arrangements is partly effective. Eighty-one per cent of biosecurity prices were directly or largely6 informed by the calculations of DAFF’s charging model. DAFF did not advise the secretary or minister how biosecurity prices that were not directly informed by its model were calculated when seeking approval for the prices. These prices were then indexed for 2024–25 and 2025–26. DAFF’s biosecurity cost recovery revenue was higher than its expenses in 2023–24, 2024–25 and 2025–26.7 DAFF’s ability to effectively manage the risk of cross subsidisation is limited. It is not effectively managing the risks of under- or over-recovery. DAFF is publicly reporting on the financial and non-financial performance of biosecurity cost recovery.
Supporting findings
Arrangements to support cost recovery
13. DAFF has established a charging model to estimate the cost of its outputs and to inform the prices for its fees and charges (levies). DAFF has assigned costs to outputs for specific activities but has not mapped or assigned costs to the key business processes required to deliver the outputs. This means that DAFF has limited visibility of the cost of delivering its activities. This increases the risk that the estimated costs of its outputs and the prices charged to users may not accurately represent DAFF’s actual costs. This limits DAFF’s ability to ensure that the prices for its fees and charges (levies) reflect the minimum efficient costs of delivering the outputs. (See paragraphs 2.2 to 2.71)
14. DAFF reviewed the biosecurity cost recovery arrangement in 2021–22 and conducted three reviews regarding the effectiveness of its charging model in 2024. Reviews of the model identified risks related to the accuracy of DAFF’s cost estimates; transparency of its cost base; and cross subsidisation — where over recovery for some activities subsidises the under recovery of other activities. DAFF engaged with stakeholders regarding changes to biosecurity fees and charges. DAFF’s charging model limits its ability to ensure and transparently demonstrate to its stakeholders that its cost recovered activities are being delivered at the minimum efficient cost. (See paragraphs 2.72 to 2.105)
Implementation of cost recovery
15. Thirty-four per cent of the biosecurity prices set in 2023–24 were not directly informed by DAFF’s charging model’s calculations of the cost for the delivery of those activities. The secretary and minister were not advised that these prices were not directly informed by the model, or of the reasoning for not using the model’s calculations, when the department sought approval for the prices. The 2023–24 prices were indexed for 2024–25 and 2025–26. DAFF’s cost recovery revenue for biosecurity was higher than its expenses in 2023–24, 2024–25 and 2025–26.8 DAFF’s ability to effectively identify, understand and address areas of under- or over-recovery and effectively manage the risk of cross subsidisation is limited. Without clear identification and assessment of risks relating to cost recovery revenue collection, DAFF’s ability to effectively monitor and respond to risks of under- and over-recovery is limited. (See paragraphs 3.4 to 3.56)
16. DAFF is publicly reporting on the financial and non-financial performance of biosecurity cost recovery. DAFF’s biosecurity Cost Recovery Implementation Statements (CRISs) include the elements outlined in the Cost Recovery Policy and Resource Management Guide 302. Non-financial performance measures and results reported in the CRISs match information presented in DAFF’s annual reports. DAFF undertook Charging Risk Assessments for biosecurity cost recovery arrangements in 2023–24 and 2024–25. In 2023–24 and 2024–25, DAFF published Biosecurity Funding and Expenditure Reports. (See paragraphs 3.60 to 3.70)
Recommendations
Recommendation no. 1
Paragraph 2.13
The Department of Agriculture, Fisheries and Forestry improve visibility and monitoring of the minimum efficient cost of key business processes required to deliver its outputs.
Department of Agriculture, Fisheries and Forestry response: Agreed in principle.
Recommendation no. 2
Paragraph 2.28
The Department of Agriculture, Fisheries and Forestry improve the accuracy of effort-based cost drivers that are used to inform the allocation of costs, including ensuring consistency in estimation methods between cost centres, where appropriate.
Department of Agriculture, Fisheries and Forestry response: Agreed.
Recommendation no. 3
Paragraph 2.67
The Department of Agriculture, Fisheries and Forestry finalise its Cost Recovery Policy and the Charging Guidelines.
Department of Agriculture, Fisheries and Forestry response: Agreed.
Recommendation no. 4
Paragraph 3.27
The Department of Agriculture, Fisheries and Forestry:
- consistently apply its charging model in the setting of cost recovery prices, to ensure that prices are informed by the estimated costs of delivering the activities; and
- document reasoning and inform decision-makers and stakeholders when prices are set outside of the model.
Department of Agriculture, Fisheries and Forestry response: Agreed in principle.
Recommendation no. 5
Paragraph 3.38
The Department of Agriculture, Fisheries and Forestry ensure that the increase in prices delivered by the application of indexation aligns with the estimated cost of delivering biosecurity activities.
Department of Agriculture, Fisheries and Forestry response: Agreed.
Recommendation no. 6
Paragraph 3.57
The Department of Agriculture, Fisheries and Forestry assess the risks relating to under- or over-recovery of cost recovery revenue and apply appropriate controls and treatments to effectively manage these risks.
Department of Agriculture, Fisheries and Forestry response: Agreed.
Summary of entity response
17. The proposed report was provided to the Department of Agriculture, Fisheries and Forestry (DAFF) and an extract was provided to the Department of Finance (Finance).
18. The summary response for DAFF is reproduced below and the management response is at Appendix 1. Finance confirmed that they had not identified any errors of fact or omissions in the extract. Improvements observed by the ANAO during the course of this audit are listed in Appendix 2.
Department of Agriculture, Fisheries and Forestry
The department welcomes the Australian National Audit Office’s (ANAO) proposed audit report - Cost Recovery in the Department of Agriculture, Fisheries and Forestry. The department is committed to complying with the requirements of the Australian Government Charging Framework (the Framework).
Over the past three years we have taken significant steps to strengthen and uplift our cost recovery maturity and aim to ensure our practices are in alignment with the elements of the Framework. This includes completing a comprehensive review of biosecurity and exports fees and charges, implementing annual pricing reviews and consultative processes, investing in a new cost modelling system and building internal capability.
The department continues to take targeted steps to mature our processes in line with best practice examples in the Framework, including assessing where the benefits of monitoring costs at the business processes level outweigh the cost. As part of this work, the department is establishing a Regulatory Efficiency Program to drive more systematic identification of efficiencies. Consistent with the requirements of the Framework and the expectations of those we regulate, there will always be an ongoing need to balance the level at which we analyse the efficiency of costs against the administrative effort. As these administrative costs form part of the cost base, we endeavour to minimise them wherever possible for industry.
The department acknowledges the six recommendations, which focus on strengthening alignment with the Framework, the need to continue to ensure prices align with the minimum efficient costs of delivering regulatory activities and applying appropriate controls and treatments to manage the risks of under or over recovery.
The department has been taking proactive steps to move to examples of best practice outlined in the Cost Recovery Policy, as set out in Resource Management Guide No: 302: Australian Government Charging Framework (RMG 302) to further improve visibility of the minimum efficient cost of delivering biosecurity activities. The department will continue to enhance cost visibility through a phased and risk-based approach, prioritising high-value and high-risk activities. Bottom-up costing and process-level analysis will be applied selectively where the benefits outweigh the administrative and system costs, consistent with proportionality principles in RMG 302.
The department acknowledges that historical decisions to set prices outside of the model resulted in the department not passing on the full cost of the regulatory effort to industry. The variances in prices identified by the ANAO represent approximately 3.2% of the 2025-26 April year to date biosecurity cost recovered revenue. The department acknowledges that historical decisions to set prices outside of the model should have been more appropriately documented. The department will continue to strengthen governance by ensuring any deviations from modelled prices are clearly documented, justified and communicated to decision-makers, while retaining flexibility to apply policy judgement where required.
As outlined above, the department has not sat idle in maturing our cost recovered processes, methodically investing in our cost recovery capability to address improvement opportunities. The department’s current cost recovery improvement program will strengthen standardisation, documentation, quality assurance and supporting evidence, while maintaining a proportionate approach that reflects operational realities and system capability. It will also provide targeted investment through the Regulatory Efficiency Program to ensure the efficiency of expenditure and identification of efficiency opportunities.
This feedback has been provided to the ANAO and we thank them for their engagement throughout the audit process.
Key messages from this audit for all Australian Government entities
19. Below is a summary of key messages, including instances of good practice, which have been identified in this audit and may be relevant for the operations of other Australian Government entities.
Group title
Policy/program design
Key learning reference
Group title
Governance and risk management
Key learning reference
1. Background
1.1 Australia’s biosecurity system is essential for the protection of our environment, economy and way of life. The value of Australian agriculture, fisheries and forestry production has increased by 45 per cent in the last 20 years in real terms9 from $69.3 billion in 2004–05 to $100.3 billion in 2024–25.10 The Centre of Excellence for Biosecurity Risk Analysis estimated that:
In the absence of a biosecurity system we forecast that approximately A$671.94 billion in damages attributable to newly introduced pests and diseases would be incurred by [assets vulnerable to biosecurity hazards] over the next 50 years. Instead, we estimate that these damages would decline by approximately A$325.26 billion (the benefit) to A$346.67 billion in response to the system’s operation …11
1.2 The Department of Agriculture, Fisheries and Forestry (DAFF)’s biosecurity regulatory activities ‘occur onshore, offshore and at the border’ and ‘are associated with measures and controls to manage and minimise the risk of pests, weeds and diseases entering, emerging, establishing or spreading within Australia.’12
1.3 The Government’s policy is for biosecurity to be fully cost recovered. The Biosecurity Cost Recovery Implementation Statement (CRIS) states that the ‘Australian Government continues to affirm full cost recovery as the appropriate level of cost recovery from regulated entities through the portfolio budget statements and budget processes each year.’13 DAFF uses both cost recovery fees and levies, which it calls charges, in its biosecurity price model.14
Cost recovery
1.4 The Australian Government Charging Policy (AGCP) states that ‘where an individual or organisation creates the demand for a government activity, they should generally be charged for it, unless the Government has decided to fund the activity.’ It explains this policy is a ‘whole-of-government charging framework’ and ‘applies to all corporate and non-corporate Commonwealth entities in the Government General Sector’.15
1.5 The Australian Government Cost Recovery Policy (CRP), which ‘must be applied by all non-corporate Commonwealth entities and by selected corporate Commonwealth entities16’ states that:
Cost recovery involves the Australian Government charging the non-government sector some or all of the efficient costs of a specific government activity. That activity may include the provision of goods, services or regulation, or a combination of them.
Cost recovery can:
- promote equity, whereby the recipients of a government activity, rather than the general public, bear its costs
- influence demand for government activities
- improve the efficiency, productivity and responsiveness of government activities and accountability for those activities
- increase cost consciousness for all stakeholders by raising awareness of how much a government activity costs.17
1.6 The Charging Framework consists of the AGCP and the CRP. The Department of Finance’s Resource Management Guide18 302 (RMG 302) provides guidance to entities on implementing the charging framework.19
1.7 There are inconsistencies in the terminology used in the documents that comprise the charging framework and the guidance supporting its implementation. For example, when discussing models that inform government charging activities:
- AGCP uses the terms ‘charging model’ and ‘pricing model’, but does not explain how they are related (for instance, whether they are interchangeable terms or whether a pricing model is a component of the charging model);
- CRP uses the term ‘cost recovery model’; and
- RMG 302 uses the term ‘charging model’, which it states comprises a ‘cost model’ (‘expected costs to the entity’) and a ‘price model’ (‘price to the user’).
1.8 In March 2026, the Department of Finance (Finance) advised the ANAO that ‘The terms “cost recovery model” in the Cost Recovery Policy (CRP) and “charging model” in the RMG 302 Charging Framework are intended to refer to the same, single concept of a cost and price model.’ It explained that:
Historically the term ‘cost recovery’ referred to regulatory activities (refer introduction of 2014 CRP) and the term ‘charging’ covered regulatory and non-regulatory activities (refer introduction of 2015 Charging Policy).
The RMG 302 Charging Framework was updated in 2023 to make the guidance simpler and easier for entities to understand the charging implementation steps and reviewing cycle, and the related policies.
1.9 For the purposes of this report, the ANAO has used the terminology from RMG 302, using the term ‘charging model’, which comprises a ‘cost model’ and a ‘price model’.
1.10 There are also inconsistencies in the requirements outlined in the documents. RMG 302 provides guidance on implementing the AGCP and the CRP, including the requirements detailed within these policies. However, there are instances where RMG 302 indicates that a matter is mandatory (‘must’), where the matter is not mentioned in the policies or the policies indicate the matter is non-mandatory (‘should’).
1.11 These and other issues identified in the charging framework policies and guidance are outlined in Appendix 3. Inconsistencies in government frameworks, policies and guidance limit entities’ ability to effectively comply with government policies and apply guidance.
1.12 Finance is undertaking a review of the cost recovery framework and its supporting guidance. In March 2026, it advised the ANAO that ‘The current review of the Charging Framework seeks to ensure that the policies are fit for purpose and improve the guidance where possible.’ Finance advised that:
Stakeholder consultation is completed on the current review of the Charging Framework. Finance is now seeking to provide the results of the consultation of the draft revised policy to the Minister for Finance for agreement in the first half of 2026.
Cost recovery in the Department of Agriculture, Fisheries and Forestry
1.13 DAFF applies fees and charges to recover the costs of regulating Australia’s biosecurity and agricultural exports from the industries creating the demand for these services.20 Regulatory activities for which DAFF recovers its costs include:
- inspections of imported goods;
- husbandry21 of live animals and plants in quarantine;
- issuance of permits and export certifications; and
- development of systems and policy to support compliance with requirements.
1.14 Figure 1.1 is a generalised example of a regulatory process that is cost recovered by DAFF, shown from the perspective of a customer seeking to import a cat into Australia in 2025–26.
Figure 1.1: Example — process for import of a cat
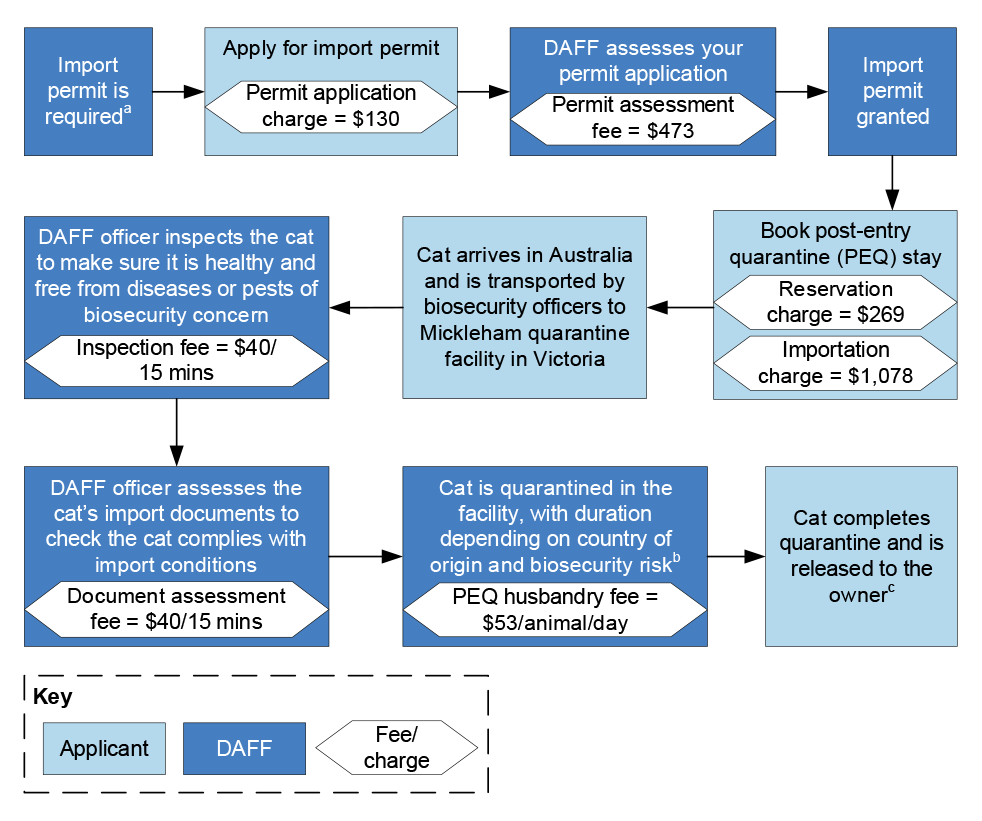
Note a: Animals from some countries or territories may not require an import permit if they meet the standard health certificate conditions.
Note b: Minimum quarantine period differs between countries from no mandatory quarantine period to 10 or 30 days.
Note c: Additional fees may apply if the animal needs extra parasite treatments, veterinary care, an extended stay in quarantine or other services.
Source: ANAO representation based on DAFF publicly available information.22
Cost recovery arrangements
Biosecurity
1.15 The Australian Government commenced partial cost recovery for biosecurity activities in 1979, moving to full cost recovery from 1 January 1991.23
1.16 Biosecurity cost recovery arrangements were reviewed in 2015 to coincide with the commencement of the Biosecurity Act 2015. The prices set in 2015 remained largely unchanged24 until 2023, despite the changing biosecurity environment and increasing costs for DAFF. This contributed to an increasing funding shortfall for DAFF (see paragraphs 1.24 to 1.28).
1.17 From July 2021 to December 2022, DAFF conducted a ‘comprehensive review of the biosecurity cost recovery arrangement to determine adjustments needed to stabilise the cost base’ (2021–22 review). The review proposed changes to existing prices to align them with the actual cost to deliver biosecurity and imported food activities. The 2021–22 review found that the cost base had grown by $121 million between 2015–16 and 2023–24 due to the impact of inflation ($62.8 million), implementation of government measures ($38.5 million) and increased effort and system costs ($19.7 million).
1.18 On 7 June 2023, the minister approved the final 2023–24 Biosecurity Cost Recovery Implementation Statement (CRIS), incorporating the new fees and charges. Legislative amendments required to implement the changes passed in June 2023. The changes, including a provision for indexation of fees and charges, came into effect on 1 July 2023.
Exports
1.19 The Export Control Act 2020 established the current legislative framework for the regulation of exported goods, including the recovery of the costs of the department’s regulatory activities from exporters. The legislation replaced the existing legislative framework for agricultural exports, which had developed over the previous 35 years through various acts and legislative instruments.
1.20 The 2020–21 Budget included funding of $71.1 million over three years ‘to improve the financial sustainability of export certification services by returning to full cost recovery of these services over time’. Following modelling undertaken in 2021–22, prices were legislated with stepped increases from 2021–22 through to 2024–25 with the intention of returning export cost recovery arrangements to full cost recovery by 2023–24.
1.21 In 2023–24, the department was provided with funding to sustain the delivery of key export and trade regulatory functions, while it developed an ongoing sustainable funding model. Pricing remained as legislated until 2024–25. In 2024–25, additional funding was provided to continue to sustain export regulatory services, allowing further time for consultation on a sustainable funding model. DAFF reported in its 2024–25 agricultural exports CRISs that, ‘in recent years the rate of change in Australia’s export trade landscape has accelerated’, and that ‘it has become clear that the modelling and assumptions used to inform the prices now in legislation differs from reality’.
1.22 This audit has not reviewed cost recovery arrangements for agricultural exports, given the Government announced new cost recovery arrangements for export regulatory services in the 2025–26 Mid-Year Economic and Fiscal Outlook (MYEFO). This included a phased return to full cost recovery over three years for most export cost recovery arrangements. In April 2026, the Government announced a decision to defer the transition for 12 months to 1 July 2027 due to the impact of global events. On 12 June 2026, DAFF published the 2026–27 Cost Recovery Implementation Statements for agricultural exports.
Revenue from cost recovery
1.23 Table 1.1 shows DAFF’s cost recovery revenue, as reported in its financial statements from 2020–21 to 2024–25. Cost recovery from biosecurity activities comprises the majority of DAFF’s cost recovery revenue, comprising approximately 70 per cent in 2023–24 and 2024–25.
Table 1.1: Revenue from cost recovery, 2020–21 to 2024–25
|
Cost recovery activity |
2020–21 $m and (%) of total |
2021–22 $m and (%) of total |
2022–23a $m and (%) of total |
2023–24 $m and (%) of total |
2024–25 $m and (%) of total |
|
Biosecurity arrangement |
282.8 (70.3) |
286.3 (68.9) |
295.5 (66.7) |
362.5 (70.3) |
425.1 (70.8) |
|
Food export arrangement |
78.7 (19.6) |
81.0 (19.5) |
89.3 (20.1) |
91.9 (17.8) |
107.1 (17.8) |
|
Plant export arrangement |
18.1 (4.5) |
23.0 (5.5) |
28.2 (6.4) |
29.2 (5.7) |
30.7 (5.1) |
|
Live animal export arrangement |
5.7 (1.4) |
7.6 (1.8) |
12.1 (2.7) |
14.5 (2.8) |
14.1 (2.4) |
|
Other cost recovery |
17.1 (4.3) |
17.6 (4.2) |
18.2 (4.1) |
17.3 (3.3) |
23.2 (3.9) |
|
Total |
402.5 |
415.5 |
443.2 |
515.3 |
600.2 |
Note a: From 1 July 2022, the relevant department changed from the Department of Agriculture, Water and the Environment (DAWE) to DAFF due to a Machinery-of-Government change.
Source: DAFF and DAWE financial statements.
Cost recovery and financial sustainability
1.24 In early to mid-2023, there were reports that DAFF was experiencing significant financial challenges, with media revealing that the department was cutting back on contractors, travel and training in an effort to reduce spending.
1.25 In the 2023–24 Budget, the government provided DAFF with $127 million in supplementary funding, ‘to meet a shortfall predominantly related to cost recovered activities, and increased biosecurity operations including frontline border operations and import clearances’.
1.26 The Department of Finance commissioned an independent review to examine DAFF’s financial position and report on findings and recommendations. The independent review identified four root causes of DAFF’s financial and operational challenges: basic financial systems and hygiene; cost recovery program sustainability; competing priorities; and financial and corporate capability.
1.27 The independent review found that, of DAFF’s $127 million operating loss for 2022–23, $70.8 million (55.7 per cent) comprised under-recovered expenses under cost recovery arrangements. Of the $70.8 million operating loss attributed to cost recovery, under-recovery in:
- biosecurity arrangements comprised $51.4 million (72.6 per cent);
- exports arrangements comprised $10.0 million (14.1 per cent); and
- other cost recovery arrangements comprised $9.4 million (13.3 per cent).
1.28 A further $17.6 million was attributed to biosecurity digital projects.
Past audits
1.29 Auditor-General Report No. 38 2018–19 Application of Cost Recovery Principles was tabled in May 2019.25 The audit assessed whether the Australian Maritime Safety Authority; Department of Agriculture and Water Resources; and Department of Health (for the Therapeutic Goods Administration) effectively applied the cost recovery principles of the Australian Government’s cost recovery framework.
1.30 The audit found that the three entities had been ‘partially effective in implementing the cost recovery principles of the Australian Government’s cost recovery framework’.26 It stated that:
There is no assurance that entity charges recover the efficient costs of their activities, although Agriculture has benchmarked some of its costs. Entities’ cost recovery policies and cost recovery methodologies are at varying levels of being fit for purpose, with Health’s approach for the TGA the most complete.27
1.31 The report made one recommendation specifically directed to the Department of Agriculture and Water Resources, which the entity agreed to:
The Department of Agriculture and Water Resources:
(a) uses the current review of its charging arrangements to align its fees and levies with the Cost Recovery Guidelines; and
(b) develops a cost recovery model that aligns the prices, expenses and revenues of outputs within regulatory activities to the efficient cost of providing those outputs.28
Rationale for undertaking the audit
1.32 DAFF applies fees and charges to individuals and industry to recover the costs of its regulatory services.29 DAFF’s ability to effectively perform its regulatory functions is reliant on effectively recovering its costs. Recovered costs should reflect the accurate and efficient costs of regulation to minimise the impact on regulated industries.
1.33 This audit provides assurance to the Parliament on whether the department is effectively administering its biosecurity cost recovery arrangements.
Audit approach
Audit objective, criteria and scope
1.34 The objective of the audit was to assess whether the Department of Agriculture, Fisheries and Forestry (DAFF) is effectively administering its biosecurity cost recovery arrangements.
1.35 To form a conclusion against the objective, the following criteria were adopted:
- Has DAFF established effective arrangements to support cost recovery?
- Has DAFF effectively implemented its cost recovery arrangements?
1.36 The audit focuses on DAFF’s cost recovery arrangements for its biosecurity activities. Cost recovery for its biosecurity activities comprises the majority of DAFF’s cost recovery revenue (see Table 1.1).
1.37 The audit does not assess DAFF’s cost recovery arrangements for agricultural exports (see paragraphs 1.19 to 1.22). However, as DAFF uses the same cost model to estimate its costs for its biosecurity and agricultural export activities, many of the findings in this report may be applicable to DAFF’s current and future cost recovery arrangements for agricultural export activities.
Audit methodology
1.38 The audit methodology included: review of relevant DAFF records and data; meetings with relevant DAFF staff; and engagement with the Department of Finance to understand relevant requirements.
1.39 The ANAO received four submissions via the citizen contribution facility on the ANAO website.
1.40 The audit was conducted in accordance with ANAO Auditing Standards at a cost to the ANAO of approximately $984,000.
1.41 The team members for this audit were Casey Mazzarella, Se Eun Lee, Lorcan Stevens, Liset Campos Manrique, Alexandros Soundias, Nancy Jin, Alyssa McDonald, Madigan Paine and David Tellis.
2. Arrangements to support cost recovery
Areas examined
This chapter examines whether the Department of Agriculture, Fisheries and Forestry (DAFF) has established effective arrangements to support biosecurity cost recovery.
Conclusion
DAFF’s arrangements to estimate costs and calculate prices to support its cost recovery arrangements are partly effective. DAFF has established a charging model to estimate the cost of its outputs and to inform the prices for its fees and charges. It has not mapped or assigned costs to the key business processes required to deliver outputs. This limits DAFF’s visibility of the cost of delivering its activities and increases the risk that the estimated costs of its outputs do not accurately represent DAFF’s actual costs. As a result, DAFF’s ability to ensure prices reflect minimum efficient costs is reduced, as is its capacity to demonstrate to stakeholders that cost recovered activities are delivered at minimum efficient cost. DAFF conducted three reviews regarding the effectiveness of its charging model in 2024. The reviews identified risks related to the accuracy of DAFF’s cost estimates and prices. DAFF engages with stakeholders regarding changes to biosecurity fees and charges.
Areas for improvement
The ANAO made three recommendations for the department to:
- improve visibility of the minimum efficient cost of key business processes required to deliver its outputs;
- improve the accuracy of effort-based cost drivers that are used to inform the allocation of costs; and
- finalise its Cost Recovery Policy and the Charging Guidelines.
2.1 The Australian Government Cost Recovery Policy (CRP) outlines three cost recovery principles that ‘must be applied across all stages of the cost recovery process’30:
- efficiency and effectiveness — described as ‘making the proper use of available resources (people, money and other supplies) to achieve government policy outcomes’;
- transparency and accountability — described as ‘openness, two-way communication and a willingness to explain activities and actions’ and ‘documenting key information about the activity, such as the policy approval, statutory authority to charge and cost recovery model, in an accessible way for those who pay charges and for other stakeholders’; and
- stakeholder engagement — described as engaging ‘actively with stakeholders throughout all stages of the cost recovery process, from policy development through to implementation and review’.31
Has DAFF established an appropriate charging model?
DAFF has established a charging model to estimate the cost of its outputs and to inform the prices for its fees and charges (levies). DAFF has assigned costs to outputs for specific activities but has not mapped or assigned costs to the key business processes required to deliver the outputs. This means that DAFF has limited visibility of the cost of delivering its activities. This increases the risk that the estimated costs of its outputs and the prices charged to users may not accurately represent DAFF’s actual costs. This limits DAFF’s ability to ensure that the prices for its fees and charges (levies) reflect the minimum efficient costs of delivering the outputs.
2.2 The CRP states that ‘A well-developed cost recovery model enables entities to’:
- measure and improve efficiency
- minimise over- and under-recovery of costs
- manage costs and monitor performance
- justify how cost recovery charges have been calculated and how they relate to the costs of the activity (stakeholders who pay cost recovery charges expect to receive value for money).32
2.3 The Department of Finance Resource Management Guide 302 (RMG 302) provides guidance to entities on implementing the CRP. RMG 302 uses the term ‘charging model’, which it states is made up of two separate components:
- a cost model to determine the expected costs to the entity; and
- a price model to determine the price to be charged to the user (individual or organisation).33
Cost model
2.4 DAFF utilises two tools to determine, track and report on the costs of administering its regulatory activities:
- an Excel-based model, referred to as the ‘CRIS model’34, which is the primary tool that DAFF uses to estimate costs and prices for its cost recovered activities during its budget and planning processes; and
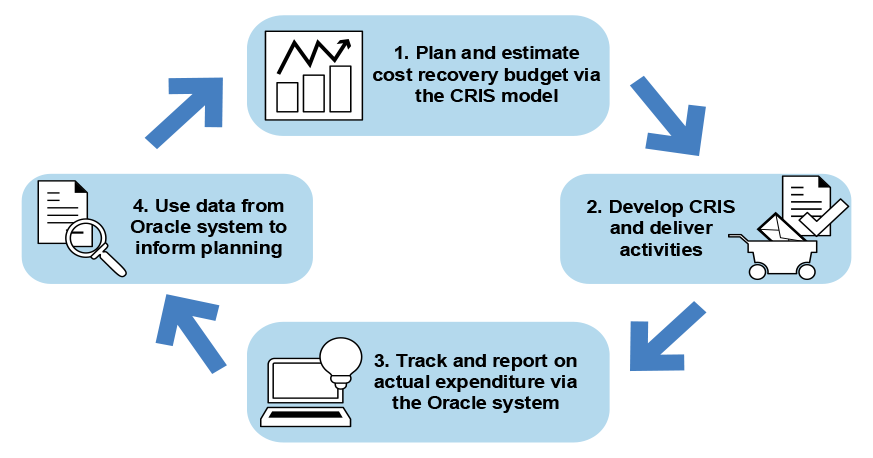
- a system based on the Oracle Hyperion Profitability and Cost Management (HPCM) software product (Oracle system), which reflects the estimated costs from the CRIS model, and is used to track and report on actual expenditure as activities are delivered throughout the year.
2.5 Figure 2.1 illustrates DAFF’s cost recovery business cycle and how the two models are used.
Figure 2.1: DAFF cost recovery business cycle and cost model
Source: ANAO representation of DAFF processes based on entity documentation.
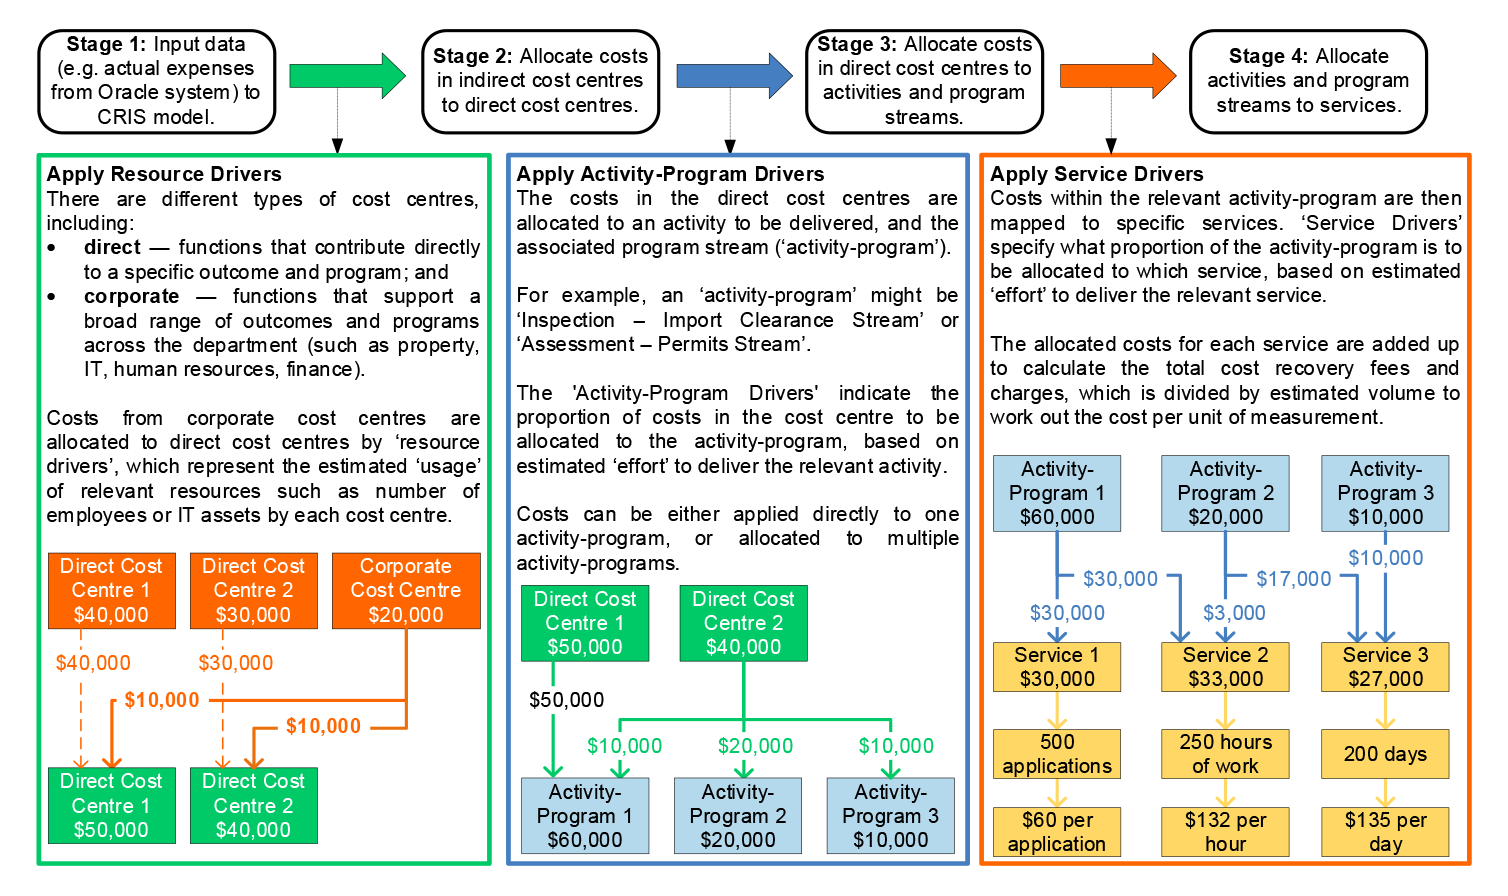
2.6 DAFF uses the Excel-based CRIS model to estimate the costs for its cost recovered activities. There are four stages in the cost modelling process, summarised in Figure 2.2. The process involves allocating the estimated costs of each cost centre to activities and programs, and then to a chargeable service, based on the values of ‘cost drivers’.
2.7 Cost drivers are a ‘percentage-based representation of the underlying activity’ that dictates where costs should be allocated. DAFF’s cost model uses three types of cost drivers.
- Resource Drivers are used to allocate costs in indirect (corporate) cost centres to direct cost centres. They represent the estimated ‘usage’ of relevant resources such as number of employees or IT assets by the relevant cost centre.
- Activity-Program Drivers are used to allocate costs in direct cost centres to an activity the department delivers and its associated program stream. Activity-Program Drivers are based on estimated ‘effort’ to deliver the relevant activity by each cost centre.
- Service Drivers are used to allocate costs in each Activity-Program to specific chargeable services. Each service maps to an item code in DAFF’s financial management information system (FMIS), which enables tracking of actual expenditure against planned expenditure. Service Drivers are also based on estimated ‘effort’ directed to deliver the relevant service.
Figure 2.2: Stages in DAFF’s cost modelling process
Source: ANAO representation of DAFF processes based on entity documentation.
Alignment with government policy
2.8 The CRP outlines five elements an entity’s cost model ‘should’ include.35 Table 2.1 summarises the ANAO’s analysis of DAFF’s cost model against these elements.
Table 2.1: ANAO assessment of DAFF’s cost model against elements in CRP
|
Element |
Rating |
ANAO assessment |
|
Identify outputs and business processes of the activity |
▲ |
DAFF has identified the outputs (services) of its cost recovery activities. It has not disaggregated the outputs into key business processes that are used to produce those outputs. This limits DAFF’s visibility of the cost of delivering its activities and increases the risk that the costs of its outputs (and ultimately the prices charged to users) may not represent the minimum efficient costs of delivering its activities. For more detail, see paragraphs 2.9 to 2.12. |
|
Accurately measure and assign costs to outputs and business processes |
▲ |
DAFF has assigned costs to outputs but has not mapped or assigned costs to key business processes. DAFF determines the unit cost of each output by allocating estimated costs down from relevant cost centres to outputs via a percentage-based estimation of ‘effort’, divided by estimated volume of demand for the activity (see Figure 2.2). There is a risk that, where the assumptions underlying the effort allocations are misaligned with practice (for example, if an activity requires greater effort than estimated), the costs of the relevant outputs may not be reflective of actual costs. Reliance on management estimates of effort rather than more evidence-based methods, such as detailed timekeeping data or time and motion studies, may increase the risk of inaccuracy of estimated costs. For more detail, see paragraphs 2.16 to 2.31. |
|
Use relevant proxies for the allocation of indirect costs |
◆ |
DAFF uses ‘resource drivers’ (see paragraph 2.7) to allocate indirect costs to direct cost centres (see Figure 2.2). For example, corporate IT cost centres may use the number of IT assets as the resource driver, whereas HR or division executive may use FTEs or headcount. |
|
Track the degree of alignment between expenses and revenue |
▲ |
DAFF prepares monthly reports on cost recovery expenses and revenue using data extracted from the Oracle system, which are included in the Chief Finance Officer (CFO) report provided to the Executive Board. DAFF uses the CRIS model for cost modelling and planning and the Oracle system for tracking and reporting on actual expenses and revenue (see paragraph 2.4). Using two different tools for planning and monitoring increases the risk of inaccuracies in the tracking of estimated costs and actual expenses and revenue, due to possible misalignment in cost drivers between the Oracle system and the CRIS model. There is a risk that misalignment may occur due to irregular updates of the Oracle system following changes to the CRIS model (or vice versa), human error when inputting updated data, or other differences in assumptions between the two systems. For more detail, see paragraphs 2.32 to 2.44. |
|
Produce relevant and timely performance reports for the activity |
◆ |
DAFF reports publicly on its financial and non-financial performance via the biosecurity CRIS, the annual biosecurity budget and expenditure reports, and the annual reports. For more detail, see paragraphs 3.60 to 3.70. |
Key: ◆ Fully aligns with CRP element; ▲ Partly aligns with CRP element; ■ Does not align with CRP element.
Source: ANAO analysis.
Identify outputs and business processes of the activity
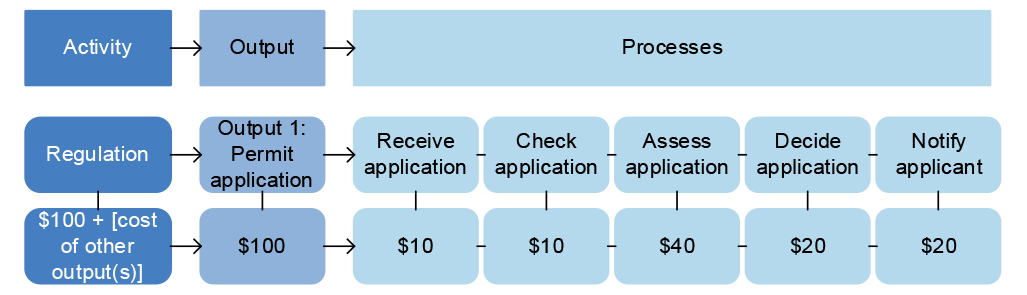
2.9 The CRP states that entities ‘should break down the activity into distinct outputs (e.g. registrations, audits, or the development of standards) and the key business processes that are used to produce those outputs’.36 The CRP states that ‘techniques for identifying business processes include process modelling, performance measurement and workflow analysis.’ An example adapted from the CRP is illustrated in Figure 2.3.
Figure 2.3: Example of breaking down activity into outputs and business processes
Source: Adapted by the ANAO from Australian Government Cost Recovery Policy, Figure 9.
2.10 DAFF has identified the outputs that it provides to regulated entities. These outputs have not been disaggregated down further into the key business processes used to produce the outputs via techniques such as process modelling or workflow analysis.
2.11 Using the example illustrated in Figure 2.3, DAFF has identified an output for assessing applications for import permits and has used its cost model to calculate a unit cost for the assessment of each application (see Figure 2.2). DAFF has not mapped or assigned costs to the business processes required to deliver the output — such as receiving, checking, assessing, and deciding on the application, and then notifying the applicant.
2.12 This limits DAFF’s visibility of the cost of delivering its activities and increases the risk that the costs of its outputs (and ultimately the prices charged to users) may not represent the minimum efficient costs of delivering its activities.
Recommendation no.1
2.13 The Department of Agriculture, Fisheries and Forestry improve visibility and monitoring of the minimum efficient cost of key business processes required to deliver its outputs.
Department of Agriculture, Fisheries and Forestry response: Agreed in principle.
2.14 The department has been taking proactive steps to improve its alignment with elements of the Cost Recovery Policy, as set out in Resource Management Guide No: 302: Australian Government Charging Framework (RMG 302) to further improve visibility of the minimum efficient cost of delivering biosecurity activities.
2.15 The department will continue to enhance cost visibility through a phased and risk-based approach, prioritising high-value and high-risk activities. Bottom-up costing and process-level analysis will be applied selectively where the benefits outweigh the administrative and system costs, consistent with proportionality principles in RMG 302. While this approach focuses on monitoring the efficiency of costs, it is less likely that the outcomes will result in cost reductions for industry given the administrative burden in monitoring costs at this granular level, which would need to be included in the cost base.
Accurately measure and assign costs to outputs and business processes
2.16 The CRP states that ‘Once entity staff have broken down the activity into outputs and related business processes, the relevant costs need to be identified and attributed to the outputs and processes’. It explains that:
The approach used to cost the activity, and the level at which it is costed (e.g. activity, output or process), should be proportional to the complexity, materiality and sensitivity of the activity and be based on clear methods for:
- categorising costs into direct and indirect costs
- measuring direct and indirect costs
- attributing costs to the activity processes and outputs.37
2.17 RMG 302 notes that ‘there are several options for demonstrating costs’. It outlines two techniques for identifying outputs and business processes:
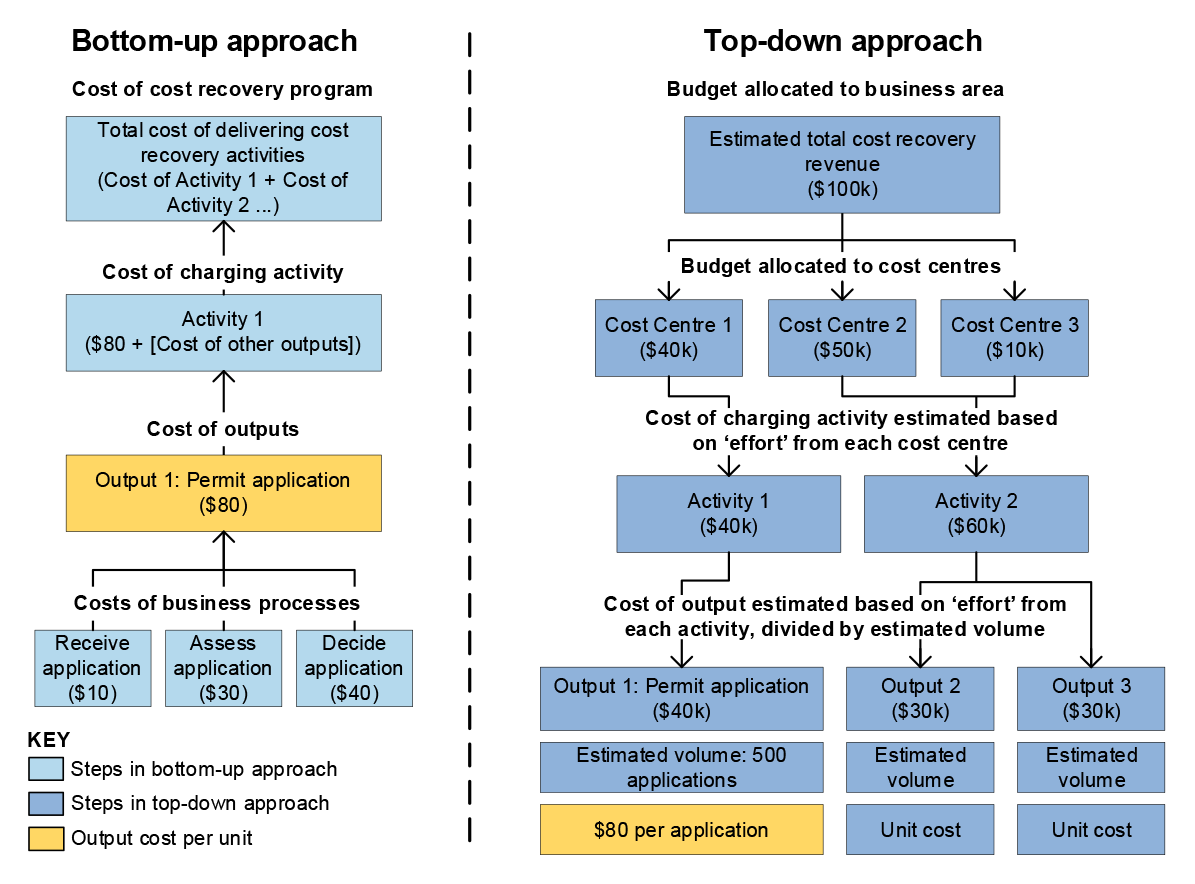
- a ‘bottom-up approach’, which ‘attributes cost, effort, and resources per unit output to determine the unit cost’ and then aggregates this to get the total cost for the cost recovery program; and
- a ‘top-down approach’, which uses the total cost of the cost recovery program and ‘divides it by expected demand “down” to get an average output cost’.38
2.18 Figure 2.4 illustrates the two approaches, adapting an example from RMG 302.
2.19 RMG 302 states that ‘entities are encouraged to consider using the “bottom-up approach” as it enables the price to be based on the minimum efficient cost for delivery of actual activity, not the average cost.’39 It explains that:
In addition, a ‘top-down approach’ does not capture the effort variation between users for the same output or the difference between average expense and actual cost.
Using a ‘bottom-up approach’ provides transparency that assists in avoiding:
- cross subsidisation between users
- charging being perceived as taxation (for example, charging an individual more than the cost of the output the individual caused).40
Figure 2.4: Cost modelling approaches
Source: Adapted by the ANAO from RMG 302, Figure 3.
2.20 Generally, as RMG 302 states, using the ‘bottom-up approach’ would produce a more accurate calculation of costs, as it would involve calculating the costs of individual tasks or process steps required to produce a certain output, and aggregating this to calculate the activity’s total cost. This approach also supports greater efficiency, as it allows the entity to consider the cost of its existing business processes and how they contribute to the unit costs of outputs, as well as whether they can be made more efficient.
2.21 As outlined at paragraph 2.10, DAFF has not disaggregated its outputs into ‘business processes’ used to produce those outputs, as would be required for a ‘bottom-up’ costing approach. Instead, DAFF uses the ‘top-down’ approach to determine the unit cost of each output — by allocating estimated costs down from relevant cost centres to outputs via a percentage-based estimation of ‘effort’, divided by estimated volume of demand for the activity.
2.22 As the estimated cost of DAFF’s outputs are not based on detailed costing of the key business processes of each output, the importance of the accuracy of its effort estimates increases. There is a risk that, if the assumptions underlying the effort allocations are misaligned with practice (for example, if an activity requires greater effort than estimated), the costs of the relevant outputs may not be reflective of actual costs. This would result in either under-recovery (cost is greater than estimated), or over-recovery (cost is less than estimated).
2.23 Recent reviews of DAFF’s charging model (see paragraphs 2.89 to 2.94) indicate that the risk of inaccurate cost estimation may have been realised for some biosecurity fees and charges. In July 2024, DAFF commissioned41 the development of a pilot ‘bottom-up’ costing approach to compare the costs set by DAFF in its CRIS, against the likely actual costs of delivering the relevant activities for two biosecurity functions: Post Entry Quarantine (PEQ) and Import Permit Assessment (the pilot) (see paragraphs 2.91 to 2.94).
2.24 The pilot found that there was broad under-recovery across both biosecurity functions, with actual costs for most of the activities likely higher than the costs calculated via DAFF’s current ‘top down’ costing approach. For example, the daily husbandry fee for a cat in post-entry quarantine in 2024–25 was set at $52 per day, but the pilot estimated that the actual cost of undertaking husbandry tasks for a quarantined cat by DAFF biosecurity officers was $105 per day.
2.25 Examples of how DAFF’s cost centre managers may estimate ‘effort’ include:
- Time spent by FTE on activities
- Volumes of item codes processed
- Timesheets or other timekeeping system.
2.26 Reliance on management estimates of effort rather than more evidence-based methods, such as time and motion studies, may increase the risk of inaccuracy of estimated costs. This risk is further increased if the way the effort is estimated is not consistent for cost centres that are delivering similar activities. In Auditor-General Report No. 38 2018–19 Application of Cost Recovery Principles, the ANAO noted that ‘[e]ffort data that are based on management estimates are not evidence-based. Ideally, timesheet data capture should be used to validate all driver data.’
2.27 DAFF advised the ANAO in June 2026 that ‘the benefits of more detailed timekeeping data or time and motion studies must be weighed against the cost of implementing such measures, which would ultimately be passed on to industry’.
Recommendation no.2
2.28 The Department of Agriculture, Fisheries and Forestry improve the accuracy of effort-based cost drivers that are used to inform the allocation of costs, including ensuring consistency in estimation methods between cost centres, where appropriate.
Department of Agriculture, Fisheries and Forestry response: Agreed.
2.29 The department acknowledges the need to continue to strengthen the processes that support the accuracy and consistency of effort-based cost drivers. The department notes that management estimation remains an accepted and necessary approach in environments where direct measurement is not always feasible, as evidenced in the charging framework.
2.30 The department’s current cost recovery improvement program will strengthen standardisation, documentation, quality assurance and supporting evidence, while maintaining a proportionate approach that reflects operational realities and system capability.
2.31 In April 2026, DAFF advised the ANAO that it is currently planning a project to review and enhance its processes supporting the estimation of effort. DAFF advised that the project is expected to commence in April 2026 (see paragraphs 2.95 to 2.96).
Track the degree of alignment between expenses and revenue
2.32 As outlined in paragraph 2.4, DAFF uses the Excel-based CRIS model for cost modelling and planning, and the Oracle system for tracking and reporting on actual expenses and revenue. In March 2026, DAFF advised the ANAO that the reports from the Oracle system are considered ‘the single source of truth for cost recovery revenue and expense’.
2.33 DAFF extracts monthly reports on cost recovery expenses and revenue from the Oracle system, which are collated into a CFO report provided to the Executive Board to track the financial performance of cost recovery arrangements. Reporting arrangements are examined further at paragraphs 3.60 to 3.70.
2.34 Using two different tools for planning and monitoring increases the risk of inaccuracies in the tracking of estimated costs and actual expenses and revenue, due to possible misalignment in cost drivers between the Oracle system and the CRIS model. For example, this misalignment could occur due to irregular updates of the Oracle system following changes to the CRIS model (or vice versa), human error when inputting updated data, or other differences in assumptions between the two systems.
2.35 The findings of DAFF’s June 2024 review of its cost model (see paragraphs 2.89 to 2.90) indicate that this risk may have been realised. The review concluded that there were ‘divergences in driver allocation rules’ between the CRIS model and the Oracle system, which resulted in a number of biosecurity cost centres ‘having program drivers which are not reflective of current actual underlying activity’. Examples of divergences included ‘similar activities not being allocated consistently across the program, or allocations not being carried over across models following the transfer of functions within the program’.
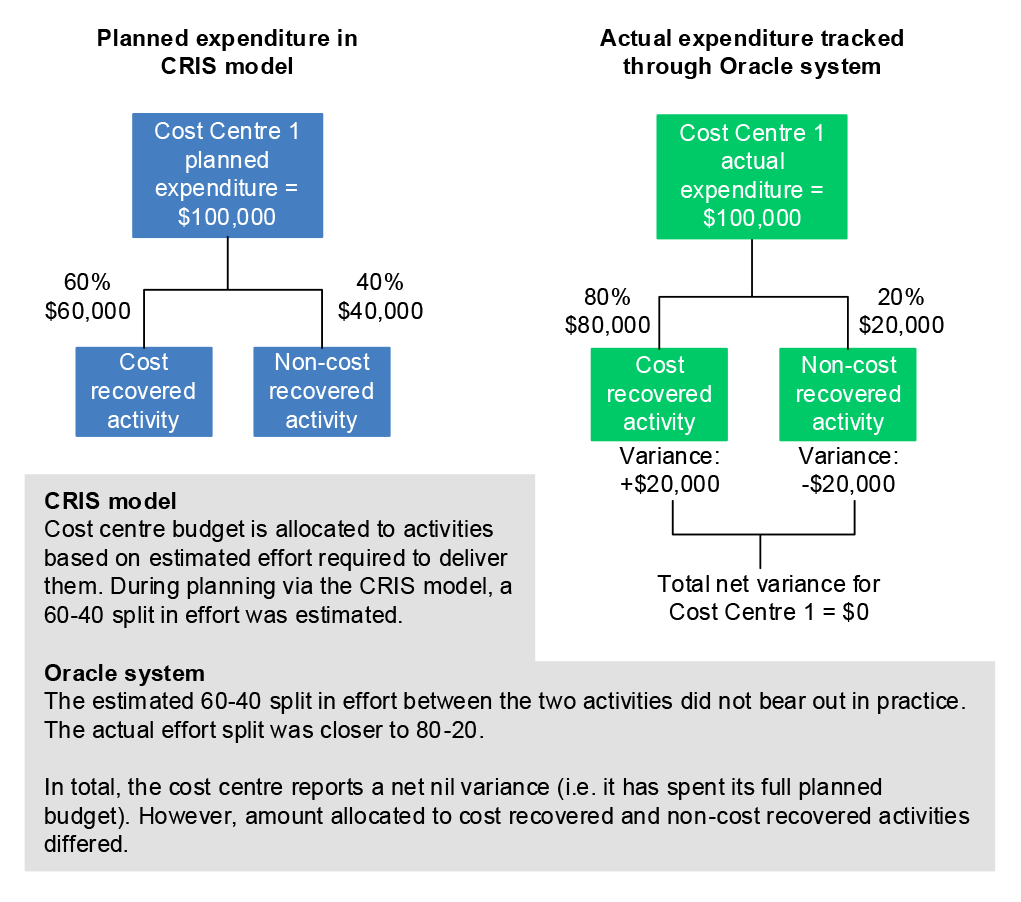
2.36 Figure 2.5 illustrates an example of how a variance between planned and actual cost recovery might occur due to cost driver misalignments between the CRIS model and the Oracle system.
Figure 2.5: Example of how variance could occur due to cost driver misalignments
Source: ANAO adaptation of variance example in June 2024 review report.
2.37 In the example at Figure 2.5, during CRIS planning, DAFF may estimate that 60 per cent of planned expenditure for a cost centre is cost recoverable and 40 per cent is not and would therefore be funded by appropriations. However, the split between the actual expenditure was 80 per cent cost recoverable and 20 per cent not cost recoverable. This may be due to the Oracle system having more contemporary driver information reflective of the actual effort than the CRIS model — resulting in misalignment between planned and actual expenditure.
2.38 In the example at Figure 2.5, the overspend in cost recovery activity was offset by a corresponding decrease in appropriations-funded expenses, resulting in net nil variance for the cost centre overall. If, for instance, similar patterns of misalignment exist for other cost centres, it may be difficult for DAFF to determine why there has been an overspend (or an apparent under-recovery) if variations are not apparent at the cost centre level.
2.39 The issue grows more complex if there are also differences in overall expenditure. For example, Cost Centre 1 may only spend $75,000 instead of the expected $100,000, due to slower recruitment or procurement than expected, or lower than expected volume of activities. Then the cost driver variation may allocate this expenditure in a way that does not reflect the estimated 60-40 split (if this is not revisited in the variation), resulting in unexpected levels of variation in cost recovered and non-cost recovered activities, and for the cost centre overall.
2.40 In July 2024, DAFF implemented a ‘retrospective reallocation of costs (true-up)’ for the 2023–24 financial year. This included amending cost allocations for 12 cost centres, following consideration of the June 2024 review’s findings; as well as another four cost centres, following the ‘standard end of year’ true up process, which comprises the ‘review of cost drivers where the effort appears to diverge significantly from the approved cost driver’.
2.41 DAFF also updated the 2024–25 cost drivers for the above cost centres, using the 2023–24 actual activity as a proxy for estimated effort for 2024–25.
2.42 On 18 February 2026, DAFF engaged Xaana.AI for the provision of a new costing system.42 In the approval minute, DAFF identified the risks and limitations of its current system, explaining that:
The Department’s current Activity Based Costing (ABC) system is an Oracle-based solution that has reached end-of-life and is no longer supported. The system requires substantial manual intervention, relies on multiple disconnected applications, and integrates poorly with TechnologyOne CiA (TechOne). In addition, a separate Excel-based cost model is required for cost modelling and pricing activities, increasing the administrative burden and the potential for error.
…
The limitations of the current ABC system, particularly its manual processes, lack of automation, and limited integration pose ongoing risks to data accuracy, timely reporting, and compliance with cost recovery requirements.
2.43 The approval minute outlined DAFF’s plans to address these risks and issues through the procurement of a new system:
To address these issues, the Department has approached the market for a modern, automated ABC solution that seamlessly integrates with TechOne. A contemporary solution will streamline cost allocation, reduce manual data entry, and enhance the accuracy and reliability of cost modelling and financial reporting. Improved automation and integration will also reduce the risk of human error associated with multiple manual touchpoints and spreadsheet-based modelling.
2.44 In May 2026, DAFF advised the ANAO that work on the ‘ABC2 Project’ was in progress.
Price model
2.45 The Australian Government Charging Policy (AGCP) states that:
Once the decision to charge is made, the type of activity will influence the pricing model that should be used. This will also need to take account [sic] other government policy considerations (e.g. community service obligations may result in a subsidised price).43
2.46 The AGCP outlines two pricing models for regulatory activities: cost recovery fees; and cost recovery levies. Depending on government policy, entities may recover the full or partial costs of administering their regulatory activities via charging fees, levies, or both. Table 2.2 summarises the definition of cost recovery fees and levies, and examples of each.
Table 2.2: Cost recovery fees and levies
|
Type of charge |
Definition from AGCP |
Examples from CRP |
|
Cost recovery fees |
A charge for a good, service or regulation (in certain circumstances) to a specific individual or organisation. |
|
|
Cost recovery levies |
A charge imposed when a good, service or regulation is provided to a group of individuals or organisations rather than to a specific individual or organisation. A cost recovery levy is a tax and is imposed via a separate taxation Act. It differs from general taxation as it is ‘earmarked’ to fund activities provided to the group that pays the levy. |
|
Source: ANAO summary of cost recovery fees and levies.44
2.47 DAFF uses both cost recovery fees and levies (which it calls charges) in its biosecurity price model. The 2025–26 Biosecurity Cost Recovery Implementation Statement (CRIS) states that ‘The Australian Government continues to affirm full cost recovery as the appropriate level of cost recovery from regulated entities through the portfolio budget statements and budget processes each year.’45
2.48 Relevant authorising legislation contains a specific list of ‘fee-bearing activities’, that can be charged a fee, and biosecurity matters that can be recovered via a charge (levy). DAFF publishes a list of current fees and charges annually alongside its CRIS.46 A high-level summary of the biosecurity activities funded through fees and charges is in Table 2.3.
Table 2.3: Biosecurity cost recovery activities by charge (levy) or fee
|
Charges (levy) |
Fees |
|
|
Note a: Listed in 2025–26 Biosecurity Cost Recovery Implementation Statement.
Source: Biosecurity cost recovery activities listed in Table 2 of the 2023–24, 2024–25 and 2025–26 Biosecurity Cost Recovery Implementation Statements.47
Alignment with government policy
2.49 The CRP outlines five elements that cost recovery charges ‘should’ meet.48 Table 2.4 summarises the ANAO’s analysis of DAFF’s price model against the key elements in the CRP.
Table 2.4: ANAO assessment of DAFF’s price model
|
Element |
Rating |
ANAO assessment |
|
Clear and easy to understand |
◆ |
DAFF’s biosecurity CRIS sets out the prices for its biosecurity regulatory activities in a table format which is clear and easy to understand, specifying: the type of charge; estimated total cost to the department; the service being charged to users; unit of measurement; price per unit; estimated volume; and estimated total revenue. |
|
Closely linked to the specific activity |
▲ |
DAFF has assigned costs to outputs for specific activities but has not mapped or assigned costs to the key business processes required to deliver the output to a specific individual or organisation (for fee-for-services), or group of individuals or organisations within a sector (for charges/levies). DAFF determines the unit cost (and price) of each output by allocating estimated costs down from relevant cost centres to outputs via a percentage-based estimation of ‘effort’, divided by estimated volume of demand for the activity (see Figure 2.2). This increases the risk that the price being charged may not closely link to the actual costs of delivering the specific cost recovery activity. For more detail, see paragraphs 2.50 to 2.52. |
|
Set to recover the full efficient costs of the specific activity, or at the level set by the Australian Government if partial cost recovery has been agreed |
▲ |
Biosecurity is intended to recover the full efficient costs of its activities.a DAFF has assigned costs to outputs for specific activities but has not mapped or assigned costs to key business processes that are used to deliver the output. This limits DAFF’s visibility of the cost of delivering specific activities and increases the risk that the costs of its outputs (and ultimately the prices charged to users) may not represent the minimum efficient costs of delivering its activities. For more detail, see paragraphs 2.9 to 2.31 and paragraphs 2.53 to 2.55. |
|
Efficient to determine, collect and enforce |
▲ |
DAFF’s Cost Allocation Policy states that ‘the department’s cost allocation methodology has been designed to ensure a balance between accuracy, efficiency of administration and transparency’. There is no evidence that DAFF has determined the cost of developing and implementing a more precise model or how this would compare with the current costs of administering its cost and price models. For more detail, see paragraphs 2.56 to 2.57. |
|
Set to avoid volatility, while still being flexible enough to allow for changes based on fluctuations in demand or costs |
▲ |
In 2023–24, indexation was introduced to allow biosecurity regulatory prices to be increased annually by the Consumer Price Index (CPI). Regular price increases via annual indexation may provide a measure of certainty for regulated entities. However, without a clear cost base representing the minimum efficient costs of delivering activities, there is a risk that indexation of prices could result in prices diverging from the actual costs of delivering the activity. This may result in more significant corrections and volatility in the future. For more detail, see paragraphs 2.59 to 2.63. |
Key: ◆ Fully aligns with CRP element; ▲ Partly aligns with CRP element; ■ Does not align with CRP element.
Note a: Department of Agriculture, Fisheries and Forestry, Biosecurity cost recovery implementation statement 2025–26, DAFF, Canberra, p. 2, available from https://www.agriculture.gov.au/about/fees/biosecurity-cris#daff-page-main [accessed 1 May 2026].
Source: ANAO analysis.
Closely linked to the specific activity
2.50 As detailed in Figure 2.2, DAFF determines the unit cost (and price) of each output by allocating estimated costs down from relevant cost centres to outputs via a percentage-based estimation of ‘effort’, divided by estimated volume of demand for the activity.
2.51 DAFF has not mapped or assigned costs to the key business processes required to deliver the output to a specific individual or organisation (for fee-for-services), or group of individuals or organisations within a sector (for charges/levies) via techniques such as process modelling or workflow analysis. This increases the risk that the price being charged may not closely link to the actual costs of delivering the specific cost recovery activity.
2.52 For example, one of DAFF’s fee-for-services, ‘Husbandry fee — cat or dog or animal not covered by another item of this table’, was charged at $52 per animal per day in 2024–25. This price is a percentage-based amalgamation of effort directed to the relevant activity-program by three cost centres, divided by expected volume of daily activities — rather than a breakdown of actual costs required to care for an animal in post-entry quarantine.
Set to recover the full efficient costs of the specific activity
2.53 DAFF has assigned costs to outputs for specific activities but has not mapped or assigned costs to key business processes that are used to deliver the output. This limits DAFF’s visibility of the cost of delivering specific activities and increases the risk that the costs of its outputs (and ultimately the prices charged to users) may not represent the minimum efficient costs of delivering its activities. For more detail, see paragraphs 2.9 to 2.31.
2.54 As noted at paragraph 2.23, recent reviews of DAFF’s charging model indicate that the risk of inaccurate cost estimation may have been realised for some biosecurity fees and charges, with the ‘bottom-up’ pilot modelling in 2024 (see paragraphs 2.91 to 2.94) finding that there was broad under-recovery across Post Entry Quarantine (PEQ) and Import Permit Assessment, with actual costs for most of the activities likely higher than the costs calculated via DAFF’s cost model.
2.55 This also limits DAFF’s ability to ensure and transparently demonstrate to its stakeholders that its cost recovered activities are being delivered at the minimum efficient cost.
Efficient to determine, collect and enforce
2.56 RMG 302 states that ‘For a regulatory activity, efficiency also relates to whether it is efficient to provide the activity on a charging basis (that is, the costs of administering charging should be proportional to the charges for and potential revenue from the activity)’.49 It explains that:
This requires a balance between developing a more precise, but more complex and hence more expensive costing model, and developing a simpler and less expensive, but less precise, costing model.50
2.57 DAFF’s Cost Allocation Policy states that ‘the department’s cost allocation methodology has been designed to ensure a balance between accuracy, efficiency of administration and transparency’. There is no evidence that DAFF has determined the cost of developing and implementing a more precise model or how this would compare with the current costs of administering its cost and price models.
2.58 In June 2026, DAFF advised the ANAO that its ‘bottom-up’ pilot modelling in 2024 (see paragraphs 2.91 to 2.94) ‘implies a rudimentary estimate for a complete review of the biosecurity cost recovery arrangement of comparable detail to be in the ballpark of $2.6m’. DAFF noted that ‘such activities come at a cost which if continued, would need to be included in the cost base and result in higher fees and charges.’
Set to avoid volatility, while still being flexible enough to allow for changes
2.59 RMG 302 states that ‘Entities should ensure that the price model has appropriate mechanisms in place to ensure that the decision on the price reflects any change in costs, including increases or decreases due to demand, indexation, process changes or technological developments’. It explains that:
This review of alignment of price to the decision should occur at least annually and on a shorter time frame where evidence exists that the price may not be reflecting the true cost of the effort.
2.60 In 2023–24, indexation was introduced to allow biosecurity regulatory prices to be increased annually by the Consumer Price Index (CPI). DAFF’s impact analysis statement for the change stated that the annual indexation:
should provide industry with a greater degree of certainty on the timing and value of price changes, as well as reduce the need for amendment of legislation each time prices change.
2.61 Regular price increases via annual indexation may provide a measure of certainty for the regulated entities. However, without a clear and accurate cost base representing the minimum efficient costs of delivering activities, there is a risk that indexation of prices could have little effect on long-term pricing certainty or even result in prices diverging further from the actual costs of delivering the activity.
2.62 For example, as outlined in paragraphs 2.91 to 2.94, DAFF commissioned51 the development of a pilot ‘bottom-up’ costing approach to compare the costs set by DAFF in its CRIS, against the likely actual costs. The pilot concluded that the daily husbandry fee for a cat in post-entry quarantine in 2024–25 was set at $52 per day, but its ‘bottom-up’ calculation of actual costs of undertaking husbandry tasks for a quarantined cat by DAFF biosecurity officers was $105 per day. Indexing the price may not make a significant difference if a large price correction is required in the future so that DAFF can fully recover its costs.
2.63 Conversely, if a price currently being charged is greater than the minimum efficient costs of delivering the activity, indexing the price annually will result in increasing divergence from the actual costs of delivering the activity. This may result in more significant corrections and volatility in the future.
Policies and procedures
2.64 The CRP states that ‘Accountable authorities are responsible for the implementation of cost recovered activities, consistent with the Australian Government policy approval, relevant legislation, the CRP and the broader resource management framework’.52 It explains that:
This involves:
- establishing internal controls (e.g. systems and procedures to monitor and report on the production of outputs of the activity against financial estimates and performance targets)
- ensuring that staff have the skills to manage the cost recovered activity and continue to improve those skills.53
2.65 DAFF has established some policies and procedures to guide the implementation of cost recovered activities. Its Accountable Authority Instructions (AAIs) provide a high-level overview of the department’s charging practices, which align with the Australian Government Charging Framework and Cost Recovery Policy. However, its key departmental cost recovery policy and guidelines are incomplete.
- The department’s Cost Recovery Policy, intended to outline the principles for recovering costs associated with the delivery of services and regulatory activities, was last updated in 2015. A draft new policy was created in 2025.
- The Departmental Charging Guidelines, intended to set out details of the specific requirements for cost recovery of activities, have been withdrawn since 1 July 2024 following concerns identified in an internal review.
2.66 In May 2026, DAFF advised the ANAO that its new Cost Recovery Policy would be finalised by 30 June 2026, and that new operational charging guidelines would be completed by November 2026. The absence of a clear policy outlining DAFF’s approach to cost recovery, especially following significant changes to cost recovery prices in 2023, leaves a gap in DAFF’s internal control framework relating to its regulatory arrangements. The lack of centralised and approved guidance for staff performing and charging for the relevant regulatory activities for an extended period of time increases the risks of staff reliance on unapproved and/or incomplete reference material.
Recommendation no.3
2.67 The Department of Agriculture, Fisheries and Forestry finalise its Cost Recovery Policy and the Charging Guidelines.
Department of Agriculture, Fisheries and Forestry response: Agreed.
2.68 The department notes that redevelopment of policy and guidance was intentionally sequenced following the 2023 reforms, to ensure alignment with updated cost recovery arrangements.
2.69 The department is expecting to finalise and implement the updated Cost Recovery Policy in June 2026 to consolidate existing practice, clarify roles and responsibilities, and strengthen internal controls.
Training
2.70 RMG 302 states that ‘Accountable authorities are responsible for the implementation of charging activities, consistent with the Government policy approval, PGPA Act and Rule, other relevant legislation, and the broader resource management framework’. It explains that this involves ‘ensuring that staff have the skills to manage the charging activity and continue to improve those skills’.54
2.71 In September 2025, DAFF developed a ‘Cost Recovery Introduction’ eLearning module for use in internal training programs. In May 2026, DAFF advised the ANAO that further cost recovery training modules had been developed and were scheduled for release in June and July 2026. DAFF also developed cost recovery guidance materials for publication on its intranet.
Is DAFF regularly reviewing and evaluating the effectiveness of its charging model?
DAFF reviewed the biosecurity cost recovery arrangement in 2021–22 and conducted three reviews regarding the effectiveness of its charging model in 2024. Reviews of the model identified risks related to the accuracy of DAFF’s cost estimates; transparency of its cost base; and cross subsidisation — where over recovery for some activities subsidises the under recovery of other activities. DAFF engaged with stakeholders regarding changes to biosecurity fees and charges. DAFF’s charging model limits its ability to ensure and transparently demonstrate to its stakeholders that its cost recovered activities are being delivered at the minimum efficient cost.
2.72 The AGCP states that ‘Government entities must regularly review and evaluate charges to assess their impact and whether they are contributing to government outcomes’.55 RMG 302 explains that:
Entities may need to make changes to their charging as a result of changes in cost inputs (increasing or decreasing), stakeholder feedback/changed in operating environment, policy changes or internal monitoring and evaluation.
…
Regular review, at least yearly, of the Cost Recovery Implementation Statement (CRIS) provides the information needed to start any change process. This approach provides the assurance on how the level of the actual charge aligns to the Government decision, relevant legislation and the minimum efficient cost of the effort of the Commonwealth entity.56
Review of Biosecurity Cost Recovery arrangement
2.73 From July 2021 to December 2022, DAFF conducted a ‘comprehensive review of the biosecurity cost recovery arrangement to determine adjustments needed to stabilise the cost base’ (2021–22 review). Prior to the 2021–22 review, the biosecurity cost recovery arrangement had last been reviewed in 2015.
2.74 The 2021–22 review included ‘surveying current effort for biosecurity activities, validating cost and effort data, and modelling the impacts on prices across all charge points to identify ‘the actual cost and effort needed to deliver activities as well as the significant financial and operational risk of a growing gap between costs and revenue’.
2.75 Between the 2015 and the 2021–22 reviews, fees and charges for biosecurity had largely remained static. The 2021–22 review found that the cost base had grown by $121 million from 2015–16 to 2023–24 (Figure 2.6). It proposed ‘changes to existing regulatory charging to align fees and charges with the actual cost to deliver biosecurity and imported food activities’ as well as ‘minor changes to charging legislation’ to provide ‘greater clarity and consistency in the application of certain charges’. The impact analysis for the proposed changes explained that:
The proposed price changes are needed to stabilise the biosecurity cost recovery arrangement and will close the forecast $35 million gap between cost and recovered revenue in 2023–24 and in the out years. Without these changes, the gap is expected to increase to around $53 million by 2026–27. This increasing gap is unsustainable and will impact delivery of existing regulatory activities and DAFF’s ability to manage the risk of pests and diseases entering the country. Failure in this context could have potentially devastating and costly consequences for the environment, our agricultural industries and market access for exporters.57
Figure 2.6: Components of the increase in the biosecurity cost base from 2015–16 to 2023–24
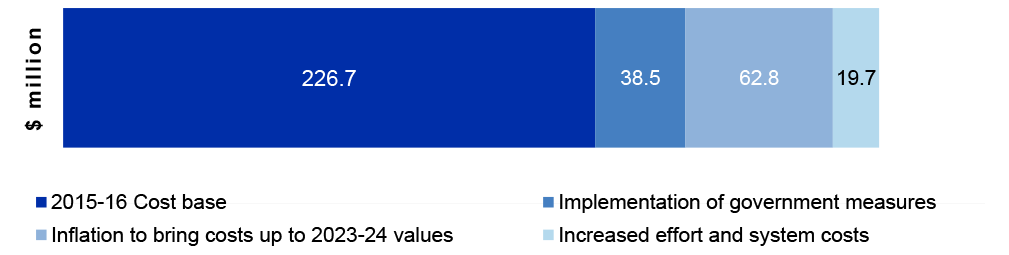
Source: Adapted from Graph 1 of the Changes to the regulatory charging for biosecurity activities impact analysis.58
2.76 The impact analysis noted that the ‘the actual and forecast change in total cost since 2015–16 is substantial and shows the rising cost to deliver regulatory activities’ (Table 2.5). It noted that Post Entry Quarantine (PEQ) users would be the most affected user group:
The PEQ stream is the most affected user group, with the cost to deliver PEQ activities increasing significantly since 2015–16. New PEQ facilities came online in 2015 providing state of the art laboratories and deliver a far superior bio-containment area than the previous multiple facilities located around Australia. Users of the new PEQ facilities will see the most substantial changes in prices, with plant importers and avian importers the most impacted.
The proposed increases are necessary to address a long period of increasing under recovery and transition towards sustainable cost recovery for all PEQ activities.
Table 2.5: Biosecurity cost recovery arrangement costs (million) by stream, 2015–16 to 2023–24
|
Stream |
2015–16 actual ($m) |
2021–22 actual ($m) |
2022–23 forecast ($m) |
2023–24 forecast ($m) |
Difference — 2016 vs 2023 (%) |
Difference — 2016 vs 2024 (%) |
|
Import clearance |
194.7 |
260.7 |
285.4 |
292.7 |
46.7 |
50.4 |
|
Seaport |
20.4 |
31.4 |
31.4 |
32.6 |
53.9 |
59.8 |
|
PEQ |
11.6 |
16.8 |
22.4 |
22.4 |
93.1 |
93.1 |
|
Total costs |
226.7 |
308.9 |
339.2 |
347.7a |
49.6 |
53.4 |
Note a: At the time the consultation paper was released, the total cost for the biosecurity cost recovery arrangement was forecast to be $348.8 million for 2023–24. During the development of the 2023–24 biosecurity cost recovery implementation statement and in response to stakeholder feedback, cost allocations for the biosecurity cost recovery arrangement were revised. This resulted in a reduction of $1.1 million in forecast costs to be recovered.
Source: Adapted from Table 1 of the Changes to the regulatory charging for biosecurity activities impact analysis.59
2.77 Key outcomes of the review included:
- the development of the CRIS model (see paragraph 2.4);
- the 2023–24 Biosecurity CRIS; and
- updated charging legislation.
2.78 The impact analysis stated that ‘DAFF recognises the magnitude of some proposed price changes is significant and the source of some of the strongest opposition from stakeholders’ and that:
To minimise the impact of future changes DAFF is committed to an annual review cycle to ensure costs and effort remain relevant. This process will allow for regular consideration of the effort and cost to deliver regulatory activities and for decreases in prices where effort reduces.
Annual CRIS cycle
2.79 DAFF has established an annual cycle for its biosecurity cost recovery arrangements. The cycle commences in August, with a post-1 July implementation review of the previous year and concludes in June with the publication of the new Cost Recovery Implementation Statement (CRIS) and new prices (Figure 2.7). More information about the CRIS is at paragraphs 3.64 to 3.66.
Figure 2.7: Annual CRIS cycle
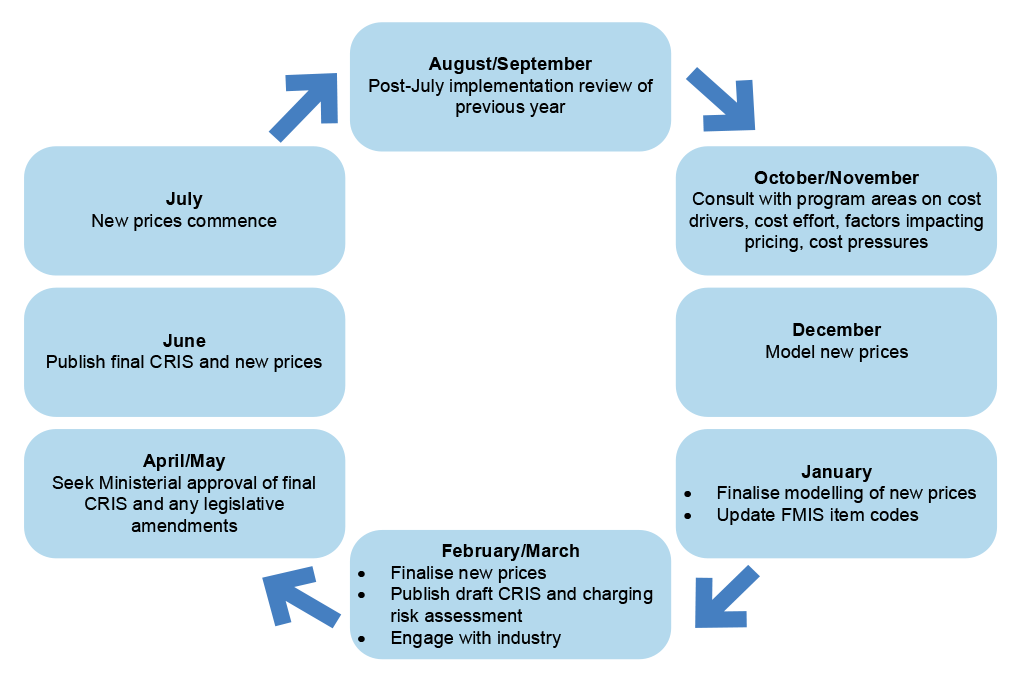
Source: ANAO summary of DAFF annual cycle for its biosecurity cost recovery arrangements.
2.80 The use of the CRIS model to calculate prices is examined at paragraphs 3.9 to 3.25. The prices for the 2024–25 CRIS were calculated by applying indexation to the 2023–24 prices and the prices for the 2025–26 CRIS were calculated by applying indexation to the 2024–25 prices (see paragraphs 3.32 to 3.37).
2.81 As prices were calculated using indexation in 2024–25 and 2025–26, the elements of the annual CRIS cycle regarding consultation with program areas to review the cost base and the modelling of new prices, outlined in in Figure 2.7, were not used to inform the cost estimates or prices for those years (see paragraph 3.36).
Portfolio charging reviews
2.82 The CRP states that ‘Departments of State must conduct periodic reviews of all existing and potential charging activities within their portfolios at least every five years, in accordance with the published schedule of portfolio charging reviews or at other times agreed by the Finance Minister’.60
2.83 The most recent Portfolio Charging Review (PCR) for the agriculture and water resources portfolio was concluded in 2019 and approved by the secretary on 16 April 2019, when the department was the Department of Agriculture and Water Resources. It found that ‘in light of existing reform effort, the portfolio has already undertaken significant improvements to the charging arrangements, and is generally well placed to continue to deliver further improvements’. It did not make any recommendations.
2.84 DAFF was scheduled to complete its next PCR in the 2025 calendar year, with reference to the 2024–25 financial year. The outcomes of the PCR are scheduled to be brought forward in the 2026–27 Budget. In May 2026, DAFF advised the ANAO that the PCR was not yet finalised.
Other reviews
2.85 DAFF has conducted three reviews of its cost recovery framework since May 2024. One, which was conducted by Chartertech, focused on the cost allocation process. The remaining two, conducted by Callida, focused on identifying the factors contributing to a divergence between cost recovered revenue and expenditure in 2023–24.
Cost allocation process review
2.86 Chartertech was engaged to assess DAFF’s ‘cost allocation process and reporting in the current Activity Based Costing system (ABC)’.61 The evaluation report was provided in May 2024. The report concluded that the ‘current model is comprehensive’ but ‘across the department there were varying levels of understanding of the cost recovery framework and how the current cost allocation model operates’.
2.87 Key themes from Chartertech’s engagement with DAFF users of the cost model included the need for greater clarity, transparency and accountability (particularly regarding corporate overhead cost allocations); and the timeliness of review and updating of cost drivers. The review made 13 recommendations, including educating staff regarding the department’s charging framework; reviewing the cost model’s governance arrangements; and enhancing transparency.
2.88 In May 2026, DAFF advised the ANAO that the recommendations of this review were being implemented through the procurement of a new system to replace the Oracle system (see paragraphs 2.42 to 2.44).
Review of cost model and ‘bottom-up’ pilot
2.89 Callida Consulting was engaged in March 2024 to review the cost model and ‘review and assess department actual activity costs, the drivers of activities, and identify material variances’.62 This was intended to assist the department to understand the factors contributing to a divergence between cost recovered revenue and expenditure in 2023–24 and to provide an initial view of areas for improvement to identify, understand and rectify future variations.
2.90 Callida delivered its report on 6 June 2024 (June 2024 review), making five observations and recommendations, including that:
There are divergences in driver allocation rules between the CRIS Model and the [Oracle system] used to plan and allocate costs within the Biosecurity function across regulatory and non-regulatory activities. This includes similar activities not being allocated consistently across the program, or allocations not being carried over across models following the transfer of functions within the program. This, and other factors, drive a variance created by the application of driver attributions, at a cost centre level.
Where the [Oracle system] driver is lower than the CRIS Model driver, this creates an underspend variance to the cost recovery budget. This is because greater cost is allocated to non-cost recovered activity than was expected in the budget. The opposite also applies.
2.91 In July 2024, Callida was re-engaged to create a prototype ‘bottom-up’63 activity-based costing model (the pilot).64 The pilot report was delivered on 17 October 2024. It explained that:
The current biosecurity ‘Top-down’ cost modelling environment does not provide a management tool to plan resource, understand the impact of volume variability, create greater efficiency, improve performance, or set pricing commensurate with the full cost of an activity. These attributes are all associated with managing sustainable operations, as well as the creation of a sustainable funding model.
…
‘Bottom-up’ [Activity-Based Costing (ABC)] uses the activity’s underlying process as the basis for understanding cost. Because costs are attributed to each task (process step) within an activity, there are many management benefits to ABC. Efficiency (or inefficiency) can be analysed and improved. Operational performance can be lifted, where better process is implemented, or where effectiveness is improved through multipliers such as technology. Transparency of the cost base, from process up to aggregate level, creates a high degree of cost consciousness, and can also be effectively used to inform and manage messaging used for stakeholder interactions. Furthermore, such a model allows decisions which support equity, policy delivery and simplicity of charging arrangements.
2.92 The pilot modelled two biosecurity functions, Post Entry Quarantine (PEQ) and Import Permit Assessment Functions, using a ‘bottom-up’ approach. The modelling found that there was ‘broad under recovery of PEQ’s cost base, as well as cross subsidisation between different streams within PEQ’, noting that ‘it appears that [PEQ] pricing may currently be set at an unsustainably low level.’
2.93 The modelling also found ‘under recovery of all Import Permit Streams’, explaining that ‘As with PEQ, this significant under recovery will be offset somewhere else in the Biosecurity, Operations and Compliance Group.’ The pilot concluded that:
This ‘Bottom-up’ ABC modelling activity, although only a prototype, has discovered many items which appear important to improving the Department’s financial and operational sustainability. It has described under-recovery, price points which are lower than unit cost, pricing structures which are incompatible and unaligned with the associated business process, and a potential commercial charging arrangement.
Although this report has not fully explored efficiency of cost, the models allow this examination because of the process mapping undertaken within each model for PEQ and Import Permits. Those processes can be examined and explored for opportunities to improve efficiency.
2.94 The pilot report made six recommendations, including that DAFF:
compare the benefits and disbenefits of its current ABC methodology with the ‘Bottom-up’ costing methodology described and demonstrated as part of this review.
Where a ‘Bottom-up’ approach is assessed to be the correct course of action, a rolling program plan should be constructed to determine the sequencing of biosecurity functions to be ‘Bottom-up’ costed (sequencing of functions to be costed could be prioritised by revenue share, business complexity, size and cross-function synergy).
Where pragmatic and achievable, the results of the extended rollout of the ‘Bottom-up’ cost modelling should be utilised as the lead tool to inform deeper process and efficiency analysis as part of considering broader resource planning and price settings.
Project to enhance effort estimation processes
2.95 In April 2026, DAFF advised the ANAO that it is currently planning a project to review and enhance its processes supporting the estimation of effort to inform the cost drivers used to estimate costs and prices. DAFF has identified six focus areas for uplift and improvement:
- ‘Cost Recovery teams have no visibility of Driver review workings to QA and confirm accuracy’;
- ‘No consistent template provided or used by Business teams when completing their Driver reviews’;
- ‘Business teams only reviewed their Program Drivers for the 2025–26 internal budget process’;
- ‘Service Drivers last reviewed during 2022–23 financial year (and have fixed splits) — business teams have no or limited visibility’;
- ‘Direct cost centres aren’t required to complete Driver reviews (no underlying ABC, no visibility regarding Direct v Variable costs)’; and
- ‘Depreciation and other significant non-staff costs (ICT Software) captured within Business team cost centres — directly impacting Driver review outcomes’.
2.96 DAFF further advised the ANAO that, as part of the project, it plans to develop templates to support cost centre managers to more accurately estimate effort to inform review of cost drivers and improve the accuracy of the cost model going forward. The templates will also provide a detailed record of how effort was estimated. This will act as a baseline, allowing for DAFF to better monitor changes in estimation of effort, as well as ensuring more consistency in how effort is measured across cost centres and across time. DAFF advised that the project was anticipated to commence in April 2026.
Stakeholder engagement
2.97 The CRP states that ‘entities should engage actively with stakeholders throughout all stages of the cost recovery process, from policy development through to implementation and review’.65
2.98 DAFF has established seven Industry Consultative Committees (ICCs)66 to represent industry views in relation to biosecurity and imported food:
- Avian Imports Stakeholder Group;
- Biological Consultative Group;
- Cargo Consultative Committee;
- Companion Animal Transport Industry Consultative Committee;
- Horse Industry Consultative Committee;
- Imported Food Consultative Committee; and
- Post Entry Plant Consultative Committee.67
2.99 The ICCs met between one and three times per year between 2022–23 and 2024–25. Issues raised by stakeholders in ICC meetings (regarding biosecurity cost recovery arrangements) between 2022 and 2025 included:
- the need for fair and equitable charges;
- expectations of improved services in return for increased charges;
- transparency of cost recovered fees and levies, and the model used to determine cost recovery charges;
- accuracy and efficacy of DAFF’s cost model and the underlying figures used;
- the need for stakeholders to be informed of changes as soon as possible; and
- the overall cost of cost recovery changes to industry.
2.100 As outlined in paragraphs 2.9 to 2.31, DAFF determines the unit cost (and price) of each output by allocating estimated costs down from relevant cost centres to outputs via a percentage-based estimation of ‘effort’, divided by estimated volume of demand for the activity. DAFF has not mapped or assigned costs to the key business processes required to deliver the output.
2.101 As outlined in paragraphs 2.50 to 2.52, this increases the risk that the price being charged may not closely link to the actual costs of delivering the specific activity. This also limits DAFF’s ability to ensure and transparently demonstrate to its stakeholders that its cost recovered activities are being delivered at the minimum efficient cost.
2.102 The Sustainable Biosecurity Funding Advisory Panel was announced on 28 February 2024, comprising representatives of 19 stakeholder organisations.68 The panel’s aim is:
to increase transparency of biosecurity funding and enable members to:
- provide genuine input into matters related to Commonwealth biosecurity funding and the Commonwealth’s contribution to Australia’s biosecurity system and
- provide feedback to the department about its biosecurity priorities, expenditure, and potential new funding streams.
Engagement regarding changes to biosecurity fees and charges
2.103 DAFF engaged with stakeholders regarding the proposed changes to biosecurity fees and charges during the development of the 2023–24 and 2024–25 biosecurity CRISs.
2.104 DAFF engaged with stakeholders regarding the proposed changes to biosecurity fees and charges during the development of the 2024–25 Self-Assessed Clearance (SAC) CRIS. DAFF engaged with stakeholders prior to the introduction of the SAC charge; however, a consultation draft of the CRIS was not released. In response to concerns raised by stakeholders, the start date for the SAC charge was changed from 1 July to 1 October 2024.
2.105 DAFF’s Cost Recovery Implementation Statements are examined at paragraphs 3.64 to 3.66.
3. Implementation of cost recovery
Areas examined
This chapter examines whether the Department of Agriculture, Fisheries and Forestry (DAFF) has effectively implemented its biosecurity cost recovery arrangements.
Conclusion
DAFF’s implementation of its cost recovery arrangements is partly effective. Eighty-one per cent of biosecurity prices were directly or largely69 informed by the calculations of DAFF’s charging model. DAFF did not advise the secretary or minister how biosecurity prices that were not directly informed by its model were calculated when seeking approval for the prices. These prices were then indexed for 2024–25 and 2025–26. DAFF’s biosecurity cost recovery revenue was higher than its expenses in 2023–24, 2024–25 and 2025–26.70 DAFF’s ability to effectively manage the risk of cross subsidisation is limited. It is not effectively managing the risks of under- or over-recovery. DAFF is publicly reporting on the financial and non-financial performance of biosecurity cost recovery.
Areas for improvement
The ANAO made three recommendations for the department to:
- consistently apply its charging model in the setting of cost recovery prices and inform decision-makers and stakeholders when prices are set outside of the model;
- ensure that the increase in prices delivered by the application of indexation aligns with the estimated cost of delivering biosecurity activities; and
- identify, assess and manage the risks relating to under- or over-recovery of cost recovery revenue.
3.1 The Australian Government Cost Recovery Policy (CRP) states that ‘the effectiveness of cost recovery involves the reliability and accuracy of the cost recovery model and related processes in measuring costs and reflecting those costs in the related charges’ and that ‘Effective cost recovery includes appropriate revenue management.’71
3.2 Chapter 2 considers the appropriateness and effectiveness of DAFF’s arrangements to support cost recovery for biosecurity activities, including the cost and price models, and identifies a number of risks that may limit the accuracy of DAFF’s cost estimates, including that:
- the ‘top-down’ approach limits DAFF’s visibility of the cost of delivering its activities and increases the risk that the costs of its outputs (and ultimately the prices charged to users) may not represent the minimum efficient costs of delivering its activities (see paragraphs 2.9 to 2.31);
- reliance on management estimates of effort rather than more evidence-based methods, such as detailed timekeeping data or time and motion studies, may increase the risk of inaccuracy of estimated costs (see paragraphs 2.22 to 2.31); and
- using two different tools for planning and monitoring increases the risk of inaccuracies in the tracking of estimated costs and actual expenses and revenue, due to possible misalignment in cost drivers between the Oracle system and the CRIS model (see paragraphs 2.32 to 2.44).
3.3 This chapter examines the implementation of these arrangements and how some of the risks identified above may be impacting the effective recovery of cost for biosecurity regulatory activities.
Is DAFF recovering the agreed costs of its regulatory activities?
Thirty-four per cent of the biosecurity prices set in 2023–24 were not directly informed by DAFF’s charging model’s calculations of the cost for the delivery of those activities. The secretary and minister were not advised that these prices were not directly informed by the model, or of the reasoning for not using the model’s calculations, when the department sought approval for the prices. The 2023–24 prices were indexed for 2024–25 and 2025–26. DAFF’s cost recovery revenue for biosecurity was higher than its expenses in 2023–24, 2024–25 and 2025–26.72 DAFF’s ability to effectively identify, understand and address areas of under- or over-recovery and effectively manage the risk of cross subsidisation is limited. Without clear identification and assessment of risks relating to cost recovery revenue collection, DAFF’s ability to effectively monitor and respond to risks of under- and over-recovery is limited.
3.4 The effective recovery of costs for biosecurity regulatory activities is directly connected to DAFF’s ability to effectively fund the delivery of these activities and therefore effectively manage biosecurity risks and assess the compliance of imported food.
3.5 The 2025–26 Biosecurity Cost Recovery Implementation Statement (CRIS) outlines DAFF’s reason for undertaking cost recovery for biosecurity and imported food regulatory activities:
The department undertakes cost recovery for biosecurity and imported food regulatory activities to support key government objectives:
- manage biosecurity risks arising from people, goods and conveyances (vessels and aircraft) entering Australia
- assess compliance of imported food with relevant food standards and public health and safety requirements.
The department’s regulatory activities occur onshore, offshore and at the border. These activities are associated with measures and controls to manage and minimise the risk of pests, weeds and diseases entering, emerging, establishing or spreading within Australia. This in turn facilitates trade and the movement of plants, animals, people and products. Imported food regulatory activities are associated with protecting public health and safety.73
3.6 It states that ‘The Australian Government continues to affirm full cost recovery as the appropriate level of cost recovery from regulated entities through the portfolio budget statements and budget processes each year.’74
Application of charging model
3.7 The ANAO tested a random representative sample of cost centres used in DAFF’s CRIS model (see paragraph 2.4 and Figure 2.2) and determined that the CRIS model was allocating costs to activity-programs and services in accordance with the ANAO’s understanding of its business rules.
3.8 In March 2026, DAFF advised the ANAO that the CRIS model separates costs relating to fees and costs relating to charges (levies) from the point at which costs are allocated to programs and activities (see Figure 2.2, Stage 3). The ANAO tested all of the biosecurity prices calculated by the CRIS model and determined that activity-programs that allocated costs to charges (levies) and activityprograms that allocated costs to fees did not overlap. This indicated that costs relating to charges (levies) and fees are separated in the model, as advised.
Use of the model to calculate prices
3.9 The CRP states that ‘There must be alignment between the expenses of the activity (the costs involved in providing it) and the revenue (the income generated through charges for it).’75
3.10 The 2023–24 Biosecurity CRIS states that DAFF uses a cost allocation process to determine the cost of its regulatory activities.76 This cost allocation process is reflected in DAFF’s CRIS model (see paragraphs 2.4 to 2.7 and Figure 2.2). DAFF uses the costs determined by the CRIS model to calculate unit prices for biosecurity fees and levies (see Figure 2.2, Stage 4).
3.11 A total of 53 price points were listed between the 2023–24 CRIS and accompanying list of fees and charges and calculated by the CRIS model.77 The ANAO compared the prices calculated by the CRIS model with the prices that were legislated and published in the 2023–24 CRIS. Of the 53 prices, 43 (81 per cent) were directly or largely informed by the calculations of DAFF’s charging model.
3.12 The results of this comparison are summarised at Table 3.1. Appendix 4 lists the results of this comparison against individual prices.
Table 3.1: Comparison of 2023–24 CRIS and modelled prices
|
Number of price points and (%) of total |
Results of comparison |
Alignment |
Potential impact |
|
35 (66) |
35 price points matched the amounts calculated by the model. |
▲ |
N/A |
|
8 (15) |
Eight price points (15 per cent) did not match due to the impacts of a change made to the model. DAFF made a decision not to update these prices in the CRIS (see 3.13 to 3.15). |
△ |
The prices published in the 2023–24 CRIS were between $5 less and $6 more than the amount calculated by the model after the error was rectified. 2023–24 actual volumes for these charge points ranged from 0 to 120,698. The impact of these differences was a loss to the Australian Government of approximately $354,336 in 2023–24. |
|
7 (13) |
For seven price points (13 per cent) an explanation was available, but key aspects of the final price calculation could not be explained. (see 3.16 to 3.21). |
▼ |
The importation chargesa for eggs and live birds published in the 2023–24 CRIS are $48,758 and $260,092 lower, respectively, than the prices calculated by the model. In 2023–24, two consignments of eggs and zero consignments of live birds were imported. For two prices (making up the importation charge for ruminantsb) the combined charge listed in the 2023–24 CRIS was $791 higher than the price calculated by the model. The husbandry fee for ruminants was $52 higher than the price calculated by the model. The estimated volume for ruminants was 0, indicating it is unlikely this charge has been collected by DAFF. The impact of these differences was a loss to the Australian Government of approximately $97,516 in 2023–24. |
|
3 (6) |
Three price points (6 per cent) did not match and DAFF was not able to provide a sufficient explanation for how the price point was determined (see 3.22 to 3.23). |
▽ |
The prices published in the 2023–24 CRIS ranged from $315 less to $159 more than the price calculated by the model. The 2023–24 volumes for all the prices DAFF was unable to sufficiently explain were zero, indicating these fees and charges were not collected and there was no financial impact. |
Key:
▲ Directly informed by the model (price matched the amount calculated by the model);
△ Largely informed by the model (price did not match due to a change to the model);
▼ Partly informed by the model (difference in price partly explained, but no evidence of how final price calculated); and
▽ Not informed by the model (no or insufficient explanation of how the price was determined).
Note a: Animal importation charges are made up of a reservation charge and a confirmation of reservation charge, which are charged separately but calculated together by the model as a single importation charge.
Note b: Examples of ruminants include cattle, goats, sheep, deer and antelopes.
Source: ANAO analysis.
Decision not to update prices impacted by correction
3.13 In March 2026, DAFF advised the ANAO that, following stakeholder consultation for the 2023–24 Biosecurity CRIS, an error in the model was identified which had ‘in effect, duplicated an intended cost base increase impacting horse importation prices’. This error was corrected and the horse importation charge was reduced. The change made to the model to correct this error, due to a shared cost centre, had minor impacts on eight importation and husbandry related fees and charges other than the horse importation charge.
3.14 DAFF further explained that the prices for these fees and charges were not updated in the CRIS for the following reasons:
The decision was made to not reflect these updated prices (which is what appears in version 2.2 of the model) in the final prices that went into the CRIS because:
1) There were no faults identified in the underlying assumptions for the importation and husbandry prices for companion animals and plants. Their change from the prices proposed in the consultation paper to the final version of the model was merely a by-product of rectifying a fault directed to horses; and
2) The changes to the importation and husbandry prices for companion animals and plants were minor and considered to be within the margins of uncertainty that the numerous assumptions that underlie cost base assumptions make up. That’s to say that a $1–$3 price difference could just as easily be realised by variances against actual spending, drivers or volumes that would reasonably be expected to eventuate; and
3) Industry and ministerial support had already been garnered for the prices put forward at consultation. Any changes to those prices would have required additional clearance, which could have jeopardised the project’s ability to be delivered on time. Further delays would have impacted the department’s financial sustainability, and thus it is appropriate to weigh these trade-offs against the goal of having perfect alignment between modelled prices and the final CRIS.
3.15 The briefs provided to the Secretary and Minister for approval of the CRIS and prices did not state that these prices had been impacted but would not be updated. These prices were indexed in 2024–25 and 2025–26 (see paragraphs 3.32 to 3.37).
Price differences with partial explanation
3.16 In March 2026, DAFF advised the ANAO that, for four prices relating to the importation of eggs and live birds, the full price calculated by the model was not applied ‘because the growth in price would have been unsustainable for industry’.
3.17 The department receives supplementation through the anti-smuggling appropriation to offset costs for avian imports, which is taken into consideration by the CRIS model when calculating the price. DAFF explained that ‘the gap is also an artefact of the anti-smuggling appropriation having not kept pace with the growth in the cost pool, which is an issue that has been noted in the portfolio charging review’. DAFF advised the Minister that these activities would not be fully cost recovered and stated that ‘under-recovered costs will continue to be met through other funding sources while a longer-term approach is developed’.
3.18 There was no evidence of how the final price was determined, beyond the decision not to use the full price calculated by the model. DAFF’s records do not explain the ‘other funding sources’ intended to be used to meet the under-recovered costs. As outlined in paragraphs 3.47 and 3.48, DAFF’s over-recovery in 2023–24 and 2024–25 indicates that there may be a risk that cross subsidisation is occurring due to over-recovery in some areas both offsetting areas where costs are under-recovered and overall generating more revenue than expenses.
3.19 The three costs (and prices) for ruminants78 are not calculated separately in the model. DAFF advised the ANAO in March 2026 that these prices are calculated using the price modelling for horses. The final prices for ruminants are higher than the prices for horses.
3.20 DAFF advised the ANAO in April 2026 that the daily husbandry fee for ruminants is ‘based on the modelling used for horses’, but that the ‘fee is set at a higher rate to reflect the nature of the activity the department undertakes for the different animal groups’. It explained that:
Husbandry for horses is generally undertaken by industry and, the department only has a supervisory role, therefore the effort and cost is less, departmental staff deliver the husbandry activity for ruminants this requires more effort, and the cost to deliver is higher which is reflected in the higher price.
3.21 It is not clear how the difference in effort and cost between horses and ruminants was calculated and as a result how the difference in the final price was determined.
Price differences without sufficient explanation
3.22 The importation charge for bees (consisting of two prices, the reservation charge and the confirmation of reservation charge) is listed at a lower price in the CRIS and legislation ($4,187) than the price calculated by the model ($4,502). In March 2026, DAFF advised the ANAO that ‘the decision to use the lower rate was made to retain a lower overall % increase to prices’.
3.23 Conversely, the husbandry fee for bees included in the CRIS and legislation ($469) was higher than the price determined by the model ($310). DAFF was not able to explain why this price was used but further advised that a bee consignment has not been imported since 2021.
Potential impact
3.24 For 2023–24, 66 per cent of prices charged directly reflected the prices calculated by DAFF’s charging model. Thirty-four per cent of biosecurity prices did not match DAFF’s charging model’s calculations of the cost for the delivery of those activities. There is no evidence that DAFF advised the secretary or minister that these prices did not match those calculated by the model, or of the reasoning for not using the model’s calculations, when seeking approval for the prices.
3.25 Animal and plant import figures for 2023–24 indicate that the financial impact of charging prices that did not match the cost model may have resulted in a loss to the Australian Government of approximately $452,000 in 2023–24.79 This comprises 0.12 per cent of the cost recovery revenue for biosecurity in 2023–24.
3.26 As discussed in Chapter 2, there are a number of risks that may limit the accuracy of DAFF’s charging model’s estimates of cost. However, there are increased risks of inaccuracy if prices are set outside of the charging model’s estimates. This also limits the transparency of prices, especially if the reasoning and decisions to set prices outside of the model are not well-documented or not communicated to decision makers and stakeholders.
Recommendation no.4
3.27 The Department of Agriculture, Fisheries and Forestry:
- consistently apply its charging model in the setting of cost recovery prices, to ensure that prices are informed by the estimated costs of delivering the activities; and
- document reasoning and inform decision-makers and stakeholders when prices are set outside of the model.
Department of Agriculture, Fisheries and Forestry response: Agreed in principle.
3.28 The department acknowledges that historical decisions to set prices outside of the model should have been more appropriately documented.
3.29 These decisions resulted in the under recovery of the cost of providing these services.
3.30 The variances in prices identified in this Report represent approximately 3.2% of the 2025–26 April year to date biosecurity cost recovered revenue. Consistent with the principles of ensuring prices reflect minimum efficient cost, some changes to prices were applied to more accurately reflect the estimated cost. This followed identification of minor errors through the department’s quality assurance process.
3.31 The department will continue to strengthen governance by ensuring any deviations from modelled prices are clearly documented, justified and communicated to decision-makers, while retaining flexibility to apply policy judgement where required.
Indexation
3.32 From 1 July 2023, the following legislation was amended to provide for prices to be indexed annually according to the Consumer Price Index (CPI):
- Biosecurity Regulation 2016;
- Biosecurity Charges Imposition (General) Regulation 2016;
- Biosecurity Charges Imposition (Customs) Regulation 2016;
- Imported Food Control Regulations 2019; and
- Imported Food Charges (Imposition — General) Regulation 2015.
3.33 The impact analysis for the change stated that this would ‘provide industry with a greater degree of certainty on the timing and value of price changes, as well as reduce the need for amendment of legislation each time prices change’.
3.34 For 2024–25, prices for biosecurity fees and levies were determined by applying indexation to the prices set for 2023–24. The ANAO applied indexation, as per the formula set out in legislation, to the 2023–24 prices and compared the result to the 2024–25 prices published in the 2024–25 Biosecurity CRIS. In all cases, the ANAO calculation matched DAFF’s published rate.
3.35 Indexation was also applied in 2025–26. The ANAO tested the application as outlined in paragraph 3.34 and in all cases, DAFF’s published rate was correctly indexed.
3.36 In approving the application of indexation to determine 2025–26 prices, DAFF’s Finance and Performance Committee (FPC) was informed that a more detailed review of prices beyond indexation could result in price increases of 14 to 17 per cent. The brief to the FPC noted that ‘Continue CPI-only increase [sic] are likely to see further misalignment between prices and costs. At an activity level, this could be perceived by industry as cross-subsidisation’ but recommended indexation on the basis that this would allow a longer lead time to review the cost base without the pressure of an election cycle.
3.37 DAFF recovered $13.9 million more than its biosecurity cost recovery expenses in 2023–24 and $20.5 million more than its expenses in 2024–25 (see paragraphs 3.43 to 3.49). As discussed in paragraphs 2.59 to 2.63, without regular review of the cost base (representing the minimum efficient costs of delivering activities) there is a risk that the indexation of prices could result in prices diverging from the actual costs of delivering the activity.
Recommendation no.5
3.38 The Department of Agriculture, Fisheries and Forestry ensure that the increase in prices delivered by the application of indexation aligns with the estimated cost of delivering biosecurity activities.
Department of Agriculture, Fisheries and Forestry response: Agreed.
3.39 The department will ensure that the increase in prices delivered by the application of indexation aligns with the estimated cost of delivering biosecurity activities.
3.40 Indexation was introduced and legislated to provide predictability, administrative efficiency and reduced regulatory burden, consistent with government policy intent.
3.41 The department is ensuring indexed prices are aligned with costs by incorporating periodic cost base reviews and monitoring for material divergence, rather than relying solely on indexation over extended periods.
3.42 As evidenced through the 2026-27 CRIS consultation, the department took a structured approach to reviewing fees and charges, including indexation. This resulted in a select number of fees and charges being increased above indexation, redundant fees being removed, and amendments to other charges being made to more accurately reflect regulatory effort. Without such reviews, it is more likely that costs will exceed indexation and under recovery will occur.
Expenses and revenue
3.43 The CRP states that ‘[t]here must be alignment between the expenses of the activity (the costs involved in providing it) and the revenue (the income generated through charges for it).’ It explains that:
Ideally, the expenses and revenue should be aligned on a yearly basis. However, where justified, they can be aligned over a longer period (e.g. the business cycle of the activity). Commonwealth entities should develop mechanisms (e.g. internal control systems) to manage any under- or over-recovery. There must not be systematic over- or under-recovery of costs.80
3.44 The CRP does not indicate what level of ‘alignment’ is expected, or what might constitute ‘systematic over- or under-recovery’ as opposed to reasonable fluctuations. As cost recovery fees and charges are set based on forecast expenditure, which is affected by factors such as changing volumes of demand and the global trade environment, it is expected that there will be some variations over the years. DAFF has not established its own acceptable level of variance between the expense and revenue of its cost recovered activities.
3.45 Following the changes made to the biosecurity cost recovery arrangements for 2023–24 (see paragraphs 1.15 to 1.18), DAFF’s cost recovery revenue for biosecurity has been higher than its expenses (Table 3.2). In June 2026, DAFF advised the ANAO that this occurred ‘as the department recovered from a period of austerity measures and low staffing levels’ and that ‘DAFF expects these surpluses will not continue’. DAFF explained that:
In 2023–24 this was driven by DAFF seeking to return to full staffing levels after a period of austerity measure [sic] that were in place for the end of 2022–23. In 2024–25 this was largely driven by unforeseen increases in demand in the recently introduce SACS pathway from 1 October 2024. This charge is recovered each quarter in arrears, creating a time delay before the department can respond to changes in demand.
Table 3.2: Variation between biosecurity cost recovery expenses and revenue, 2023–24 and 2024–25
|
Financial year |
Expenses ($) |
Revenue ($) |
Variation (revenue — expenses ($) |
Variation of expenses (%) |
|
2023–24 |
351,051,678 |
364,908,114 |
13,856,436 |
3.9 |
|
2024–25 |
408,259,389 |
428,807,799 |
20,548,410 |
5.0 |
Note: The internal reports containing the data presented in this table were provided to the ANAO by DAFF. This data has not been verified by the ANAO. Differences in expenses and revenue reported across different sources is examined in paragraphs 3.61 to 3.63.
Source: ANAO analysis of internal DAFF reporting of Oracle system data.
3.46 In June 2026, DAFF provided the ANAO with cost recovery financial reporting for 2025–26, as at April 2026. This report showed that DAFF’s year to date cost recovery revenue for biosecurity was $21.3 million higher than its expenses. The report forecast that, for the 2025–26 full financial year, cost recovery revenue for biosecurity would be $18.3 million higher than its expenses (Table 3.3).
Table 3.3: Variation between biosecurity cost recovery expenses and revenue, year to date 2025–26 (as at April 2026)
|
Period |
Expenses ($) |
Revenue ($) |
Variation (revenue — expenses ($) |
Variation of expenses (%) |
|
July 2025 to April 2026 (actuals) |
367,133,251 |
388,397,142 |
21,263,891 |
5.8 |
|
2025–26 (forecast) |
447,924,337 |
466,228,584 |
18,304,248 |
4.1 |
Note: The internal reports containing the data presented in this table were provided to the ANAO by DAFF. This data has not been verified by the ANAO. Differences in expenses and revenue reported across different sources is examined in paragraphs 3.61 to 3.63.
Source: ANAO analysis of internal DAFF reporting of Oracle system data.
3.47 Two financial years is not enough data to determine whether systemic over-recovery is occurring under the current arrangements. However, over-recovery in 2023–24 and 2024–25 and continued over-recovery forecast in 2025–26 may indicate that DAFF’s estimates of its costs and/or its calculation of prices were not accurate.
3.48 When DAFF’s ‘bottom up’ modelling pilot’s conclusion of ‘broad under-recovery’ in Post Entry Quarantine (PEQ) and Import Permit Assessments is considered (see paragraphs 2.89 to 2.94), DAFF’s over-recovery in 2023–24 and 2024–25 indicates that there may be a risk that cross subsidisation is occurring due to over-recovery in some areas both offsetting areas where costs are under-recovered and overall generating more revenue than expenses.
3.49 As discussed at paragraphs 2.50 to 2.52, DAFF has assigned costs to outputs for specific activities but has not mapped or assigned costs to the key business processes required to deliver the outputs, which limits its visibility of the cost of delivering its activities. This increases the risk that the estimated costs of its outputs (and ultimately the prices charged to users) may not accurately represent DAFF’s actual costs. This also limits DAFF’s ability to effectively identify, understand and address areas of under- or over-recovery and effectively manage the risk of cross subsidisation.
Risk of under- or over-recovery
3.50 One of DAFF’s nine enterprise risks relates to inadequate management of financial resources to achieve its strategic objectives (ER05). DAFF’s corporate plan outlines ‘key mitigations’ for the relevant risks. A key mitigation identified for ER05 in the 2025–26 corporate plan is to:
Manage the department’s cost-recovery arrangements in accordance with the Australian Government Charging Framework and the level of cost recovery set by government.
3.51 DAFF provides its Executive Board with quarterly updates on the status of its enterprise risks. As at quarter 2 of 2025–26 (November 2025), ER05 was rated as ‘low’ (a decrease from ‘high’ from the last report in March 2025) and the key mitigation relating to management of cost recovery arrangement was assessed as ‘fully effective’.
3.52 Although managing cost recovery arrangements is a key mitigation for ER05, it is not an enterprise risk in itself. The ANAO examined whether risks relating to cost recovery revenue collection (such as risks of under-recovery resulting in insufficient revenue, or of over-recovery resulting in damage to relationships with stakeholders and to the department’s reputation) were identified and being managed at the divisional level.
3.53 Of the 16 divisions examined by the ANAO:
- two had a division risk specifically addressing the risk of effectively administering a cost recovery arrangement in their 2024–25 divisional business plans;
- no division had a risk on administering or implementing cost recovery arrangements in their 2025–26 divisional business plans; and
- four divisions included cost recovery as a risk control against a broader risk relating to financial resourcing and budget in either 2024–25 or 2025–26, or both.
3.54 Without clear identification and assessment of risks relating to cost recovery revenue collection, DAFF’s ability to effectively manage the risk of under- and over-recovery is limited. This also limits its ability to monitor and respond to potential issues as they arise.
3.55 The monthly CFO reports provided to the Executive Board usually outline risks relating to cost recovery, such as cost recovery revenue being below budget or expenses being above budget.
3.56 Minutes of Executive Board meetings indicate that the Executive Board usually notes the status of the departmental budget as outlined in the CFO reports. The minutes do not generally reflect whether the Board is concerned about or comfortable with the relevant figures (and if concerned, whether any actions are required). The risks related to cost recovery listed in the CFO report, if discussed, are not reflected in the meeting minutes.
Recommendation no.6
3.57 The Department of Agriculture, Fisheries and Forestry assess the risks relating to under- or over-recovery of cost recovery revenue and apply appropriate controls and treatments to effectively manage these risks.
Department of Agriculture, Fisheries and Forestry response: Agreed.
3.58 The department monitors the financial results of all cost recovery arrangements on a monthly basis and reports these outcomes through existing established governance processes and Industry Consultative Committees.
3.59 The department will look to formally embed associated risks in divisional business plans. The department will continue to enhance formal identification, monitoring and escalation of cost recovery risks, including clearer tolerances and improved reporting to senior governance forums.
Is DAFF effectively reporting on its cost recovery activities?
DAFF is publicly reporting on the financial and non-financial performance of biosecurity cost recovery. DAFF’s biosecurity Cost Recovery Implementation Statements (CRISs) include the elements outlined in the Cost Recovery Policy and Resource Management Guide 302. Non-financial performance measures and results reported in the CRISs match information presented in DAFF’s annual reports. DAFF undertook Charging Risk Assessments for biosecurity cost recovery arrangements in 2023–24 and 2024–25. In 2023–24 and 2024–25, DAFF published Biosecurity Funding and Expenditure Reports.
3.60 The CRP states that transparency is about ‘openness, two-way communication and a willingness to explain activities and actions’.81 It explains that:
For cost recovery, transparency means documenting key information about the activity, such as the policy approval, statutory authority to charge and cost recovery model, in an accessible way for those who pay charges and for other stakeholders. It also involves reporting on performance for the activity on an ongoing basis.
…
Transparency is closely linked to accountability … In the cost recovery context, accountability involves ensuring that entities, their staff and the responsible Ministers are answerable for their actions and decisions in relation to cost recovery.82
Reporting of financial and non-financial performance
3.61 DAFF reports publicly on biosecurity cost recovery financial performance in the financial statements that are included in its annual reports83 (revenue only), cost recovery implementation statements84 and annual biosecurity funding and expenditure reports.85 Reporting of biosecurity cost recovery financial performance is largely consistent across the different documents (see Table 3.4 and Table 3.5).
Table 3.4: Reported biosecurity cost recovery revenue
|
Financial year |
Financial statement ($) |
Oracle ABC Report ($) |
Biosecurity CRIS ($)a |
Biosecurity Funding and Expenditure Report ($) |
|
2023–24 |
362,538,000 |
364,908,114 |
364,983,026 |
365,000,000 |
|
2024–25 |
425,101,000 |
428,807,799 |
428,807,799 |
428,800,000 |
Note a: 2023–24 figures were reported in the 2025–26 CRIS. 2024–25 figures were reported in the 2026–27 CRIS.
Source: ANAO comparison of DAFF documentation.
Table 3.5: Reported biosecurity cost recovery expenses
|
Financial year |
Financial statement |
Oracle ABC Report ($) |
Biosecurity CRIS ($)a |
Biosecurity Funding and Expenditure Report ($) |
|
2023–24 |
Not reported |
351,051,678 |
351,165,448 |
351,200,000 |
|
2024–25 |
Not reported |
408,259,389 |
408,259,389 |
408,300,000 |
Note a: 2023–24 figures were reported in the 2025–26 CRIS. 2024–25 figures were reported in the 2026–27 CRIS.
Source: ANAO comparison of DAFF documentation.
3.62 In April 2026, DAFF advised the ANAO that the minor variations were due to differences in the way the figures were calculated. It explained that:
Financial statement reports includes [sic] only revenue related to fees and levies, whereas Oracle ABC reports all revenue attributed to the cost recovery arrangement, including some appropriation (for example, the anti-smuggling measure for the PEQ).
The CRIS figures are point in time forecasts that set out expected revenue and corresponding expense, as CRIS publication for any given financial year will occur prior to the books for the previous financial year being settled.
3.63 DAFF advised that the Oracle ABC reports ‘are the single source of truth for cost recovery revenue and expense’.
Cost Recovery Implementation Statements
3.64 The CRP states that ‘Each cost recovered activity, regardless of financial value, must be documented in a cost recovery implementation statement (CRIS) before charges commence’.86 It explains that:
The CRIS is an explanatory document that provides key information on how cost recovery for a specific government activity is implemented. It reports how the activity is performing on an ongoing basis.87
3.65 The CRP and Department of Finance Resource Management Guide 302 (RMG 302) list elements that ‘each CRIS must include’, which are substantively similar but differently worded.88 DAFF’s biosecurity CRISs include the elements outlined in paragraphs 41 and 42 of the CRP; and RMG 302. Table 3.6 summarises the ANAO’s analysis of DAFF’s biosecurity CRISs against these elements.
Table 3.6: Alignment between DAFF CRIS and CRP elements
|
Element |
2023–24 CRIS |
2024–25 CRIS |
2024–25 Self-assessed clearance CRIS |
2025–26 CRIS |
|
Background information on the cost recovered activity, including the outputs that the activity will produce to achieve government policy outcomes |
◆ |
◆ |
◆ |
◆ |
|
Description of the activity and of the stakeholders who pay charges, or may be affected by the charges, for the activitya |
◆ |
◆ |
◆ |
◆ |
|
Details of the Australian Government policy approval to cost recover the activity |
◆ |
◆ |
◆ |
◆ |
|
Details of the legislation authorising the charges |
◆ |
◆ |
◆ |
◆ |
|
An explanation of how the activity was costed |
◆ |
◆ |
◆ |
◆ |
|
An explanation of the design of cost recovery charges |
◆ |
◆ |
◆ |
◆ |
|
An assessment of cost recovery risk |
◆ |
◆ |
◆ |
◆ |
|
The stakeholder engagement strategy, including a summary of the most recent consultation and stakeholder views |
◆ |
◆ |
◆ |
◆ |
|
Financial estimates for the activity (i.e. expenses and revenue)b |
◆ |
▲b |
▲b |
▲b |
|
Reporting on financial and non-financial performance of the activity |
◆ |
◆ |
N/Ac |
◆ |
|
Key forward dates and events, including the next portfolio charging review |
◆ |
◆ |
◆ |
◆ |
|
Certified by the accountable authority of the entity |
◆ |
◆ |
◆ |
◆ |
|
Approved by the responsible minister |
◆ |
◆ |
◆ |
◆ |
|
Agreed for release by the Finance Minister, if the cost recovery risk rating for the activity is high |
N/Ad |
N/Ad |
N/Ad |
N/Ad |
|
Published on the responsible entity’s website before charging commences for the activitye |
◆ |
◆ |
■e |
◆ |
Key: ◆ indicates element was met; ▲ indicates element was partly met; and ■ indicates element was not met.
Note a: This element is only listed in RMG 302, not the CRP.
Note b: RMG 302 specifies that financial estimates should be included for the current financial year and three forward years. In the 2024–25 and 2025–26 Biosecurity CRISs and the 2024–25 Self-assessed clearance CRIS, financial estimates only cover two forward years.
Note c: As this was the first year of this charge, it was not possible to include past performance information.
Note d: The risk rating per the charging risk assessment was medium.
Note e: This element is only listed in RMG 302, not the CRP. Charging commenced on 1 October 2024, and the CRIS was published on 11 October 2024.
Source: ANAO comparison of publicly available documentation.
3.66 Non-financial performance measures and results reported in the CRISs match information presented in DAFF’s annual reports.
Charging Risk Assessment
3.67 During the development and review of the CRIS, a Charging Risk Assessment (CRA) is undertaken. The CRP states that ‘a key element of planning, designing and managing cost recovered activities is to identify and engage with risk at each stage of the cost recovery process’. Charging Risk Assessments (CRA) are used ‘to identify areas of implementation risk and inform the risk engagement strategy adopted by the entity’. RMG 302 explains that:
- For new regulatory charging, ‘a risk assessment must be undertaken and incorporated into the new policy proposal (NPP)’. The risk rating for regulatory charging is agreed with the Department of Finance (Finance) as part of the policy proposal process.
- For existing regulatory charging, ‘a risk assessment informs the approval process for any proposed changes to the policy authority and/or legislation’.
3.68 RMG 302 states that ‘the entities self-assessment rating of risks associated with materiality, complexity and sensitivity for any new or amended charging activity must be agreed with Finance’ and that ‘the agreed CRA rating determines the processes required for release of the CRIS’.
3.69 DAFF undertook CRAs for biosecurity cost recovery arrangements in 2023–24 and 2024–25 using the CRA template. The overall risk rating in both years was ‘medium’. Finance agreed with the risk rating for DAFF’s biosecurity CRAs in 2023–24 and 2024–25.
Other reporting
3.70 In 2023–24 and 2024–25, DAFF published Biosecurity Funding and Expenditure Reports.89 The reports included information on current biosecurity activities, funding sources for the biosecurity budget, amounts and sources of biosecurity expenditure, and the variance between budget and actuals for each year. The reports are not specific to cost recovery, but explain activities which are funded or partly funded through cost recovery.
Appendices
Appendix 1 Entity responses
Appendix 2 Improvements observed by the ANAO
1. The existence of independent external audit, and the accompanying potential for scrutiny improves performance. Improvements in administrative and management practices usually occur: in anticipation of ANAO audit activity; during an audit engagement; as interim findings are made; and/or after the audit has been completed and formal findings are communicated.
2. The Joint Committee of Public Accounts and Audit (JCPAA) has encouraged the ANAO to consider ways in which the ANAO could capture and describe some of these impacts. The ANAO’s corporate plan states that the ANAO’s annual performance statements will provide a narrative that will consider, amongst other matters, analysis of key improvements made by entities during a performance audit process based on information included in tabled performance audit reports.
3. Performance audits involve close engagement between the ANAO and the audited entity as well as other stakeholders involved in the program or activity being audited. Throughout the audit engagement, the ANAO outlines to the entity the preliminary audit findings, conclusions and potential audit recommendations. This ensures that final recommendations are appropriately targeted and encourages entities to take early remedial action on any identified matters during the course of an audit. Remedial actions entities may take during the audit include:
- strengthening governance arrangements;
- introducing or revising policies, strategies, guidelines or administrative processes; and
- initiating reviews or investigations.
4. In this context, the below actions were observed by the ANAO during the course of the audit. It is not clear whether these actions and/or the timing of these actions were planned in response to proposed or actual audit activity. The ANAO has not sought to obtain assurance over the source of these actions or whether they have been appropriately implemented.
- On 18 February 2026, DAFF procured a new costing system (see paragraphs 2.42 to 2.44).
- In April 2026, DAFF advised the ANAO that it is currently planning a project to review and enhance its processes supporting the estimation of effort. DAFF advised that the project is expected to commence in April 2026 (see paragraphs 2.95 to 2.96).
- In May 2026, DAFF advised the ANAO that further cost recovery training modules had been developed and were scheduled for release in June and July 2026. DAFF also developed cost recovery guidance materials for publication on its intranet (see paragraph 2.71).
Appendix 3 Charging Framework policies and guidance
1. The Charging Framework consists of the Australian Government Charging Policy (AGCP)90 and the Australian Government Cost Recovery Policy (CRP).91
2. The CRP ‘set[s] out the overarching framework under which Commonwealth entities design, implement and review cost recovered activities provided on behalf of the Australian Government’. The Department of Finance’s Resource Management Guide92 302 (RMG 302)93 provides guidance to entities on implementing the Australian Government Charging Framework.
3. The ANAO has identified issues in the charging framework policies and guidance, including inconsistencies in the terminology used in the documents; inconsistencies regarding mandatory and non-mandatory requirements; and the structure of the charging framework. See Table A.1.
4. Finance is undertaking a review of the cost recovery framework and its supporting guidance. In March 2026, it advised the ANAO that ‘The current review of the Charging Framework seeks to ensure that the policies are fit for purpose and improve the guidance where possible.’ Finance advised that:
Stakeholder consultation is completed on the current review of the Charging Framework. Finance is now seeking to provide the results of the consultation of the draft revised policy to the Minister for Finance for agreement in the first half of 2026.
Table A.1: Issues identified in Charging Framework policies and guidance
|
Issue |
Examples |
|
Inconsistency in terminology |
The three documents use different terminology and contain slightly different definitions for the same terms. Example 1: Models that inform government charging activities
Example 2: Defining the relationship between charges and costs
Example 3: Requirements for Cost Recovery Implementation Statements (CRISs)
|
|
Mandatory and non-mandatory requirements |
RMG 302 provides guidance on implementing the Cost Recovery Policy and the Charging Policy, including the requirements detailed within these policies. However, there are instances where RMG 302 indicates that a matter is mandatory (‘must’), where the matter is not mentioned in the policies or the policies indicate they are non-mandatory (‘should’). Example 1: Frequency of review and indexation
At times, a document is inconsistent with itself as to whether a matter is mandatory (‘must’) or non-mandatory (‘should’). Example 2: Publication of CRIS
Example 3: Undertaking risk assessment for changes to arrangement
There are also instances where it is ambiguous as to whether a matter is mandatory or non-mandatory. Example 4: Developing a detailed charging model
|
|
Structure of the Charging Framework |
It is not clear how the Charging Framework, the Charging Policy and the Cost Recovery Policy relate to each other.
However, the RMG 302 section on ‘What is the Australian Government Charging Framework?’ does not mention the Cost Recovery Policy. |
Source: ANAO analysis.
Appendix 4 2023–24 price comparison with model
Table A.2: Results of comparison between 2023–24 prices and output of model
|
Type of charge |
Charge point |
Unit |
Price published in 2023–24 ($) |
Matches output of CRIS model? |
Difference in price |
|
Charge (levy) |
Full Import Declaration charge — air |
Per import declaration |
43 |
▲ |
N/A |
|
Full Import Declaration charge — sea |
Per import declaration |
63 |
▲ |
N/A |
|
|
Non-commercial vessel arrival charge |
Per vessel |
155 |
▲ |
N/A |
|
|
Vessel, other than a non-commercial vessel arrival charge |
Per vessel |
1,354 |
▲ |
N/A |
|
|
Permit application charge |
Per application |
127 |
▲ |
N/A |
|
|
Approved arrangement application charge |
Per application |
194 |
▲ |
N/A |
|
|
Approved arrangement — AEPCOMM entry |
Per item |
20 |
▲ |
N/A |
|
|
Approved arrangement — single |
Per item |
2,680 |
▲ |
N/A |
|
|
Approved arrangement — multiple |
Per item |
3,110 |
▲ |
N/A |
|
|
Approved arrangement — broker |
Per item |
536 |
▲ |
N/A |
|
|
Compliance agreement — imported foods |
Per item |
2,680 |
▲ |
N/A |
|
|
Reservation charge — horses (The current charge includes both the importation charge and the husbandry fee for 14 days under the current arrangement) |
Per animal |
983 |
▲ |
N/A |
|
|
Confirmation of reservation charge — horses |
Per animal |
3,934 |
▲ |
N/A |
|
|
Reservation charge —ruminantsa |
Per animal |
1,005 |
▼ |
$791 |
|
|
Confirmation of reservation charge —ruminantsa |
Per animal |
4,019 |
▼ |
||
|
Reservation charge — animal not covered by another item of this table (includes cat or dog)a |
Per animal |
253 |
△ |
$1 |
|
|
Confirmation of reservation — animal not covered by another item of this table (includes cat or dog)a |
Per animal |
1,012 |
△ |
||
|
Reservation charge —beesa |
Per bee consignment |
837 |
▽ |
-$315 |
|
|
Confirmation of reservation charge —beesa |
Per bee consignment |
3,350 |
▽ |
||
|
Reservation of charge — avian (eggs for hatching)a |
Per hatching egg consignment |
13,109 |
▼ |
-$48,758 |
|
|
Confirmation of reservation charge — avian (eggs for hatching)a |
Per hatching egg consignment |
52,434 |
▼ |
||
|
Reservation charge — avian (live bird)a |
Per live bird consignment |
4,707 |
▼ |
-$260,092 |
|
|
Confirmation of reservation charge —avian (live bird)a |
Per live bird consignment |
18,827 |
▼ |
||
|
Importation charge —plants |
Per m2 per month |
291 |
△ |
-$3 |
|
|
Fee for service — inspection (including virtual inspections), examination, document assessment, analysis, diagnostic activity, clearance of cargo, treatment, audit, supervision, training. |
In-office fee during ordinary hours of duty |
Per 15 minutes |
37 |
▲ |
N/A |
|
Out-of-office fee during ordinary hours of duty |
Per 15 minutes |
62 |
▲ |
N/A |
|
|
Out-of-office fee during ordinary hours of duty |
Daily |
1,221 |
▲ |
N/A |
|
|
In-office fee outside ordinary hours — weekdays When activity is provided immediately before or after ordinary hours |
Per 15 minutes |
55 |
▲ |
N/A |
|
|
In-office fee outside ordinary hours — weekdays Minimum charge when activity is not provided immediately before or after ordinary hours |
Per 30 minutes |
110 |
▲ |
N/A |
|
|
In-office fee outside ordinary hours — weekend or departmental holiday |
Per 30 minutes |
120 |
▲ |
N/A |
|
|
In-office fee outside ordinary hours, after the first 30 minutes — weekend or departmental holiday |
Per 15 minutes |
60 |
▲ |
N/A |
|
|
Out-of-office fee outside ordinary hours — weekdays When activity is provided immediately before or after ordinary hours only |
Per 15 minutes |
80 |
▲ |
N/A |
|
|
Out-of-office fee outside ordinary hours — weekdays Minimum charge when activity is not provided immediately before or after ordinary hours only |
Per 30 minutes |
160 |
▲ |
N/A |
|
|
Out-of-office fee outside ordinary hours — weekend or departmental holiday |
Per 15 minutes |
85 |
▲ |
N/A |
|
|
Out-of-office fee outside ordinary hours — weekend or departmental holiday A minimum of 30 minutes followed by the per 15-minute rate thereafter |
Per 30 minutes |
170 |
▲ |
N/A |
|
|
Assessment of a permit application not completed within the initial assessment period for the application — ordinary hours |
Per 15 minutes after the initial assessment period |
37 |
▲ |
N/A |
|
|
Assessment of a permit application fee outside ordinary hours — weekday When activity is provided immediately before or after ordinary hours In addition to the initial assessment fee |
Per 15 minutes |
18 |
▲ |
N/A |
|
|
Assessment of a permit application fee outside ordinary hours — weekday In any other case, a minimum of 30 minutes applies followed by the per 15-minute rate thereafter In addition to the initial assessment fee |
Per 30 minutes |
36 |
▲ |
N/A |
|
|
Assessment of a permit application fee outside ordinary hours — weekend or departmental holiday for the first 30 minutes In addition to the initial assessment fee |
Per 30 minutes |
46 |
▲ |
N/A |
|
|
Assessment of a permit application fee outside ordinary hours —weekend or departmental holiday A minimum of 30 minutes applies followed by the per 15-minute rate thereafter In addition to the initial assessment fee |
Per 15 minutes |
23 |
▲ |
N/A |
|
|
Diagnostic testing |
Per 15 minutes |
37 |
▲ |
N/A |
|
|
Treatment — fumigation of commodity or import |
Per treatment |
90 |
N/Ab |
N/A |
|
|
Treatment — Re-export of return to sender of item |
Per item |
120 |
N/Ab |
N/A |
|
|
Fee for service — temporary storage in relation to international travellers and their baggage |
Temporary storage at premises owned or managed by the Commonwealth, of baggage brought into Australian territory |
Per 30 days per piece of baggage |
45 |
N/Ab |
N/A |
|
Fee for service — special processing areas, agreed fee in relation to international travellers and their baggage |
Any period up to 3 hours during which one or more fee bearing activities are carried out |
First 3 hours for each person carrying out those activities |
At least $516 but not more than $1,032 |
N/Ab |
N/A |
|
Immediately following the first three hours during which those activities are carried out |
Per 15 minutes immediately following first three hours for each person carrying out those activities |
At least $43 but not more than $86 |
N/Ab |
N/A |
|
|
Fee for service — husbandry |
Husbandry fee — horses that overstay the initial 14-day period |
Per animal per day over 14 days |
44 |
△ |
-$5 |
|
Husbandry fee — ruminants |
Per animal per day |
101 |
▼ |
$52 |
|
|
Husbandry fee — animal not covered by another item of this table (includes cat or dog) |
Per animal per day |
50 |
△ |
-$3 |
|
|
Husbandry fee — avian (eggs for hatching) |
Per egg consignment per day |
76 |
△ |
$6 |
|
|
Husbandry fee — avian (consignment of birds) |
Per live bird consignment per day |
57 |
△ |
$5 |
|
|
Husbandry fee — bees |
Per bee consignment monthly |
469 |
▽ |
$159 |
|
|
Husbandry fee — plants |
Per m2 per month |
60 |
△ |
$3 |
|
|
Fee for service — assessment of permit application |
Assessment Category 1 Permit application |
Each application |
74 |
▲ |
N/A |
|
Assessment Category 2 Permit application |
Each application |
148 |
▲ |
N/A |
|
|
Assessment Category 3 Permit application |
Each application |
296 |
▲ |
N/A |
|
|
Assessment Category 4 Permit application |
Each application |
444 |
▲ |
N/A |
|
|
Assessment Category 5 Permit application |
Each application |
592 |
▲ |
N/A |
|
Key:
▲ Directly informed by the model (price matched the amount calculated by the model);
△ Largely informed by the model (price did not match due to a change to the model);
▼ Partly informed by the model (difference in price partly explained, but no evidence of how final price calculated); and
▽ Not informed by the model (no or insufficient explanation of how the price was determined).
Note a: Animal importation charges are made up of a reservation charge and a confirmation of reservation charge, which are charged separately but calculated together by the model as a single importation charge.
Note b: Treatment fees and fees relating to baggage storage and special processing areas are not calculated by DAFF’s CRIS model.
Source: ANAO analysis.
Footnotes
1 Expressed in 2024–25 dollars.
2 Department of Agriculture, Fisheries and Forestry, ABARES Insights, Issue 1 | February 2026, DAFF, Canberra, 2026, available from https://daff.ent.sirsidynix.net.au/client/en_AU/search/asset/1037941/0/_v1.0.0.pdf [accessed 30 April 2026].
3 Centre of Excellence for Biosecurity Risk Analysis, Key Result Summary: Valuing Australia’s Biosecurity System, CEBRA, Melbourne, August 2020, available from https://cebra.unimelb.edu.au/research/past-projects/building-scientific-capability/value-of-australias-biosecurity-system [accessed 30 April 2026].
4 For more information regarding DAFF’s fees and charges, see Table 2.2 and Department of Agriculture, Fisheries and Forestry, Fees and Charges, available from https://www.agriculture.gov.au/about/fees [accessed 2 July 2026].
5 Department of Finance, Australian Government Cost Recovery Policy, Finance, Canberra, 2025, paragraphs 24–25, available from https://www.finance.gov.au/government/managing-commonwealth-resources/implementing-charging-framework-rmg-302/australian-government-cost-recovery-policy [accessed 26 June 2026].
6 The eight prices (15 per cent) that were assessed as ‘largely’ informed by the calculations of the charging model did not match due to the impacts of a change made to the model to address an error identified during stakeholder consultation. The eight prices listed in the 2023–24 CRIS were between $5 less and $6 more than the amount calculated by the model after the error was rectified. 2023–24 actual volumes for these charge points ranged from 0 to 120,698.
7 In June 2026, DAFF reported that April 2026 year to date cost recovery revenue for biosecurity was $21.3 million higher than its expenses. The 2025–26 full financial year forecast was that cost recovery revenue for biosecurity would be $18.3 million higher than its expenses (see Table 3.3).
8 ibid.
9 Expressed in 2024–25 dollars.
10 Department of Agriculture, Fisheries and Forestry, ABARES Insights, Issue 1 | February 2026, available from: https://www.agriculture.gov.au/abares/products/insights [accessed 24 June 2026].
11 Centre of Excellence for Biosecurity Risk Analysis, Key Result Summary: Valuing Australia’s Biosecurity System, CEBRA, Melbourne, August 2020, available from https://cebra.unimelb.edu.au/research/past-projects/building-scientific-capability/value-of-australias-biosecurity-system [accessed 30 April 2026].
12 Department of Agriculture, Fisheries and Forestry, Biosecurity cost recovery implementation statement 2025–26, p. 2, DAFF, Canberra, 2025, available from https://www.agriculture.gov.au/about/fees/biosecurity-cris#daff-page-ma… [accessed 1 May 2026].
13 ibid.
14 For more information regarding DAFF’s fees and charges, see Table 2.2 and Department of Agriculture, Fisheries and Forestry, Fees and Charges, available from https://www.agriculture.gov.au/about/fees [accessed 2 July 2026].
15 Department of Finance, Australian Government Charging Policy, Finance, Canberra, 2023, paragraphs 1–3, available from https://www.finance.gov.au/government/managing-commonwealth-resources/implementing-charging-framework-rmg-302/australian-government-charging-policy [accessed 1 May 2026].
16 Where the Finance Minister has made a government policy order that applies the Australian Government Cost Recovery Policy to them. From Department of Finance, Australian Government Cost Recovery Policy, Finance, Canberra, 2025, paragraph 7, available from https://www.finance.gov.au/government/managing-commonwealth-resources/implementing-charging-framework-rmg-302/australian-government-cost-recovery-policy [accessed 15 April 2026].
17 ibid., paragraphs 2–3.
18 The Department of Finance website notes that Resource Management Guides (RMGs) ‘are guidance documents’. It explains that ‘The purpose of an RMG is to support PGPA Act entities and companies in meeting the requirements of the PGPA framework. As guides, RMGs explain the legislation and policy requirements in plain English. RMGs support accountable authorities and officials to apply the intent of the framework.’
19 Department of Finance, Resource Management Guide 302: Implementing the Charging Framework, Finance, Canberra, 2025, available from https://www.finance.gov.au/government/managing-commonwealth-resources/implementing-charging-framework-rmg-302 [accessed 15 April 2026].
20 For more information regarding DAFF’s fees and charges, see Table 2.2 and Department of Agriculture, Fisheries and Forestry, Fees and Charges, DAFF, Canberra, available from https://www.agriculture.gov.au /about/fees [accessed 8 May 2026].
21 DAFF defines husbandry as activities relating to the care of plants and animals it is responsible for, including transport, housing, monitoring, feeding, cleaning of facilities, administering of medication, bookings and client assistance.
22 This example is for illustrative purposes only. For more information regarding the process to import a cat into Australia, see Department of Agriculture, Fisheries and Forestry, Step-by-step guides to bring your cat or dog to Australia, available from https://www.agriculture.gov.au/biosecurity-trade/cats-dogs/how-to-import/step-by-step-guides [accessed 15 April 2026].
For more information regarding DAFF fees and charges, see DAFF, Fees and Charges.
23 DAFF, Biosecurity Cost Recovery Implementation Statement 2025–26, p. 4.
24 During this period, some changes were made to cost recovery arrangements:
- In 2018, increases to vessel arrival charges and approved arrangements fees.
- In 2020, increases to Full Import Declaration (FID) and vessel arrival charges.
- In 2023, increase to the Sea FID charge.
25 Auditor-General Report No. 38 2018–19 Application of Cost Recovery Principles, ANAO, Canberra, 2019, available from https://www.anao.gov.au/work/performance-audit/application-cost-recovery-principles [accessed 4 May 2026].
26 ibid., paragraph 7.
27 ibid., paragraph 9.
28 ibid., Recommendation no.4, paragraph 3.63.
29 For more information regarding DAFF’s fees and charges, see Table 2.2 and DAFF, Fees and Charges.
30 Department of Finance, Australian Government Cost Recovery Policy, Finance, Canberra, 2025, paragraph 15, available from https://www.finance.gov.au/government/managing-commonwealth-resources/implementing-charging-framework-rmg-302/australian-government-cost-recovery-policy [accessed 15 April 2026].
31 ibid., paragraphs 24–32.
32 Finance, Australian Government Cost Recovery Policy, paragraph 74.
33 Finance, Resource Management Guide 302: Implementing the Charging Framework.
34 CRIS refers to the Cost Recovery Implementation Statement. See paragraphs 3.53 to 3.55.
35 Finance, Australian Government Cost Recovery Policy, paragraph 73.
36 ibid., paragraph 77.
37 Finance, Australian Government Cost Recovery Policy, paragraph 79.
38 Department of Finance, Implementing the Charging Framework (RMG 302), Stage 2, Finance, Canberra, 2023, available from https://www.finance.gov.au/government/managing-commonwealth-resources/implementing-charging-framework-rmg-302/stage-2-develop-charging-model [accessed 7 April 2026].
39 ibid.
40 ibid.
41 AusTender, Contract Notice CN4082911, available from https://www.tenders.gov.au/Cn/Show/02a91fe0-a4ee-4519-9617-2a4225b56faa [accessed 4 May 2026].
The value of the contract was $295,508 (original $198,970).
42 AusTender, Contract Notice CN4221837, available from https://www.tenders.gov.au/Cn/Show/c0b4eaef-5a5d-41d8-b4f1-40bf59f68cb6 [accessed 12 May 2026].
The value of the contract was $700,015.53.
43 Finance, Australian Government Charging Policy, paragraph 15.
44 Department of Finance, Australian Government Charging Policy, ‘Australian Government Pricing Models’, Finance, Canberra, 2023, available from https://www.finance.gov.au/government/managing-commonwealth-resources/implementing-charging-framework-rmg-302/australian-government-charging-policy [accessed 9 April 2026].
Finance, Australian Government Cost Recovery Policy, Figure 12: Composition of cost recovery charges.
45 DAFF, Biosecurity cost recovery implementation statement 2025–26, p. 2.
46 For a full list of current fees and charges see Department of Agriculture, Fisheries and Forestry, Biosecurity cost recovery implementation statements, DAFF, Canberra, 2025, available from https://www.agriculture.gov.au/about/fees/biosecurity-cris [accessed 11 May 2026].
47 DAFF, Biosecurity Cost Recovery Implementation Statements.
48 Finance, Australian Government Cost Recovery Policy, paragraph 36.
49 Department of Finance, Implementing the Charging Framework (RMG 302), Regulatory Activities, Finance, Canberra, 2023, available from https://www.finance.gov.au/government/managing-commonwealth-resources/implementing-charging-framework-rmg-302/regulatory-activities [accessed 7 April 2026].
50 ibid.
51 AusTender, Contract Notice CN4082911, available from https://www.tenders.gov.au/Cn/Show/02a91fe0-a4ee-4519-9617-2a4225b56faa [accessed 4 May 2026].
The value of the contract was $295,508 (original value $198,970).
52 Finance, Australian Government Cost Recovery Policy, paragraph 108.
53 ibid.
54 Finance, Resource Management Guide 302: Implementing the Charging Framework.
55 Department of Finance, Australian Government Charging Policy, ‘Charging Principles’, Finance, Canberra, 2023 available from https://www.finance.gov.au/government/managing-commonwealth-resources/implementing-charging-framework-rmg-302/australian-government-charging-policy [accessed 9 April 2026].
56 Finance, Implementing the Charging Framework (RMG 302), Regulatory Activities.
57 Department of Agriculture, Fisheries and Forestry, Changes to regulatory charging for biosecurity activities – impact analysis, p. 3, DAFF, Canberra, 2023, available from https://oia.pmc.gov.au/sites/default/files/posts /2023/07/Impact%20Analysis%20Revised%20Document.pdf [accessed 13 April 2026].
58 ibid.
59 ibid.
60 Finance, Australian Government Cost Recovery Policy, paragraph 44.
61 AusTender, Contract Notice CN4044546, available from https://www.tenders.gov.au/Cn/Show/b62756ff-a998-4ae5-ae48-5e680ce4df27 [accessed 12 May 2026].
The value of the contract was $66,044.
62 AusTender, Contract Notice CN4040714, available from https://www.tenders.gov.au/Cn/Show/18e22d83-7068-43b5-8ecb-d3a7261980db [accessed 12 May 2026].
The value of the contract was $206,643.75.
63 For more information about ‘top-down’ and ‘bottom-up’ cost modelling approaches, see paragraphs 2.16 to 2.19 and Figure 2.4.
64 AusTender, Contract Notice CN4082911, available from https://www.tenders.gov.au/Cn/Show/02a91fe0-a4ee-4519-9617-2a4225b56faa [accessed 12 May 2026].
The value of the contract was $295,508 (original value $198,970).
65 Finance, Australian Government Cost Recovery Policy, paragraph 31.
66 For more information regarding Industry Consultative Committees, see Department of Agriculture, Fisheries and Forestry, Industry Consultative Committees, DAFF, Canberra, available from https://www.agriculture.gov.au/biosecurity-trade/policy/partnerships/consultative-committees [accessed 6 May 2026].
67 Also known as the Post Entry Quarantine Plant Users Group.
68 Animal Health Australia Industry Forum; Australian Dairy Farmers; Australian Forest Products Association; Australian Fresh Produce Alliance; Australian Grape and Wine; Australian Pork Limited; Cattle Australia; Centre of Excellence for Biosecurity Risk Analysis; Commonwealth Scientific and Industrial Research Organisation; Cotton Australia; Freight and Trade Alliance; Grain Producers Australia; GrainGrowers Limited; International Forwarders and Customs Brokers Association; Invasive Species Council; Plant Health Australia Industry Forum; Seafood Industry Australia; Sheep Producers Australia; and Wool Producers Australia.
69 The eight prices (15 per cent) that were assessed as ‘largely’ informed by the calculations of the charging model did not match due to the impacts of a change made to the model to address an error identified during stakeholder consultation. The eight prices listed in the 2023–24 CRIS were between $5 less and $6 more than the amount calculated by the model after the error was rectified. 2023–24 actual volumes for these charge points ranged from 0 to 120,698.
70 In June 2026, DAFF reported that April 2026 year to date cost recovery revenue for biosecurity was $21.3 million higher than its expenses. The 2025–26 full financial year forecast was that cost recovery revenue for biosecurity would be $18.3 million higher than its expenses (see Table 3.3).
71 Department of Finance, Australian Government Cost Recovery Policy, Finance, Canberra, 2025, paragraph 25, available from https://www.finance.gov.au/government/managing-commonwealth-resources/implementing-charging-framework-rmg-302/australian-government-cost-recovery-policy [accessed 15 April 2026].
72 In June 2026, DAFF reported that April 2026 year to date cost recovery revenue for biosecurity was $21.3 million higher than its expenses. The 2025–26 full financial year forecast was that cost recovery revenue for biosecurity would be $18.3 million higher than its expenses (see Table 3.3).
73 DAFF, Biosecurity cost recovery implementation statement 2025–26, p. 2.
74 ibid.
75 Finance, Australian Government Cost Recovery Policy, paragraph 36.
76 Department of Agriculture, Fisheries and Forestry, Biosecurity Cost Recovery Arrangement: Cost Recovery Implementation Statement: 2023–24, DAFF, Canberra, 2023, p. 7, available from https://www.agriculture.gov.au/sites/default/files/documents/biosecurity-cost-recovery-implementation-statement-2023-24.pdf [accessed 17 April 2026].
77 There are a total of 58 prices listed between the CRIS and the accompanying list of fees and charges. Five fees relating to treatments, baggage storage and special processing areas are listed in the CRIS but not calculated by the model. DAFF advised the ANAO in March 2026 that treatment services are delivered by third party providers at variable costs, and a nominal fee is charged to partly recover these costs. DAFF advised the ANAO in June 2026 that the baggage storage fee was based on staffing costs and special processing fees are agreed at the request of an importer within an established range.
78 Examples of ruminants include cattle, goats, sheep, deer and antelopes.
79 This calculation is on the basis that, where a figure for the actual import volume was not provided to the ANAO, the actual import volume was assumed to be 0, reflecting the estimate published in the CRIS.
80 Finance, Australian Government Cost Recovery Policy, paragraphs 36–37.
81 ibid., paragraph 26.
82 ibid., paragraphs 27–28.
83 Department of Agriculture, Fisheries and Forestry, Annual Reports, DAFF, Canberra, 2025, available from https://www.agriculture.gov.au/about/reporting/annual-report [accessed 19 April 2026].
84 Department of Agriculture, Fisheries and Forestry, Biosecurity cost recovery implementation statements.
85 Department of Agriculture, Fisheries and Forestry, Sustainable Biosecurity Funding, see ‘Biosecurity funding and expenditure reporting’, DAFF, Canberra, 2025, available from https://www.agriculture.gov.au/biosecurity-trade/policy/sustainable-biosecurity-funding [accessed 19 April 2026].
86 Finance, Australian Government Cost Recovery Policy, paragraph 39.
87 ibid., paragraph 39.
88 ibid., paragraphs 41–42.
Department of Finance, Resource Management Guide 302: Implementing the Charging Framework, ‘Cost Recovery Implementation Statement’, Finance, Canberra, 2023, available from https://www.finance.gov.au/government/managing-commonwealth-resources/implementing-charging-framework-rmg-302 [accessed 19 April 2026].
89 Department of Agriculture, Fisheries and Forestry, Sustainable Biosecurity Funding, ‘Biosecurity funding and expenditure reporting’, DAFF, Canberra, 2025, available from https://www.agriculture.gov.au/biosecurity-trade/policy/sustainable-biosecurity-funding [accessed 19 April 2026].
90 Finance, Australian Government Charging Policy.
91 Finance, Australian Government Cost Recovery Policy.
92 The Department of Finance website notes that Resource Management Guides (RMGs) ‘are guidance documents’. It explains that ‘The purpose of an RMG is to support PGPA Act entities and companies in meeting the requirements of the PGPA framework. As guides, RMGs explain the legislation and policy requirements in plain English. RMGs support accountable authorities and officials to apply the intent of the framework.’
93 Finance, Resource Management Guide 302: Implementing the Charging Framework.