Browse our range of reports and publications including performance and financial statement audit reports, assurance review reports, information reports and annual reports.
Auditor-General Report No. 36 of 2025–26
Australian National University Financial Management
Published
Thursday 4 June 2026
Portfolio
Education
Entity
Australian National University
Contact
Please direct enquiries through our contact page.
Audit snapshot
Why did we do this report?
- Under the Higher Education Standards Framework (Threshold Standards) 2021, Australian universities are required to be financially sustainable.
- Sustainable financial management allows universities to support quality teaching and research.
- In October 2024, the Australian National University (ANU) commenced implementation of Renew ANU, to restructure the university and reduce ANU’s annual operating budget by $250 million (16.5 per cent of total 2024 expenditure) by January 2026.
Key facts
- The ANU’s Accountable Authority under the Public Governance, Performance and Accountability Act 2013 is the ANU Council.
- The ANU Council is made up of the Chancellor (Chair), Vice-Chancellor, seven members appointed by the Education Minister, and six members representative of staff and students.
- The ANU Council is responsible for promoting the university’s purposes, financial sustainability, and proper use and management of public resources.
What did we find?
- The Renew ANU savings target was approved by ANU Council in August 2024 without sufficient understanding of the problem, the options available, or implementation risks.
- ANU Council approved the $250 million savings target without clear evidence it was needed, achievable, urgently required, or likely to have the intended impact.
- Council’s decision-making should have considered additional information, options, and perspectives.
Key messages
- Where an Accountable Authority is a collective decision-making body, operating protocols should ensure major change plans are subject to appropriate scrutiny before approval, including the evidence base, alternative options, feedback from meaningful consultation with those directly affected, and risks.
- The preparation of non-audited financial information should be based on an approved methodology and oversight.
- Council members should seek further information or assurance from management where targets are not met.
$74.8m
Annual salary savings reported as part of Renew ANU, as of February 2026.
$35.9m
Cost of Renew ANU as of February 2026.
$116.3m
Audited net operating result reported by ANU for 2025.
Guide to this report
Scope
1. The ANAO examined Australian National University (ANU) financial management, with a focus on Renew ANU — a cost saving and restructuring initiative announced by ANU in October 2024. Renew ANU aimed to achieve financial sustainability by January 2026 via:
- $100 million annual, ongoing savings from staffing expenses, including restructuring academic colleges, and reducing the number of colleges from seven to six.1
- $150 million annual, ongoing savings from non-salary expenses to be identified by an Expenditure Taskforce led by the Chief Operating Officer.
2. The ANAO addressed the following questions:
- What were the financial pressures and conditions that led to Renew ANU?
- What actions has ANU taken to address the financial pressures and conditions that led to Renew ANU?
Purpose
3. The Auditor-General is the ANU’s external auditor for its financial statements, with the audit opinion providing reasonable assurance that the financial statements present fairly the financial position and financial performance of the ANU.2 A separate financial statements audit report is provided each year in respect of the ANU’s financial statements.
4. In light of parliamentary and public interest in Renew ANU, analysis was conducted alongside the ANAO’s audit of the ANU’s 2025 financial statements. This report, tabled under section 25 of the Auditor-General Act 1997, consolidates independent analysis that provides transparency to the Parliament with respect to ANU’s financial management, and makes findings and recommendations where appropriate.
5. In preparing this report, the ANAO has conducted the same procedures to collect and corroborate evidence as we would use in a performance audit and has applied the same level of professional scepticism in analysing that evidence. The report presents facts and findings based on evidence.
Previous audits and reviews
6. While this report is distinguished by its focus on financial management, it contributes to a growing literature on university governance. Two previous ANAO performance audits have considered ANU:
- Auditor-General Report No. 11 2021–22 Australian National University’s Governance and Control Framework found the governance and control framework of the ANU was largely effective, except for deficiencies in systems of control and accountability, which were in the process of being remedied at the time of the audit.3
- Auditor-General Report No. 30 1996–97 Australian National University Administration found ANU had financial and control frameworks to assist the day-to-day administration of the university’s activities, including an appropriate three-year budget process, policies and procedures, and a sound internal review process, but that effectiveness could be improved in a range of areas including strategic and operational planning, performance information, and internal audit.4
7. Concern about the financial sustainability of higher education is common across Organisation for Economic Co-operation and Development countries, due to constraints on public finances, fewer young people leading to reduced growth in demand, and changing patterns of international mobility, geopolitical tensions and shifts in domestic immigration policies limiting income from international student fees.5 In Australia, recent work includes:
- the Australian Government Expert Council on University Governance, which recommended the adoption of a set of governance principles through annual reporting monitored by the higher education regulator, the Tertiary Education Quality and Standards Agency (TEQSA)6;
- the Parliamentary Inquiry into the quality of governance at Australian higher education providers, which recommended wide-ranging changes to university governance, including changes to TEQSA’s advice, monitoring, and reporting requirements in relation to university governance7;
- university-specific analysis8; and
- analysis by state and territory government audit offices, in whose remit all Australian universities except ANU fall.9
Key concepts
8. Under the Higher Education Standards Framework (Threshold Standards) 2021, a registered higher education provider is required to have the ability to manage their resources to support quality operations in both the short-term (financial viability) and over the longer-term (financial sustainability).10
9. Financial management involves systems and processes to achieve financial viability and sustainability, including budgeting, forecasting, internal controls, risk management, financial reporting, and performance monitoring to achieve an entity’s purpose.11 The Public Governance, Performance and Accountability Act 2013 (PGPA Act), requires public resources to be managed in an efficient, effective, economical and ethical manner, with care and due diligence (see paragraphs 1.4 and 1.7).
10. Financial performance is how well an entity uses its resources in achieving its purpose. It is generally measured using financial statements (operating result, balance sheet, and cash flow) and metrics like profit margin, revenue growth, assets to liabilities, and capital turnover.12 To effectively manage resources, universities must generate revenue and manage expenses to maintain appropriate levels of net assets and cash flows, without reducing essential services or borrowing money to fund sustained operational deficits.13
11. Australian Government entity financial statements are prepared in accordance with the Australian Accounting Standards, to record an entity’s financial activity, performance, and position over a specified reporting period. They are the means by which the entity’s Accountable Authority and Chief Financial Officer discharge their financial accountability responsibilities under the PGPA Act.
12. There are no Australian Government performance targets or benchmarks that could be used to assess entity financial management. In 2018–19, the Department of Finance established a portal which includes tools and guidance on financial ratios, which allow Australian Government entities to compare their performance. However, performance targets or benchmarks to assist users to understand whether these ratios indicate strong or weak financial performance have not been developed.14 The ANAO considers that there would be benefit in the Australian Government developing performance targets or benchmarks on financial sustainability.15 University performance against a selection of key performance indicators is provided at Appendix 4. Indicators are drawn from Department of Finance as well as Universities Australia, to ensure the information provided is appropriate to the Australian public university sector.
Methodology
13. This work drew on meetings with current and former ANU staff and Council members, sector experts, relevant Australian Government entities, review of ANU documents, analysis of ANU and publicly available data, and the ANAO’s financial statements audit work. As detailed in paragraph 5, the ANAO has conducted the same procedures to collect and corroborate evidence as we would use in a performance audit and has applied the same level of professional scepticism in analysing that evidence.
14. The report was produced at a cost to the ANAO of approximately $334,202.
15. The team members for this report were Hazel Ferguson, Renae Lowden, Kayla Lu, Lewis Passarelli, Rahul Tejani, and David Tellis.
16. Fieldwork was conducted between September 2025 and January 2026, with analysis focusing on the period from 2020 to 2025.
Summary of entity response
17. The proposed report was provided to ANU, TEQSA, and the Department of Education. The ANU provided a formal response. The ANU summary response is reproduced below and the full response is at Appendix 1.
Australian National University summary response
ANU Council thanks the ANAO for its recommendations, all of which have been accepted, and recognises the opportunity they provide to strengthen governance, financial advice and reporting practices.
Council acknowledges that documentation provided to it could have more clearly articulated the problem, options, risks and impacts in a single, integrated narrative, including both financial and non-financial considerations. However, Council does not accept the characterisation that the Renew ANU savings target was approved without an understanding of the nature, scale or urgency of the financial challenge.
Financial pressures developed over an extended period, reflecting structural changes in the University’s revenue and cost base, including sustained declines in government funding and volatility in student revenue, as noted in the ANAO report. These pressures were identified as early as 2023, with increasing scrutiny of cash flow, revenue sustainability and the cost base. By mid-2024, the scale and trajectory of the problem was clear.
The program was developed in a dynamic environment, with analysis, options, risks and impacts refined iteratively through engagement between the executive and Council, and subject to ongoing governance and oversight following approval.
Council acknowledges that consultation processes, articulation of non-financial risks, and consideration of community impacts should be strengthened. We commit to these actions which will further support ANU’s financial sustainability and governance, providing a clear platform for the University’s next Strategy.
ANAO comment on ANU’s summary response
18. In undertaking their PGPA Act duties as the Accountable Authority for the university, each ANU Council member is required to exercise the degree of care and diligence that a reasonable person would in the circumstances.16 In the case of decision-making with significant impacts, such as Renew ANU, members ‘should exercise more caution to inform themselves of all the circumstances to make a reasonable decision’.17
19. The specific circumstances detailed in this report show ANU Council members could not have relied on information provided over time to properly consider what became known as Renew ANU (see paragraphs 4.1 to 4.31). This is because:
- Information provided lacked key elements, including feedback from meaningful consultation with staff and students, and analysis to demonstrate that the $250 million savings target was both necessary, and achievable.
- As a multi-member accountable authority, sustained engagement with decision-making over time is affected by changes in membership. 22 ANU Council members either commenced or ceased between October 2023, when Council was advised ANU was not on track to break even by 2026, and October 2025, when the savings target was removed. Evidence of key decisions, supporting analysis and the rationale for choices made was lacking. Without sufficient documented evidence, continuity of understanding to support proper consideration of decisions cannot be sustained over a multi-year period during which membership changed.
Summary and recommendations
Executive summary
1. ANU’s key income is not keeping up with its costs without supplementation from other income sources.
Growth in Australian Government funding and student fees has slowed in recent years, and since 2018 they have not been enough to cover ANU’s expenses without supplementation from other income sources. This gap has been approximately 25 per cent since 2020, although there was some improvement in 2021 (to 12.0 per cent) and 2025 (to 20.3 per cent), due to declining expenses.
2. ANU’s long-term sustainability does require active management, but it is not in immediate financial crisis.
ANU still shows strong overall financial health on measures like audited net operating results, credit ratings and net assets. However, a trend of declining average five year surpluses raises questions about whether the current financial model is sustainable over the longer term.
3. Financial pressures built up between 2020 and 2024 due to optimistic revenue assumptions and limited spending control.
After a $317 million surplus in 2019, revenue fell sharply in 2020. ANU had some success in reducing spending and relied on investment income, which it determined was not sustainable. ANU forecasts were consistently incorrect as they related to international student numbers, indicating insufficient alignment between student recruitment and financial planning.
4. The ANU Council approved the $250 million Renew ANU savings target (16.5 per cent of total 2024 expenditure) without clear evidence it was needed, achievable, urgently required, or likely to have the intended impact.
The ANU Council approved Renew ANU without a clear understanding of the problem, the options available, implementation risks, or the expected impact of the program on the university’s purpose, financial sustainability, and people. Council’s decision-making should have considered additional information, options, and perspectives, including alternative ways to address identified financial problems across the university’s balance sheet (such as using one or more of revenue measures, borrowing, or the use of investment assets and/or investment income, in combination with savings efforts, to allow for a longer transition timeframe).
5. The Renew ANU program has delivered some savings, but with significant risks.
While some savings have been made from the implementation of Renew ANU, as of February 2026, the program has cost $35.9 million against reported annual salary savings of $74.8 million, and major risks remain — particularly around staff impacts and reliance on future growth in international student numbers, which has historically taken longer than planned.
Recommendations
Recommendation no. 1
The Australian National University formally capture and apply lessons learned from Renew ANU to future proposals involving major financial or organisational change, to ensure such proposals are supported by a documented business case that clearly sets out:
- the problem to be addressed;
- realistic, evidence-based options;
- implementation risks and dependencies;
- the expected impact on the university’s purpose, financial sustainability, and people; and
- oversight and reporting arrangements.
This information should be provided to Council prior to approval, to enable informed and robust decision-making.
Australian National University response: Agreed.
ANU agrees with the recommendation to strengthen how analysis, options, risks, and impacts are documented and presented in a structured business case format. Council considers that a body of analysis informed its deliberations, and that this recommendation appropriately focuses on improving how that material is consolidated and presented to support decision-making.
Recommendation no. 2
The Australian National University enhance the quality of financial advice and reporting to Council and its committees to ensure it is readily understood by its membership, including by:
- explaining the university’s full financial position, including audited net operating results, cash flows and liquidity, and assets, liabilities and investment funds;
- explaining the interaction between operating decisions and financial performance, including trend and trajectory analysis, reasons for any variance from budget, and longer term risks to financial sustainability; and
- commissioning independent assurance as to the effectiveness of financial control improvements introduced since 2020.
Reliance on income and expenditure measures alone should be avoided.
Australian National University response: Agreed.
Recommendation no. 3
The Australian National University establish and approve a documented methodology for the calculation and use of non-audited financial measures (including the underlying operating result and management operating result), including:
- clear definitions and permitted adjustments;
- reconciliation to audited financial statements; and
- consistent use in internal reporting and decision-making.
Council reporting should clearly identify which measure is being used and why.
Australian National University response: Agreed.
6. Implementation of these recommendations will be tracked as part of the ANAO’s financial statement audit work of ANU.
1. Background
The Australian National University
1.1 The Australian National University (ANU) is responsible for ‘undertaking research and teaching of the highest quality’.18 It is the only Australian university established under Commonwealth legislation, and has both ‘national and international roles’.19
1.2 In the 2025 calendar year (ANU financial reporting is by calendar year), ANU employed 4,644 people (measured in full time equivalent staff, or FTE), enrolled 16,960 students (measured in equivalent full time student load, or EFTSL), and generated $1.6 billion revenue against $1.5 billion operating expenses. In addition to its main campus in Canberra, Australian Capital Territory, the university maintains five other sites across Australia.20 As of 31 December 2025, its assets were valued at $5.7 billion.
Governance
1.3 ANU’s governance structure is outlined in Figure 1.1. Broadly, there are three elements of Australian university governance:
- the university council, responsible for oversight of the university’s purpose, financial sustainability, legal obligations, risk frameworks, and overall delivery of outcomes;
- the academic board, responsible for maintaining academic excellence, and managing academic matters of the university; and
- the university executive, led by the Vice-Chancellor, responsible for the day-to-day operational management of the university.21
1.4 The Australian National University Act 1991 (ANU Act) provides the Council has ‘the entire control and management of the University’.22 As the governing body of a Commonwealth entity, the ANU Council is the Accountable Authority under the Public Governance, Performance and Accountability Act 2013 (PGPA Act). This means it is responsible for leading, governing and setting the strategic direction for the university, and promoting the university’s purposes, financial sustainability, and proper use and management of public resources.23 This includes establishing and maintaining appropriate systems of risk oversight and management, and internal controls for the entity.24
Figure 1.1: ANU governance structurea as of March 2026b
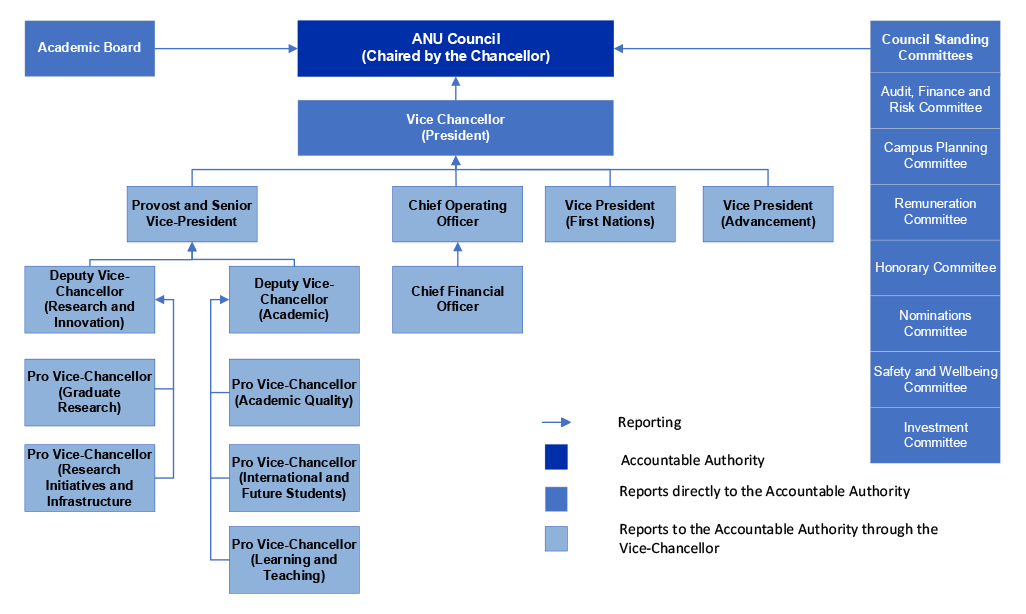
Note a: Academic Board is tasked with ensuring the University maintains the highest standards in teaching, scholarship and research. It consists of the Chair, Vice-Chancellor, Deputy Vice-Chancellors, Pro Vice-Chancellors, the head of Student Administration and Academic Services (University Registrar), the Dean of Each ANU College, the Dean of Students, the Vice-President, First Nations, the University Librarian, and at least 28 other members representative of academic and professional staff and students.
Note b: At the time of finalising this report (May 2026), a Special Governance Committee of Council was in place, with responsibility for the ANU’s response to ‘matters raised in the Senate Committee hearing on 12 August 2025’. The Special Governance Committee was established for a period of 12 months and therefore has not been included in this figure as a Council Standing Committee.
Source: ANAO based on ANU documents.
1.5 As a Corporate Commonwealth entity, ANU is legally separate from the Commonwealth, meaning that the Accountable Authority is not directly responsible to the executive.25 While the Prime Minister has the power to appoint and remove departmental secretaries under the Public Service Act 1999, the ANU Act provides that Council members’ legal accountability is to the Council itself, and the university.26 Under the ANU Act, once appointed, members may resign, are disqualified if they cease to be eligible to be a member of Council, or can be removed by resolution if Council forms the view that a member is unable to perform their duties or has breached their obligations.27 The ANU Council is also responsible for appointing and terminating the Chancellor and Vice-Chancellor of ANU, and determines the duration and conditions of these appointments.28
1.6 There is no external authority with legal power to direct or remove the ANU Council, but its operations can be affected by:
- the Education Minister’s appointment of seven of the 14 members29;
- the Finance Minister’s determination of the university’s borrowing limit30; and
- the higher education regulator, the Tertiary Education Quality and Standards Agency (TEQSA), which registers ANU as an Australian university and has discretion to impose conditions on registration, which could extend to imposing conditions impacting the functions of ANU Council.31
1.7 ANU Council members are required to exercise the degree of care and diligence that a reasonable person would in the circumstances, and act honestly, in good faith, and for proper purpose.32 They must ensure they regularly monitor and understand financial position, financial performance, and cash flow information, and obtain and use such ‘information and advice … as is necessary for informed and competent decision making and direction setting’.33 The Expert Council on University Governance — Final Report and Principles emphasises the need for ‘genuine inquisitiveness’, while ANAO performance audits of public sector boards have found board members should actively question and challenge management.34 These requirements are similar to expectations in other sectors. The board of directors of a company or not-for-profit must also exercise care and due diligence.35
1.8 The ANU Council is a collective decision-making body which affords the Chair and each member equal votes. The operational arrangements for ANU Council are detailed in Appendix 2.
2. Operating environment
All Australian university income is primarily from Australian Government grants for teaching and research, and student fees. A range of policy and market changes since 2006 have resulted in revenue growth from these sources slowing for all universities — growth was 51.5 per cent in real terms between 2006 and 2015, and 12.6 per cent in real terms between 2016 and 2024.
For ANU, these income sources have not been sufficient to cover expenses since 2018, and the gap between total expenses and total key income has been approximately 25 per cent since 2020, although there was some improvement in 2021 (to 12.0 per cent) and 2025 (to 20.3 per cent), due to declining expenses.
Despite this, measures of financial performance for the university (including audited net operating results, credit ratings, and asset balance) have remained robust. ANAO analysis of ANU’s average audited net operating results from 2020 to 2025 indicates large but declining average surpluses, with some improvement in 2025. This means ANU is not at immediate financial risk, but it should raise financial sustainability questions for ANU requiring active management.
Australian higher education funding is primarily from Australian Government grants for teaching and research, and student fees
2.1 Australia’s higher education system provides education for approximately 1.7 million students (in 2024, up from 1.6 million in 2020) via 217 higher education providers, including 44 universities (up from 178 providers, including 42 universities, in 2020).36
2.2 The sector is regulated by the Tertiary Education Quality and Standards Agency (TEQSA). Australian universities are required to undertake teaching and research, and offer doctoral research degrees, as conditions of registration with TEQSA.37 Australian Government funding is administered by the Department of Education (Education), and is subject to registration with TEQSA, and conditions in the Higher Education Support Act 2003 (HESA).38
2.3 University income is primarily received from Australian Government grants for teaching and research, and student fees.39 Total university revenue from these sources grew by 51.5 per cent in real terms between 2006 and 2015, and by 12.6 per cent in real terms between 2016 and 2024 (Figure 2.1).
Figure 2.1: All university revenue from Australian Government grantsa and student fees, 2006 to 2024 (2024 dollars)
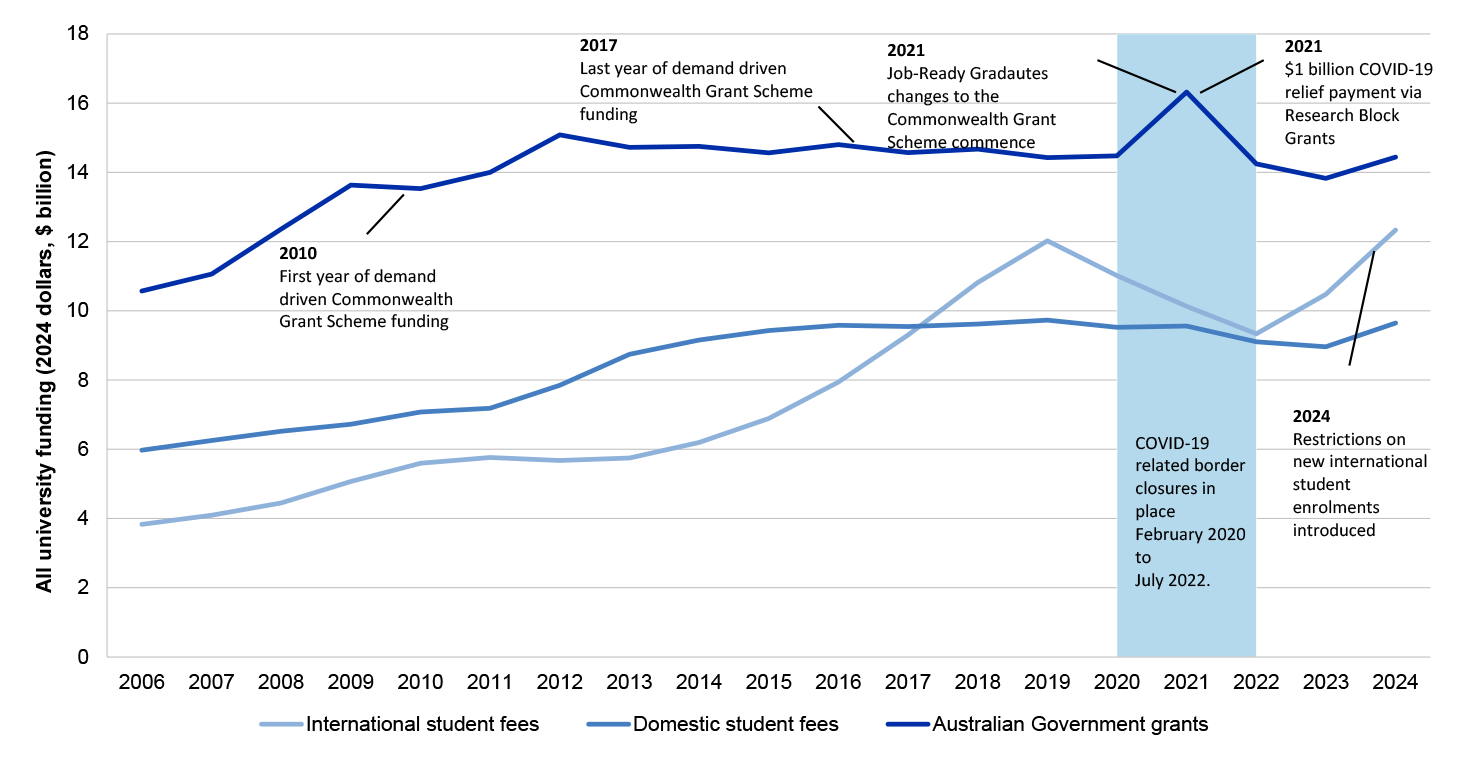
Note a: Australian Government grants include subsidies for domestic students through the Commonwealth Grant Scheme, research grants, and the National Institutes Grant. Domestic student fees include upfront student payments and student contributions, and advances on student loans by the Australian Government, and international student fees do not have any sub-components.
Source: ANAO analysis of Department of Education data.
Australian Government funding for learning and teaching is predominantly via the Commonwealth Grant Scheme
2.4 The largest component of Australian Government grants for universities is from the Commonwealth Grant Scheme (CGS), which subsidises course fees for eligible students (predominantly domestic undergraduates).40 CGS funding in the 2025–26 Budget was an estimated $8.4 billion in 2025–26.41
2.5 A subsidised place funded through the CGS is known as a Commonwealth supported place (CSP). Universities receive two payments for each CSP: a Commonwealth contribution, paid by the Australian Government through the CGS, and a student contribution, paid by the student, usually using an Australian Government student loan.42 Maximum Commonwealth contribution and student contribution amounts are set in HESA, and vary according to field of study.43 International students, and most domestic postgraduate students, are not eligible for CSPs.
2.6 The major variations in Australian Government funding for universities attributable to the CGS between 2006 and 2025 were:
- CGS funding was demand driven from 2010 to 2017, leading to growth in university funding and student numbers.44
- For most courses, CGS funding was capped from 2018 to 2025, but universities were allowed to enrol ‘unfunded’ students above the funding cap (for whom they received only the student contribution amount).45
- Average per student CGS funding was reduced from January 2021 under the Job Ready Graduates package.46
2.7 Further changes to the CGS commenced from 2026, when the ‘managed growth’ system began the process of capping student numbers, ending the practice of enrolling ‘unfunded’ students.47
2.8 Other grants are also made under HESA to higher education providers to support learning and teaching priorities.48
Australian Government funding for university research comes from a large number of different programs
2.9 The largest Australian Government research grants, the Research Support Program (RSP) and Research Training Program (RTP), referred to collectively as the research block grants (RBG), provide funding support for research and research training. 49 RBG funding in the 2025–26 Budget was an estimated $2.4 billion in 2025–26.50
2.10 RBG funding is allocated to each university based on research and development income and higher degree by research student completions.51 The major variation in Australian Government funding for universities attributable to the RBGs was in 2021, when the Government made a one-off $1.0 billion COVID-19 relief payment via the RSP.52
2.11 In addition to RBG funding, Australian universities also compete for access to nationally competitive grants (also referred to as ‘category 1’ funding), mainly from the National Health and Medical Research Council (NHMRC), the Australian Research Council (ARC), and the Medical Research Future Fund (MRFF). While these grants are awarded to the university, they are generally to support a specific researcher or group of researchers to complete a project. This means in some cases nationally competitive grants can move from one university to another if the lead researcher changes employers. Other Australian Government research grants support areas of investment need, such as research infrastructure and industry engagement.53
2.12 Some universities also receive other public sector research funding (also referred to as ‘category 2’ funding) that is not awarded on a nationally competitive basis, such as National Institutes Grants. The ANU is the majority recipient of National Institutes Grant funding, receiving 90.6 per cent of the total funding pool of $272.9 million in 2025, in recognition of the role the university plays in facilitating activities of national significance.
2.13 Some universities also receive Cooperative Research Centres (CRC) funding, which is for research application which links industry with government (‘category 4’ research funding) and research funding direct from industry and other non-government bodies (‘category 3’ research funding).
The major non-government source of income for Australian universities is full fee-paying students, predominantly international students
2.14 The major non-government source of income for Australian universities is full fee-paying students, predominantly international students. These fees are set by each institution according to market conditions and provide opportunities for revenue growth.
2.15 As shown in Figure 2.1, revenue from this source grew strongly to 2019, then fell from 2020 due to COVID-19 related border closures, reaching its lowest point in 2022. While overall sector income from this source grew again in 2023 and 2024, restrictions on international student enrolment growth were introduced in 2023 for 2024.54
Australian Government funding for ANU fell 24.4 per cent in real terms between 2006 and 2024 while other sources of income have grown
ANU’s reported total assets were sixth highest among Australian universities in 2024
2.16 The ANU, like other Australian universities, is a large not-for-profit enterprise, with annual revenue and expenses, and combined assets, in the billions of dollars (Figure 2.2).55 In 2024 (latest available comparative data), its reported total assets were sixth highest among Australian universities, despite being in the bottom half of universities in terms of student numbers (in 2024 ANU was the 27th largest Australian university based on student numbers, less than a quarter the size of the university with the largest student cohort, Monash University).
2.17 In 2024 (the comparison year in Figure 2.2) 92.3 per cent of ANU’s total assets were:
- property plant and equipment (PP&E), such as construction in progress, land, and buildings, which was valued at a total of $3.6 billion; and
- financial assets, which were valued at $1.5 billion (of which $1.4 billion was held in a ‘Long Term Investment Pool’ (LTIP)).
2.18 The ANU holds most of its financial assets in a LTIP, which includes domestic and overseas equity funds, infrastructure, term deposits, and government bonds. In 2024, the majority of the LTIP (72 per cent) was invested in equities (shares that could be sold) or term deposits (which funds can be withdrawn from, subject to interest penalties and fees), or held in cash. In practice, much of the LTIP is treated by ANU as ‘restricted’, because it is held to meet the cost of ANU’s Commonwealth Superannuation Scheme (CSS) liability, or it is from donations and bequests for scholarships, prizes, foundations and endowments. In 2024, $459.7 million (30.9 per cent) of ANU’s investment assets were unrestricted (paragraphs 3.14 to 3.15). Separately, ANU maintains a general cash float (paragraph 4.13).
2.19 Between 2016 and 2024, the ANU’s current assets exceeded its liabilities by more than double. Classification as a current or non-current asset is prescribed by Australian Accounting Standards. Current assets are those that are expected to be realised within 12 months or, in the case of investments, where the intent is that they are held for trading. As a result, this classification may not always reflect the actual ability to liquidate the asset to meet an entity’s obligations within a year. In 2025, ANU reclassified a portion of its investment assets from current to non-current. This reclassification rectified an error in the application of the requirements of the Australian Accounting Standards in prior years to accurately reflect the ANU’s investment policy that its investment pool is not held for trading and is managed on a long term basis. The reclassification does not change the fact that the majority of the assets are such that they could be readily realised to meet financial obligations, if required.
Figure 2.2: Australian university total assetsa, revenue and expenses, 2024
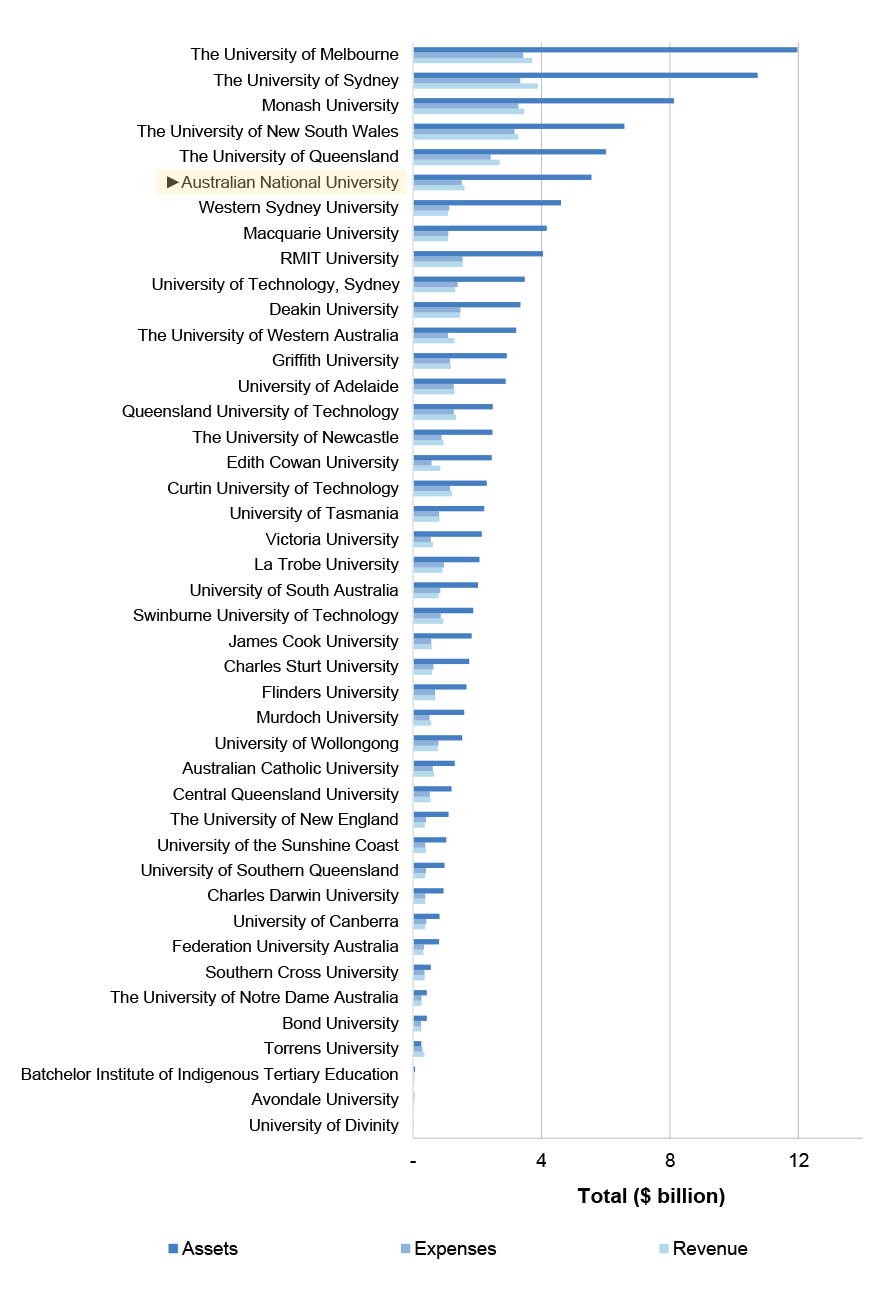
Note a: This chart is ranked by assets. Among Australian universities, ANU is sixth largest when ranked by assets, sixth largest when ranked by revenue, seventh largest when ranked by expenses, and 27th largest when ranked by student numbers.
Source: ANAO based on Department of Education data.
The ANU identifies its key income sources as Australian Government grants and student fees
2.20 The ANU identifies its ‘key’ income sources as: Australian Government grants (including the National Institutes Grant) and student fees. While sector-wide income from these sources has grown by 78.7 per cent in real terms since 2006 (Figure 2.1), ANU income from these sources has grown by 6.5 per cent in real terms over the same period (Figure 2.3).
Figure 2.3: ANU revenue from key income sourcesa, 2006 to 2024 (2024 dollars)
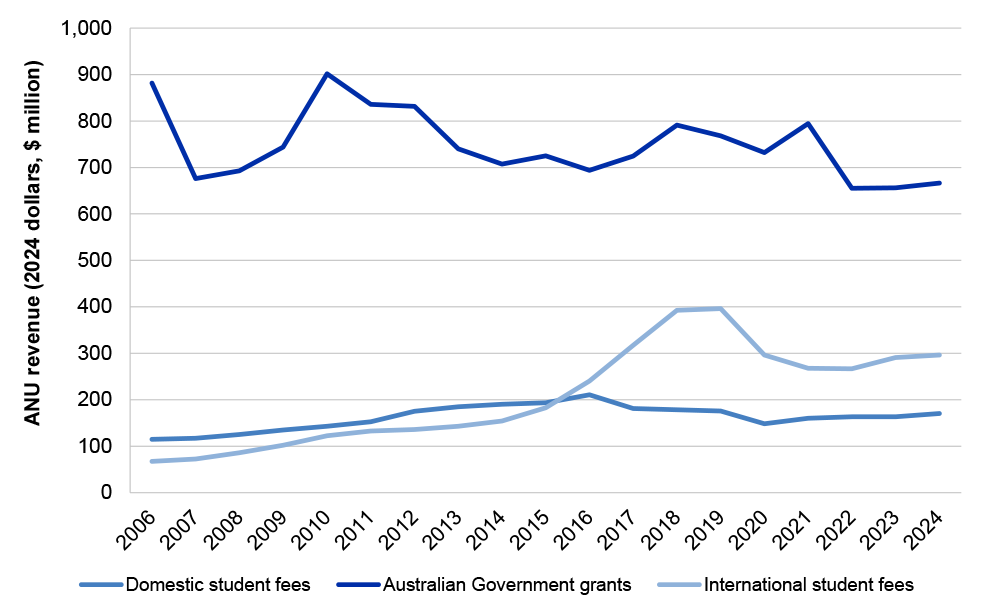
Note a: Australian Government grants include subsidies for domestic students through the Commonwealth Grant Scheme, research grants, and the National Institutes Grant. Domestic student fees include upfront student payments and student contributions, and advances on student loans by the Australian Government, and international student fees do not have any sub-components.
Source: ANAO analysis of Department of Education data.
2.21 Australian Government grants to ANU fell 24.4 per cent in real terms between 2006 and 2024, while other sources of income grew over the same period. ANU achieved growth in international and domestic student fees between 2006 and 2015 (of 171.1 and 68.5 per cent respectively). International student fee growth continued between 2016 and 2019, while domestic student fee revenue fell. In 2024, ANU’s income from international student fees had recovered slightly to 23.4 per cent higher than in 2016, while income from domestic student fees was 19.1 per cent lower.
2.22 Growth in student numbers does not necessarily increase operating surplus.56 ANU has made a loss on domestic undergraduate teaching since 2022, but this is offset by strong profit margins on postgraduate and international undergraduate teaching (Figure 2.4).
Figure 2.4: ANU operating margina (EFTSL) by enrolment type, 2016 to 2024 ($ million)
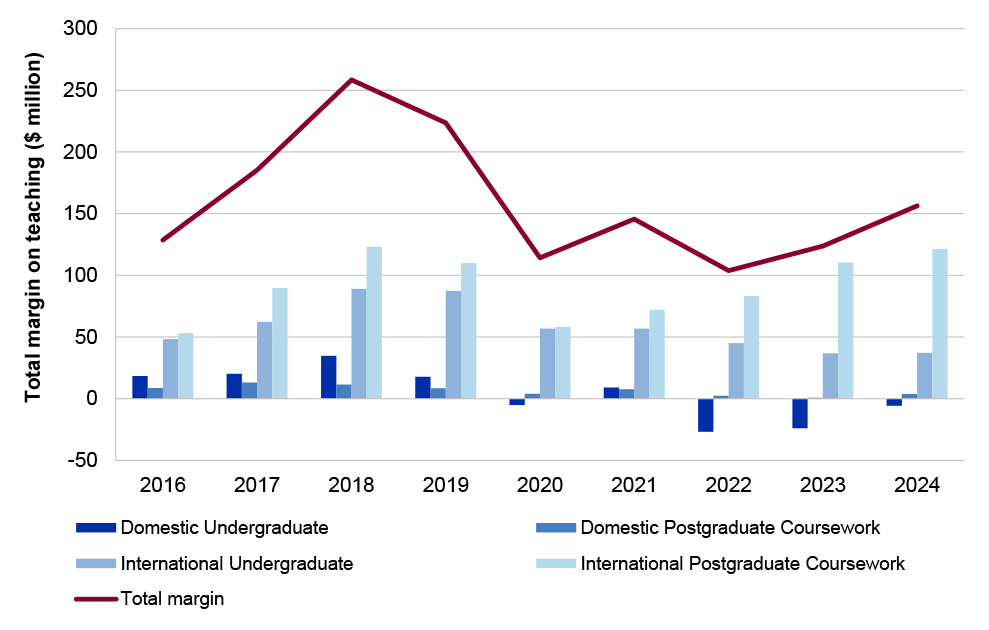
Note a: Operating margin factors in teaching revenue (student fees and Australian Government grants) and direct and indirect costs of delivery, including teaching and support space utilisation, staff time, academic support services, and campus-wide overheads such as library and IT support.
Note: Data related to non-award, research, and ‘other’ study is not included in this figure.
Source: ANAO based on ANU data.
2.23 From 2016 to 2023 (latest available comparative data), the ANU increased its RBG income by 6.2 per cent, and other research income by 49.9 per cent, mainly due to growth in public sector research income outside nationally competitive programs, and industry and other research income (Figure 2.5).57 Over the same period, total university RBG funding grew by 14.6 per cent, and other research income grew by 63.5 per cent. This means ANU’s share of research funding decreased, largely driven by a decreased share of nationally competitive (category 1) research grants (from 5.5 per cent in 2016 to 3.6 per cent in 2023).58
Figure 2.5: University research income by categorya, and research block grant (RBG) allocationsb, ANU and all universities, 2016–2025c,d
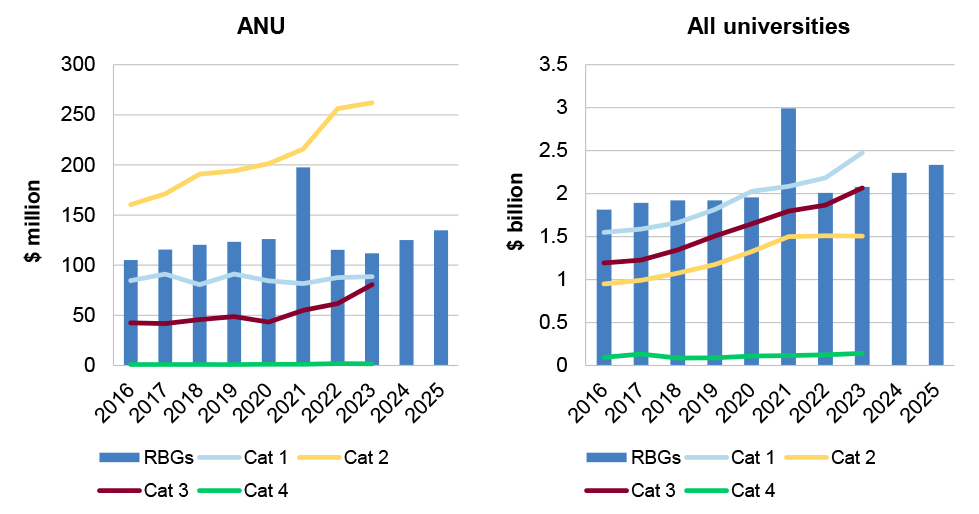
Note a: For the purposes of reporting to the Department of Education, university research income is divided into four categories: Category 1: Australian competitive grants; Category 2: Other public sector; Category 3: Industry and other; and Category 4: Cooperative Research Centres.
Note b: Research block grants (RBGs) provide funding to eligible Australian higher education providers to support research and research training. RBG funding is allocated based on university research income data and higher degree by research student completions.
Note c: As of December 2025, the Higher Education Research Data Collection (HERDC) is only available up to 2023.
Note d: The 2021 increase in RBGs is due to a one-off COVID-19 relief payment made via a $71.6 million payment to the ANU (additional $1 billion across the sector) provided through the Research Support Payment.
Source: ANAO based on Department of Education data.
Australian Government grants and student fees are not sufficient to cover ANU expenses without supplementation from other income sources
2.24 ANAO analysis shows that while ANU identifies Australian Government grants and student fees as its key income sources, these have not been sufficient to cover ANU’s expenses without supplementation from other income sources. The gap between total expenses and total key income has ranged from 25.0 to 25.7 per cent since 2020, except for improvements to 12.0 per cent in 2021, and 20.3 in 2025, due to declining expenses (Figure 2.6). This means that audited positive net operating results have usually (with the exception of 2018) relied on other income sources, such as investment income, consultancy and contracts, and other income.59 As of 2024 (latest available comparable data) ANU derives a higher proportion of its income from these sources than the sector average, or Group of Eight (Go8) research intensive universities, of which ANU is one (Figure 2.7).60 With the exception of significant declines in investment income in 2020 and 2022, which are attributable to unrealised losses in the value of financial assets (paragraph 3.13), income from these additional sources has been generally increasing.
Figure 2.6: ANU revenue by source, total of key incomea,b, and total expenditure, 2016 to 2025c
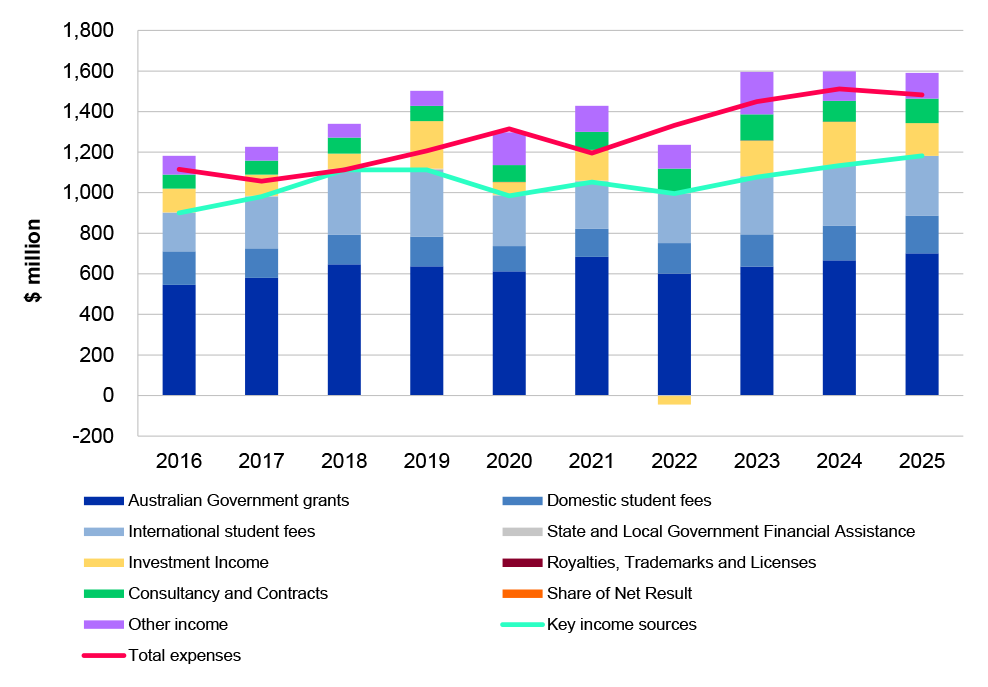
Note a: Key income includes Australian government grants (including subsidies for domestic students through the Commonwealth Grant Scheme, research grants, and the National Institutes Grant), and student fees, including domestic student fees (comprising upfront student payments and student contributions, and advances on student loans by the Australian Government) and international student fees.
Note b: Other income comprises: donations and bequests; scholarships and prizes; non-government grants; net gain on disposal of property, plant and equipment; net foreign investment gains; revenue related to service concession arrangements; and other revenue (not elsewhere classified).
Note c: The 2021 increase in Australian Government grants is due to a one-off COVID-19 relief payment made via the Research Support Program.
Source: ANAO analysis of Department of Education and ANU data.
Figure 2.7: Relative share of income by source of income, all universities, Group of Eight, and ANU, 2024
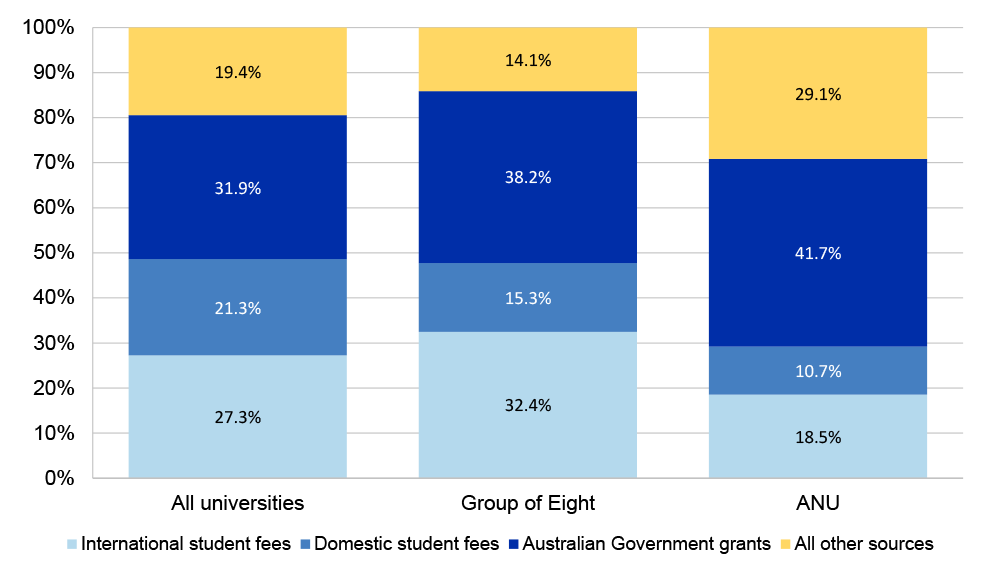
Source: ANAO analysis of Department of Education and ANU data.
The ANU has previously experienced and recovered from financial setbacks
2.25 Auditor-General Report No. 30 1996–97 Australian National University Administration states:
The main factors affecting current and future administrative operations of the ANU are reduced revenues and increased operating costs. The ANU is particularly dependent on the Commonwealth; with $266m or 67 per cent of all monies coming from the Commonwealth in 1995. In 1997 the funds available for teaching and research will be reduced by $30 million because:
- Commonwealth funding for universities generally, is being reduced in real terms;
- student enrolments are expected to decrease slightly. Local enrolments could fall because of increased Higher Education Contribution Scheme (HECS) charges while the University expects fewer fee paying students because of increasing competition from Australian and overseas universities; and
- operating costs have risen following an enterprise bargaining agreement negotiated late in 1996 which has led to salary increases that will not be met by increased Commonwealth funding.
As a consequence, academic, technical and administrative staffing levels are being reduced to enable the ANU to meet future budget requirements.61
ANU’s strong but declining financial position points to sustainability challenges
2.26 Financial performance is how well an entity uses its resources in achieving its purpose. Although there are no Australian Government performance targets or benchmarks setting out what good financial management looks like (paragraphs 9 to 12), financial performance is generally measured using financial statements (operating result, balance sheet, and cash flow) and metrics like profit margin, revenue growth, assets to liabilities, and capital turnover.
2.27 The ANU uses three measures to report on its finances (Table 2.1). Using these, ANU has reported eight audited positive net operating results and five unaudited positive underlying operating results since 2016 (Figure 2.8). The unaudited underlying operating results diverged from the audited positive net operating results in 2023, 2024, and 2025.
2.28 Year-to-year variations (as shown in Figure 2.8) are most attributable to changes in investment returns and one-off adjustments to the underlying operating result. There is no approved documented basis for one-off adjustments to ensure reporting validity or consistency.62 For example:
- in 2017, and each year from 2020 to 2024, staff separation expenses (and one year of savings in 2023) totalling $107.2 million were removed on the basis that they represent one-off restructuring costs63; and
- in 2021, $49.7 million of $71.0 million COVID-19 relief income, delivered via the ongoing RBGs, was excluded on the basis that the income was not ongoing, while the remaining amount was not excluded due to limitations in ANU’s ability to track expenditure by revenue source.
2.29 Although other Go8 universities report underlying operating result, ANU does not have assurance that other universities calculate the underlying operating result in the same way it does.
2.30 Reliance on these metrics for decision-making, in the absence of other financial information, creates risks associated with a lack of understanding of the university’s full financial position and performance. In particular, risks are that audited net operating results, cash flows and liquidity, and assets and liabilities, are not well understood by decision-makers (paragraphs 4.5 and 4.22).
Table 2.1: ANU measures of financial performance, as of December 2025
|
Measure |
Method |
Purpose |
Assurance |
|
Net operating result (audited; published in annual report) |
Net result after income tax from continuing operations, presented in accordance with the Australian Accounting Standards and rules made under the Public Governance, Performance and Accountability Act 2013 (PGPA Act). |
Prepared to meet the Accountable Authority’s responsibilities under the PGPA Act for the preparation and fair presentation of annual financial statements that comply with Australian Accounting Standards and the rules made under the PGPA Act. |
Independently audited by the ANAO. |
|
Underlying operating result (not audited; published in annual report) |
ANU adjusts its audited net operating result each year to arrive at an underlying operating result which excludes:
These adjustments are detailed in Appendix 3. |
ANU’s own adjusted measure of financial sustainability, the underlying operating result has been published in ANU annual reports since 2012. In 2015, draft advice (from Flagstaff Consulting Group) stated ANU’s financial statements should reflect its underlying financial performance and position. The underlying operating result is prepared annually, and performance against this measure is not monitored by Council during the year. |
No independent audit or assurance. The ANU documents the calculation of the underlying operating result each year in a single calculation spreadsheet. ANU has no methodology or process documentation to guide finance staff to complete this work consistently from year-to-year. This raises the risk of a lack of consistency in calculations and usage from year-to-year. |
|
Management operating result (not audited; not published) |
The management operating result is calculated monthly, and includes all revenue and expenses from continuing operations, subject to the same adjustments as the underlying operating result, except items which cannot be calculated until the end of the year (including most one-offs detailed in Appendix 3). |
Used to prepare the annual ANU budget and for regular reporting to Council and its committees. Reporting and budget documents provided to ANU Council between 2020 and 2025 did not consistently explain the reconciliation between the unaudited management operating result and audited net operating result, or specify which measure is being used. |
No independent audit or assurance. |
Note a: Investment fund expenses include borrowing costs, operational expenses of the investment office, endowment distributions and Commonwealth Superannuation Scheme (CSS) pension cost.
Source: ANAO based on ANU documents.
Figure 2.8: ANU reported net operating result, underlying operating result, and management operating result, 2016–2025a ($m)
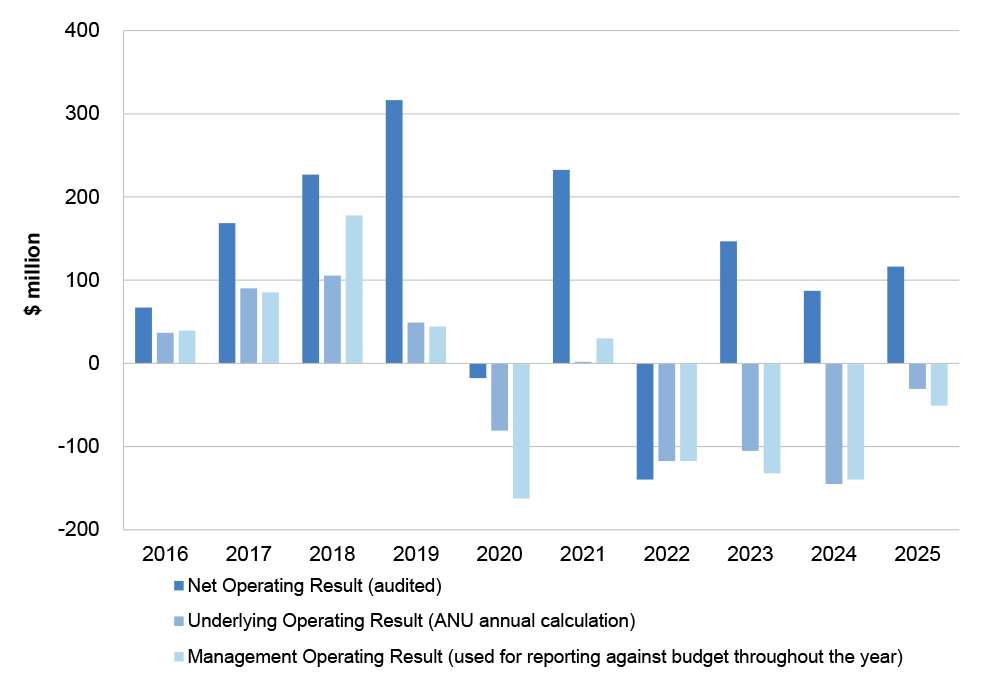
Note a: The 2021 underlying operating result (ANU annual calculation), which is not visible in this chart, was $1.997 million.
Source: ANAO analysis of ANU data.
ANU had large net operating surpluses from 2020 to 2025, but declines between 2020 and 2024 indicate financial sustainability could be a challenge in the long term
2.31 The ANAO is ANU’s independent auditor of its financial statements. Since 2016, the ANAO has made 4 category B financial statements audit findings (poses moderate business or financial management risk to the entity) and 21 category C financial statements audit findings (poses a low business or financial management risk to the entity) (Table 2.2).64
Table 2.2: ANAO audit of ANU financial statements, 2016–2024a,b
|
|
2016 |
2017 |
2018 |
2019 |
2020 |
2021 |
2022 |
2023 |
2024 |
|
New ANAO audit findings |
1 |
3 |
2 |
4 |
1 |
6 |
0 |
3 |
5 |
Note a: As of May 2026, the 2025 financial statements audit findings have not been finalised. These will be included in the ANAO Interim Report on Key Financial Controls of Major Entities, due to be released in June 2026.
Note b: The larger than usual number of findings in 2021 and 2024 reflect new IT findings identified, and one risk management finding. Whilst not having any risk of material misstatement for financial statements, this is a business risk.
Source: Financial Statements Audit Closing Letters 2016–2024.
2.32 The ANAO produces analysis of material entities’ audited net operating results across the Government sector, based on averages over a five-year period.65 In this work, an average result greater than one per cent of total expenses over the previous five years is considered a large surplus.66 ANAO analysis of ANU audited net operating results based on this method (Figure 2.9) shows large average surpluses for the five years prior, albeit coupled with declining performance since 2020 and improvement in 2025 — the 2021 improvement evident in Figure 2.9 is associated with the one-off Australian Government COVID-19 relief payment provided through the RBGs. The decline between 2020 and 2024 indicates financial sustainability could be a challenge for ANU in the long term if these five-year trends are not well understood and addressed.
Figure 2.9: ANU audited net operating results and rolling five-year average, 2020 to 2025
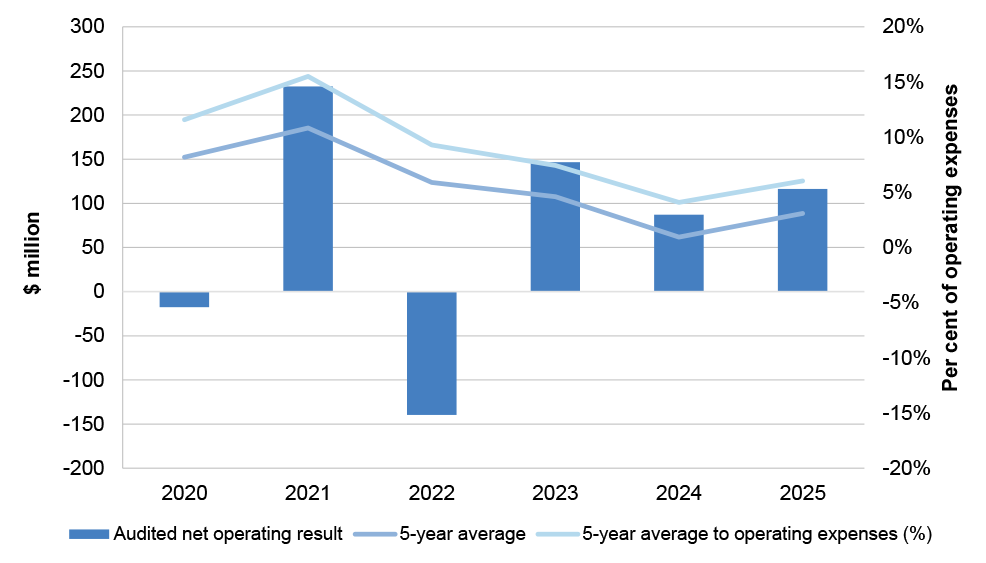
Source: ANAO analysis of ANU data.
TEQSA financial risk assessment found ANU is a low financial sustainability risk
2.33 The ANU, like other universities, is required to provide audited financial statements to TEQSA. For each calendar year reporting period, financial reporting is due by the end of June the following year (i.e. data for 2024 was due by 30 June 2025).
2.34 TEQSA uses this data to assess financial risks. TEQSA’s most recent risk assessment of ANU recorded a low financial viability risk based on 2023 data for the calendar year 2022 (improved from moderate based on 2022 data), and a low financial sustainability risk. On 7 April 2026, TEQSA advised the ANAO that ‘TEQSA’s risk assessments are prepared for the purposes of informing TEQSA’s approach and are not intended to provide providers themselves with an assessment of their own risks’.
2.35 In December 2025, TEQSA announced it would be retiring its risk model of individual provider risk assessments, due to:
- its reliance on lagged data (for example, financial risk assessment in 2025 relied on 2023 data);
- the risk of over-stating or under-stating risk due to missing context; and
- a desire to rebalance the focus between individual providers and system-wide risks.
2.36 TEQSA intends to move towards a model that focuses on the provider’s own management of risks, and the use of data to monitor sector-wide risk trends over time.
ANU’s high level of available financial resources and low debt servicing needs means it has a AA+ credit rating
2.37 Since 2020, despite noting challenges in enrolments and operating margins, S&P, ANU’s credit rating agency, has not reduced ANU’s long term credit rating, which has consistently been AA+.
2.38 Credit ratings provide a forward-looking opinion about an issuer’s relative creditworthiness, from AAA (extremely strong capacity to meet financial commitments) to D (payment default, breach of imputed promise, or bankruptcy).67 S&P provides ratings to ANU and five other Australian universities. A high credit rating will generally provide access to debt at a lower interest rate, subject to the borrowing limit set by the Finance Minister (paragraph 1.6).
2.39 According to S&P analysis, the basis for ANU’s rating is:
- ANU’s high level of available financial resources and low debt servicing needs; and
- a high likelihood that the Australian Government would provide support to ANU if it were in financial distress.
ANU’s debt to equity ratio is comparable to other universities
2.40 ANU’s debt-to-equity ratio has consistently exceeded the Go8 average since 2016 (partly due to ANU’s liability in relation to student accommodation service concession arrangements, as discussed in paragraph 3.23), but has improved since 2020, and has been in line with the Go8 since 2023 (Figure 2.10).
Figure 2.10: ANU, Group of Eight, and all university debt to equity ratio, 2016–2024
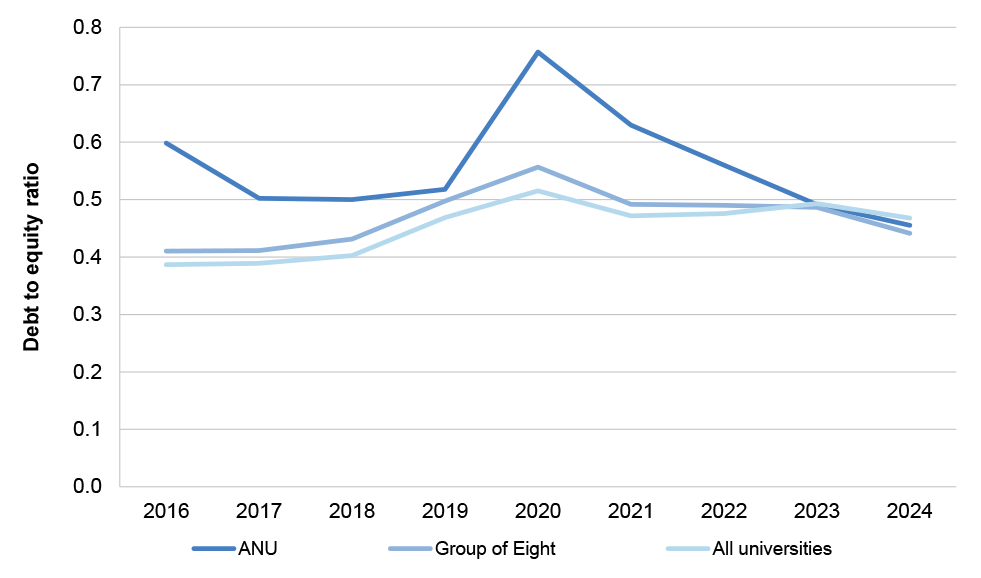
Source: ANAO analysis of Department of Education data.
2.41 ANU’s performance against other commonly used financial indicators, in comparison with all other Australian universities (as of 2024) is provided at Appendix 4. ANU’s performance was in some cases stronger than, and in other cases weaker than, the average of all universities against these indicators.
3. Financial pressures and conditions leading to Renew ANU
ANU ended 2019 with a $317 million surplus according to its audited financial statements. After revenue declined by 13.6 per cent in 2020, ANU analysis shows that it lacked the mechanisms required to control spending. The university pursued savings and drew down on its investment income for temporary support, but judged this was not sustainable in the longer term.
Despite repeatedly basing budget estimates on revenue growth from international student fees, ANU did not achieve planned growth, and ended 2023 with a focus on reducing spending. This is indicative of a misalignment between forecasts and international student recruitment.
In 2018, ANU adopted a vision for a ‘human scale’ university
3.1 In the three years to 2018, ANU student numbers grew by 18.7 per cent to 20,281 equivalent full time student load (EFTSL), driven primarily by increases in international student enrolments.68 In February 2018, ANU Council considered the impact of this growth, which had occurred without a strategic decision to become a larger institution, and approved a proposal from the Vice-Chancellor to cap enrolments for a ‘human scale’ university. In a public mid-year update to staff and students in July 2018, the Vice-Chancellor explained:
For those people coming to ANU from every walk of life, I want ANU to continue to provide a unique personal education experience for our students. But to do that, we need to remain relatively small.
3.2 In July 2018, implementation arrangements were agreed by Council, including a target of 19,204 EFTSL by 2022. Planned reductions were targeted by student cohort to:
- reduce undergraduate student numbers, including domestic undergraduate students, as the Australian Government had announced a cap on Commonwealth Grants Scheme (CGS) funding in December 2017;
- increase domestic postgraduate coursework and higher degree research students;
- diversify source countries for postgraduate international coursework students;
- improve the university’s student to staff ratio; and
- increase student numbers in the College of Engineering and Computer Science.
3.3 The decision was supported by a five-year financial scenario model, stress testing of the model against geopolitical and Australian Government funding changes, and modelling of the financial impact of the change, which was expected to reduce the university’s operating margin to 3.0 per cent (or a $37.0 million unaudited underlying operating result) in 2020.
3.4 Implementation of the plan began in 2019 with winding up pathway programs, which accounted for 35.7 per cent of international students admitted to ANU in 2018. Broadly, ‘pathway programs’ for university entry for international students consist of Foundation Studies (six to twelve months study to meet the academic requirements for entry to university study) and English Language Intensive Courses for Overseas Students (ELICOS, five weeks to 12 months study to meet English language requirements for entry to university study).69 A conditional offer allows an international student to enter Australia to undertake either Foundation or ELICOS study for up to a year, then (on successful completion) advance to the first year of an undergraduate degree.70
3.5 ANU ended 2019 with a $317 million surplus (based on audited net operating result, Figure 2.8), and the expectation that its 2020 operating margin would be reduced to 3.0 per cent due to planned reductions in student numbers (paragraph 3.3).
ANU reported a $17.7 million loss in 2020, driven largely by the economic effects of the pandemic on investment earnings
3.6 By the end of 2020, total ANU revenue had declined 13.6 per cent compared with 2019, and ANU reported a $17.7 million loss (based on audited net operating result) for that calendar year.
3.7 The reduction compared with 2019 was driven by declines across government grants, investment income, and student fee revenue with the largest decline being a $172.9 million decline in investment income in 2020, compared with 2019 (Table 3.1).
Table 3.1: Change in ANU income by source of fundsa, 2019 to 2020
|
Year |
State and local government financial assistance ($) |
Australian Government grants ($m) |
Domestic student fees ($m) |
International student fees ($m) |
Investment income ($m) |
All other ($m) |
|
2019 |
6.3m |
637.6 |
146.0 |
328.9 |
234.4 |
149.1 |
|
2020 |
6.1m |
613.0 |
124.0 |
248.1 |
61.5 |
244.9 |
|
Difference from 2019 to 2020 |
-151,000 |
-24.6 |
-21.9 |
-80.9 |
-172.9 |
95.7 |
Note a: All other comprises: royalties, trademarks and licenses; consultancy and contracts; share of net result; donations and bequests; scholarships and prizes; non-government grants; net gain on disposal of property, plant and equipment; net foreign investment gains; revenue related to service concession arrangements; and other revenue (not elsewhere classified).
Source: ANAO based on Department of Education and ANU data.
COVID-19 border closures reduced ANU’s student fee income beyond the reduction planned in 2018
3.8 Beginning in February 2020, COVID-19 border closures reduced international student numbers across Australia, undermining a key source of revenue for universities. ANU’s choice to wind up pathway arrangements in 2019 (paragraph 3.4) meant most international students commencing the first year of undergraduate study at ANU in semester one 2020 were expected to enter the country that year, whereas in 2018 around one third of commencing international undergraduate students would have already been in Australia.
3.9 ANU student load fell by 2,380 EFTSL from 2019 to 2020 (Figure 3.1), more than double the multi-year reduction of 782 EFTSL by 2022 targeted by the 2018 decision to cap student numbers. The actual reduction from 2019 to 2020 comprised:
- 1,707 international students — the plan to cap student numbers was based on 8,291 international EFTSL in 2020, so actual EFTSL of 6,423 was 1,868 EFTSL below expectations; and
- 673 domestic students — the plan to cap student numbers was based on 11,190 domestic EFTSL in 2020, so actual EFTSL of 11,039 was 151 EFTSL below expectations.
Figure 3.1: ANU equivalent full time student load (EFTSLa), 2016 to 2025
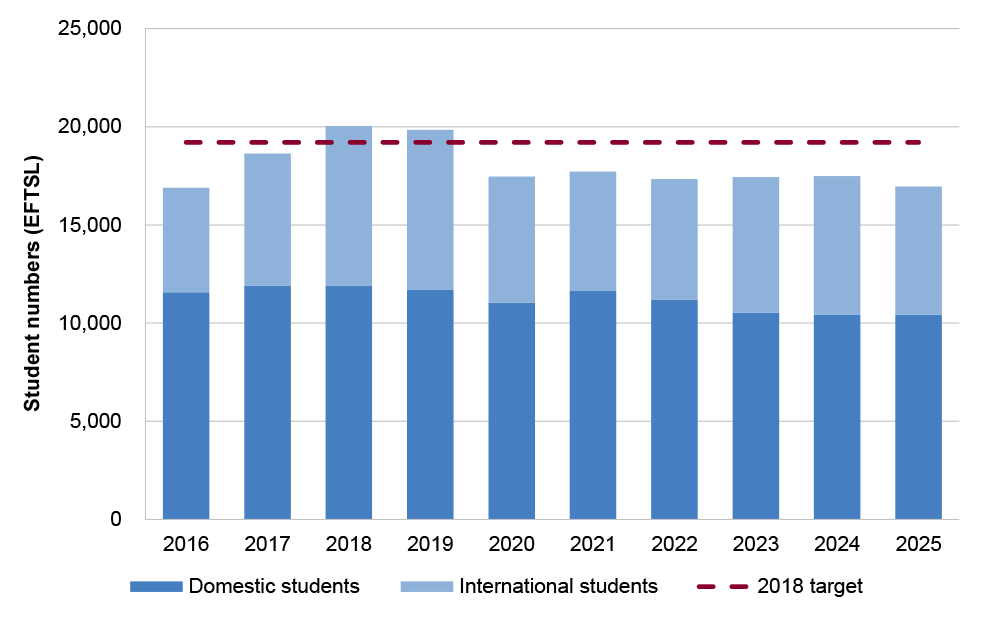
Note a: Equivalent full time student load (EFTSL) is a standardised measure of a student’s academic study load over a year. An EFTSL of 1.0 represents the full annual workload for a full-time student.
Source: ANAO based on Department of Education data.
3.10 The difference between planned and actual reductions in student numbers in 2020 equated to an approximately $32.2 million shortfall in the ANU budget.71 This was the approximate size of the ANU’s expected unaudited underlying operating result for 2020, estimated in the ANU Budget approved in December 2019 (paragraph 3.3). This means that if the 2020 ANU Budget had been otherwise correct, the university would have broken even on an underlying operating result basis, despite the larger than expected fall in student numbers.
The economic consequences of COVID-19 reduced ANU’s reported investment income, largely due to changes in the fair value of financial assets
3.11 While primarily a public health emergency, the introduction of public health measures such as border closures in early 2020 significantly reduced economic activity.72 Australia’s Gross Domestic Product (GDP) fell, unemployment increased, and inflation declined.73 The broader economic effects of the pandemic had a much larger immediate effect on ANU’s income than the fall in student numbers, via the university’s investment earnings (Figure 3.2), which fell by $172.9 million, from $234.4 million in 2019 to $61.5 million in 2020.
3.12 This occurred in the context of ANU’s greater reliance on non-teaching and non-grants income than comparable universities (Figure 2.7), and represented a decrease in investment income as a share of ANU income from 15.6 per cent in 2019, to 4.7 per cent in 2020. In contrast, the total fall from all other sources from 2019 to 2020, including state and territory government and Australian Government grants, and domestic and international student fees (including planned reductions due to the 2018 decision to cap student numbers) was $127.6 million.
3.13 While investment income has a large apparent effect on ANU’s income, including the fall in income as a consequence of COVID-19 (Table 3.1), an investment income gain or loss as reported in ANU’s financial statements is not necessarily an increase or decrease in the cash immediately available to the university. In 2019 to 2020, $153.4 million of ANU’s fall in investment income (88.7 per cent) is attributable to the loss in the fair value of financial assets. Similarly, in 2022, ANU reported a $43.9 million loss from changes in asset valuations and investment returns. In both cases, the assets continued to be held, meaning the loss was recorded, but not realised.
Figure 3.2: ANU investment incomea, 2016 to 2025
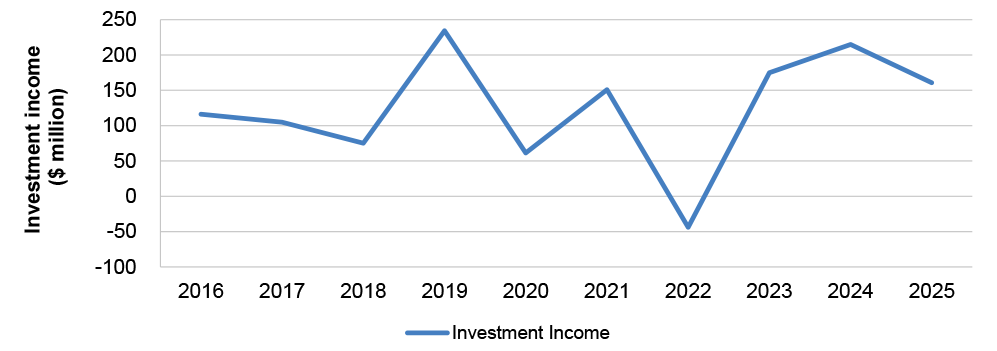
Note a: ‘Income’ here refers to a gain or loss reported in ANU financial statements. This is not necessarily an increase or decrease in the cash immediately available to the university. Of the two large decreases shown in the chart: in 2020, ANU’s reported investment income fell by $172.9 million compared with 2019, of which $153.4 million was attributable to changes in asset valuations. In 2022, ANU reported a $43.9 million loss from changes in asset valuations and investment returns. In both cases, the assets continued to be held, meaning the loss was recorded, but not realised.
Source: ANAO based on Department of Education data.
ANU drew on investment income to fund operational expenses during the first year of the pandemic
3.14 ANU maintains investment funds (Figure 3.3) to manage donations and bequests designated for scholarships, prizes, foundations, and endowments, and to meet employer liabilities under the Commonwealth Superannuation Scheme (CCS). It treats investments for the purposes of CCS and donations and bequests (where there was an expressed purpose for which the donor provided the funds) as ‘restricted’, but does not have any legal structure in place to formalise this, such as a trust.74
3.15 Since 2016, ANU has reported at least $833 million in ‘restricted’ funds annually in its financial statements. The value of ‘unrestricted’ funds during the 2016 to 2025 period ranged from $459.7 million to $762.0 million. On 11 June 2020, the Finance Committee (now known as the Audit, Finance and Risk Committee) approved withdrawal of $200 million (unrestricted) investment proceeds to use for operational costs as part of ANU’s response to COVID-19. ANU advised the ANAO on 27 November 2025 that smaller withdrawals were completed, including revising of investment fund accounts, to be used for operational expenses. There was no evidence of smaller withdrawals or outcomes of investment fund account reviews being reported to Council or Finance Committee. Paragraph 4.13 discusses the sustainability of this approach.
Figure 3.3: ANU’s investment balance by classification, 2016 to 2025
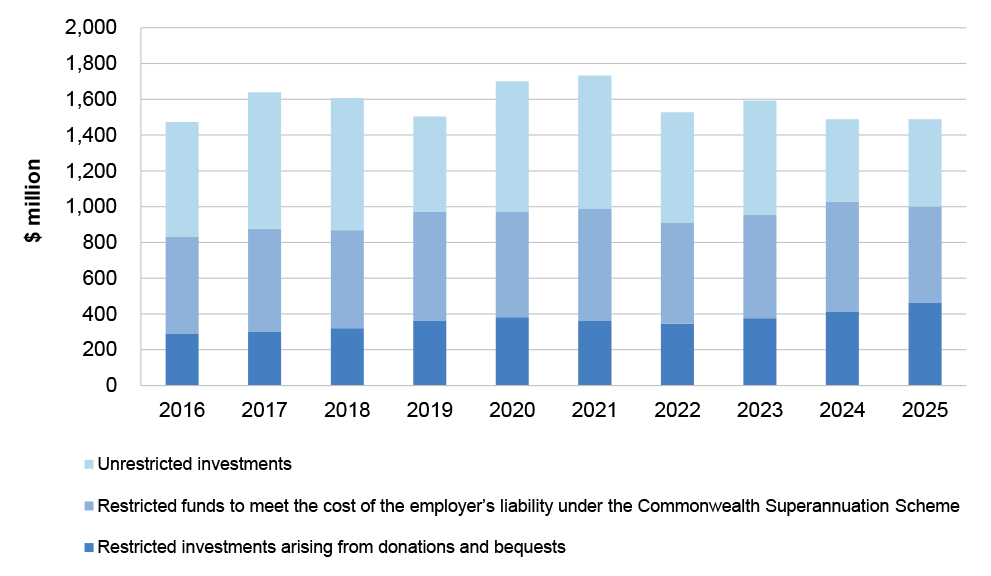
Source: ANAO analysis of ANU data.
ANU international student numbers did not recover when borders reopened
3.16 ANU student numbers reached 17,462 EFTSL in 2020, including 6,423 international enrolments, well below the 2018 target of 19,204 EFTSL by 2022 (paragraphs 3.2 and 3.9). The ANU Recovery Plan, released in October 2020 in response to COVID-19, acknowledged that the downturn in student numbers meant ANU would need to grow towards its target for a ‘human scale’ university, rather than reducing student numbers to achieve it.
3.17 In 2021 (for the 2022 Budget), ANU began looking at recovery from the 2020 financial shock of the pandemic. The 2022 budget (Figure 3.4) assumed growth would resume in 2023. At the end of 2022 (for the 2023 ANU Budget) assumptions about when growth would resume were revised to 2025.
3.18 ANU exceeded its targets for international enrolments in 2022 and 2023, and by the end of 2023, the data suggested recovery could be in progress. In 2023, sector-wide international enrolments had recovered to near 2019 levels, and although ANU enrolments were still well below its 2019 level, applications had increased by over 7,000 compared with the previous year, to 28,728 (Figure 3.5). On 1 December 2023, ANU Council approved the 2024 ANU Budget, which included an increased target for international enrolment growth in 2024 of 7,566 EFTSL. The 2024 target was not achieved, and assumptions for 2025 were revised down (Figure 3.4).
3.19 Between 2021 and 2024 (for the 2022 to 2025 budgets), ANU forecasts were consistently incorrect as they related to international student numbers, suggesting insufficient alignment between student recruitment and financial planning.
Figure 3.4: ANU international student enrolment budget estimates and actuals, 2022 to 2029 (EFTSLa)
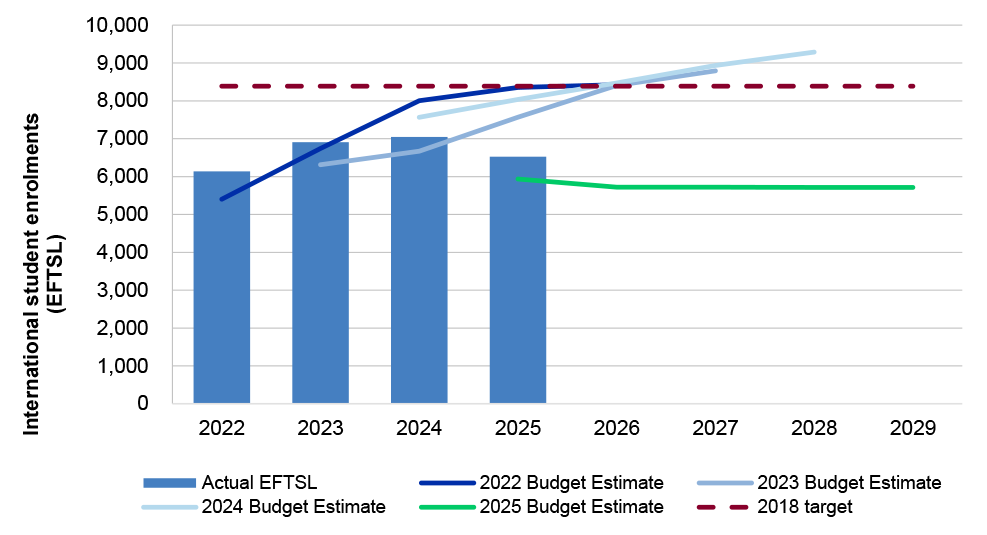
Note a: Equivalent full time student load (EFTSL) is a standardised measure of a student’s academic study load over a year. An EFTSL of 1.0 represents the full annual workload for a full-time student.
Source: ANAO analysis of ANU data.
Figure 3.5: International applicationa, offerb, and acceptance count, and acceptance ratec, compared with actual enrolments, 2016 to 2025
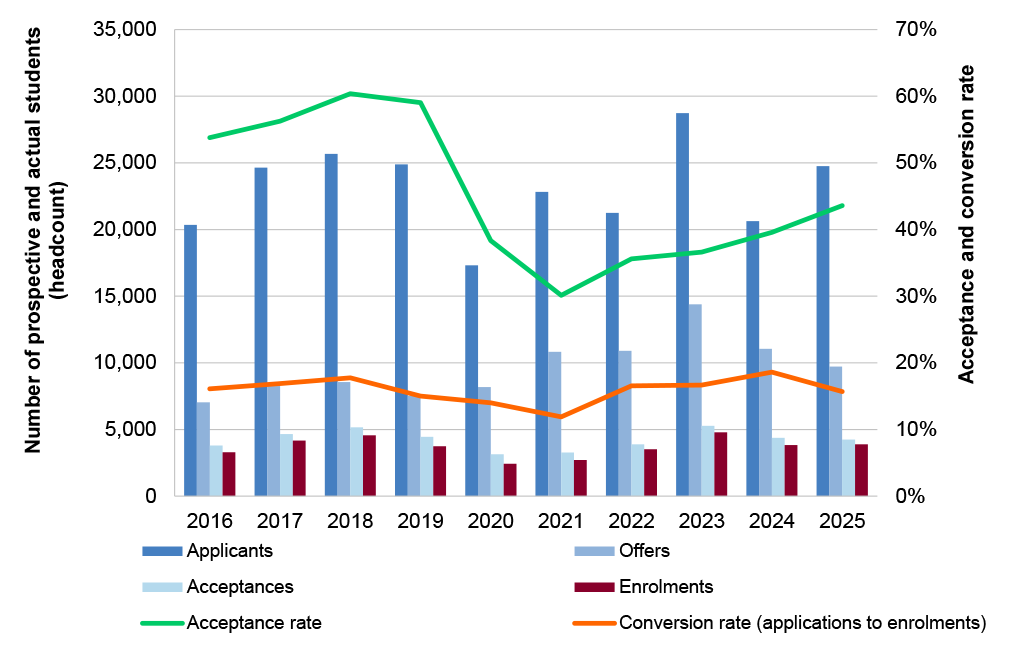
Note a: Includes applications by international students already enrolled at ANU.
Note b: Offers are offers made for the relevant year to historical applicants.
Note c: Acceptance rate is the number of acceptances over the number of offers.
Source: ANAO based on ANU data.
Spending rapidly resumed after the financial shock of the pandemic
3.20 In July 2020, in response to the impact of COVID-19, the ANU Council approved a revised 2020 ANU Budget, which forecast a deficit of $219 million for 2020 (actual audited net operating result in 2020 was a $17.7 million loss). ANU’s detailed COVID-19 response, the ANU Recovery Plan, was then released in October 2020. The Plan indicated ANU would need to reduce ongoing expenditure by $103 million per year, take on more debt to fund capital investment projects that were already underway, and cash requirements, run a deficit from 2021 to 2023, and use these years to ‘make the changes necessary to support our ongoing financial health’. The target break-even point was set at 2024, but in 2022 this was revised to break even by 2026.
3.21 Although spending fell in 2021, it began increasing again from 2022 (Figure 3.6). This was largely driven by:
- the fact that the 2021 decrease in spending relied on temporary measures, such as pauses on recruitment and travel, and deferred pay rises and senior executive pay cuts;
- rehiring staff, such that between 2021 and 2024, academic staff numbers grew by 7.4 per cent, and professional staff numbers grew by 21.0 per cent, while student numbers fell; and
- spending on property, plant and equipment (PP&E), such that between 2016 and 2024 ANU considerably outspent the Group of Eight (Go8) and the sector, spending an average of $9.67 per person (students and staff) compared with the Go8 average of $4.01, and sector average of $2.87 (see Figure 3.7).
3.22 In 2004, long before Council’s approval of the plan to cap enrolment growth in February 2018, ANU had committed to invest in campus redevelopment. Between 2011 and 2016, ANU faced increasing pressure to address demand for student accommodation, and poor student experience of the campus environment. In response, ANU Council committed to:
- new student accommodation projects in August and September 2016 and December 2018, which were completed in 2018, 2019 and 2023; and
- a $262.9 million redevelopment of its central precinct, to create new and redeveloped educational and retail spaces, in April 2016, with construction starting in July 2017, and completion in 2019.
3.23 Between 2016 and 2022, ANU recovered some of its investment in PP&E by entering into agreements with third-party operators (that is, an independent company or entity that operates the business on behalf of the owner) to provide ANU student accommodation on its behalf. ANU received upfront financial contributions of $772 million in exchange for granting the operators the rights to the student accommodation revenue. As a condition of these agreements, ANU is required to maintain occupancy levels of 85 per cent or more to avoid financial penalties. No penalties were deducted in 2025, due to occupancy rates above 85 per cent. As of March 2026, one penalty of $149,449 has been deducted from ANU’s student accommodation-related income in 2026, due to occupancy below 85 per cent in March.
Figure 3.6: ANU revenue and expenditure and key milestones, 2016 to 2025
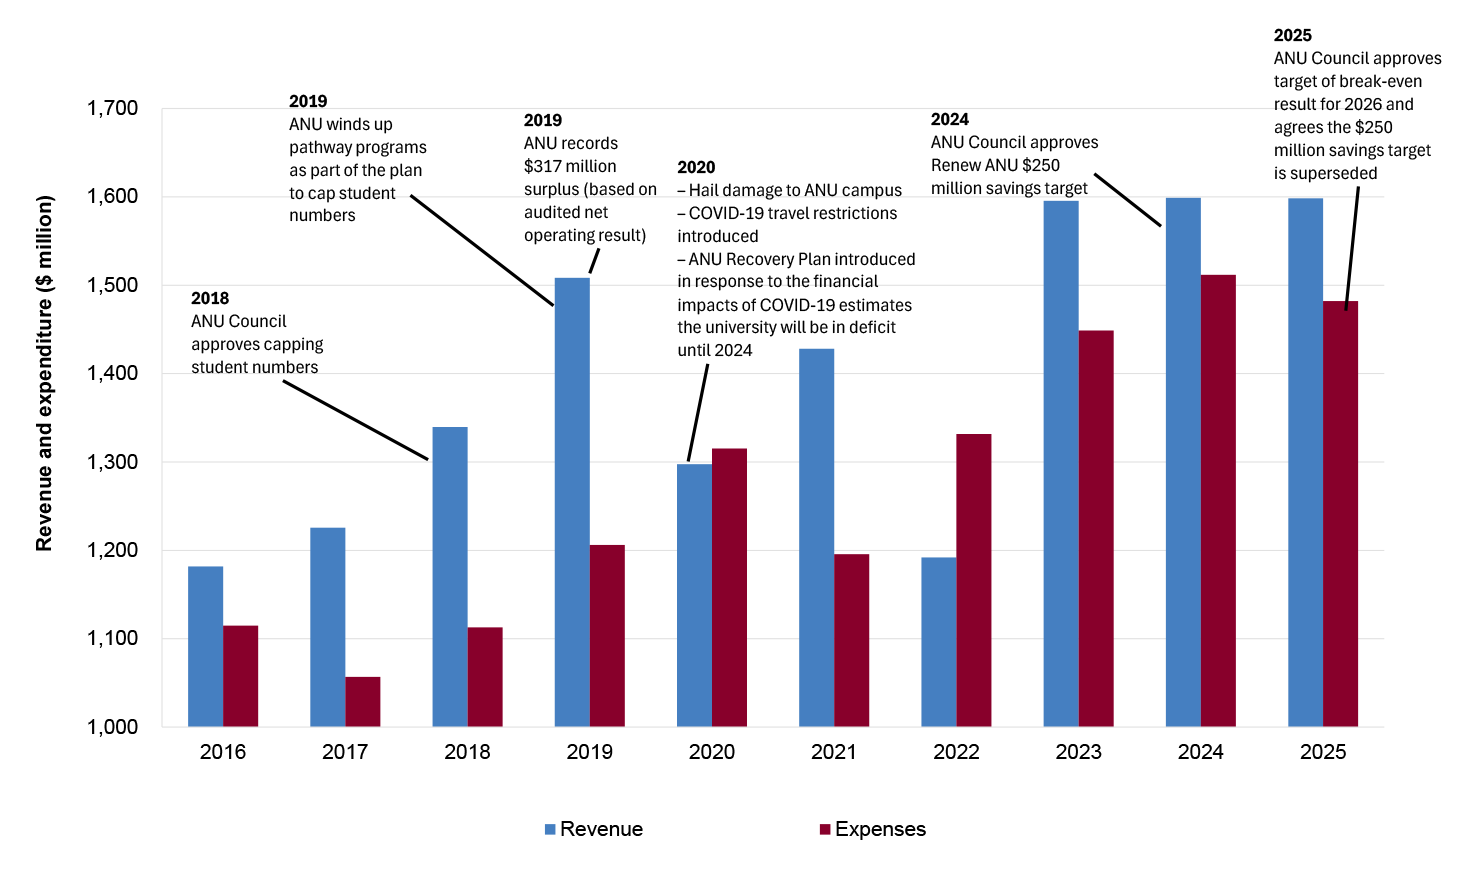
Source: ANAO analysis of ANU data.
Figure 3.7: Property, plant, and equipment (PP&E)a payments per personb, 2016–2024
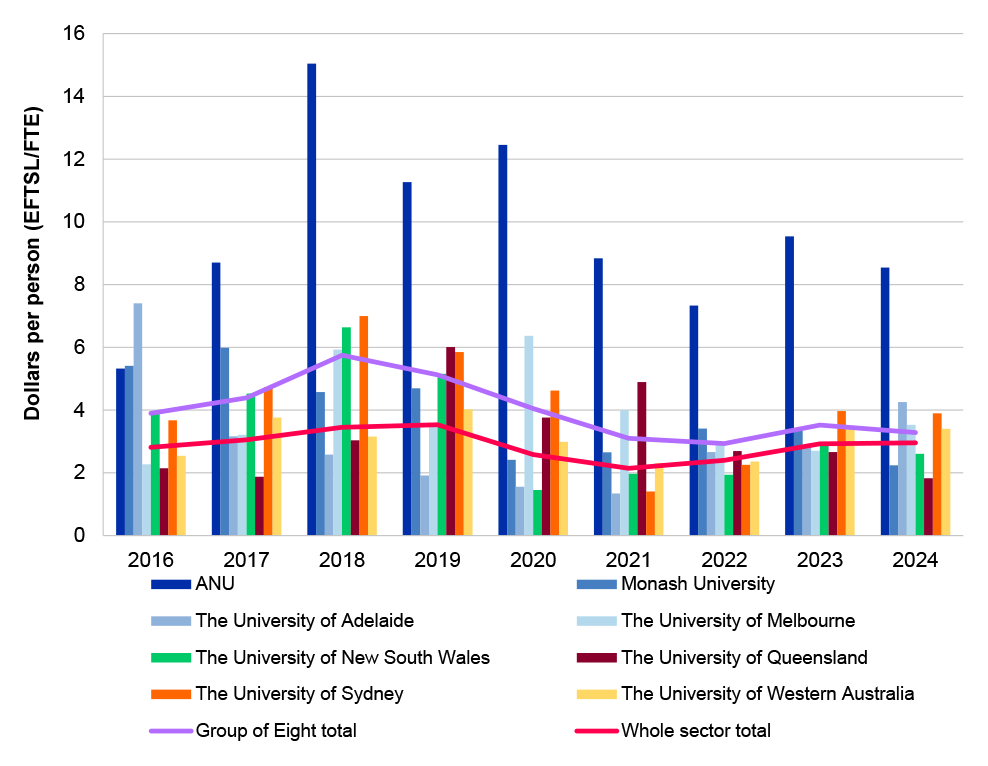
Note a: Payments for PP&E include construction in progress, land, buildings, infrastructure, leasehold improvements, library, operational assets, and non-operational assets such as artworks.
Note b: Persons include students (measured in EFTSL) and staff (measured in full time equivalence).
Note: The 2026 Tertiary Education Facilities Management Association produces normalised reports of university facilities and maintenance costs using a range of measures, including (but not limited to) operating costs per EFTSL. ANAO analysis of PP&E payments includes staff (FTE) and students (EFTSL) to account for universities with a high proportion of research only staff and associated investment in non-teaching PP&E.
Source: ANAO analysis of Department of Education data.
ANU lacked mechanisms to control spending when the 2020 financial shock of the pandemic occurred
3.24 ANU analysis shows that it lacked the mechanisms required to control spending when the 2020 financial shock occurred. In 2020, ANU’s control environment was characterised by:
- lack of forecasting and projections in the annual enterprise budget;
- no framework to apply ANU Budget efficiency dividends or other reductions to College spending;
- lack of cash and debt management strategy;
- delayed, incomplete, and poor or variable quality financial reporting;
- lack of hiring controls;
- lack of oversight of the Vice-Chancellor’s Strategic Fund;
- lack of ledger integrity at college and school level; and
- lack of internal purchase and procurement controls.
3.25 The areas targeted for financial control improvements from 2020 are summarised in Table 3.2, which shows ANU activities in response to deficiencies it identified between 2020 and 2025. As shown in the table, action on financial controls since 2020 can be divided between:
- 2020 to 2023 changes implemented as part of the COVID-19 response, including the ANU Recovery Plan; and
- 2024 and 2025 changes implemented as part of Renew ANU (see Chapter 4).
3.26 ANU has reported the major changes introduced from 2020 to 2023 (Table 3.2) were:
- The Expenditure Control Framework (ECF) budget was introduced in 2020 for the COVID-19 response and 2021 Budget. The ECF replaced the former budget ‘allocation model’ (where colleges and portfolios plan and spend based on their earned revenue from key activities, such as teaching and research, minus a contribution for central services). Under the ECF, which was still in place as of December 2025, a set amount is allocated to each college and central portfolio. This provided a framework to introduce efficiency dividends and other reductions in spending. On 15 October 2025, ANU staff advised the ANAO that the former activity-based approach had the benefit of directly linking planned activities within Colleges (such as course growth and emerging areas of research strength) with planned revenue and associated costs.
- The Financial Health Strategy approved by Council in May 2020 set out minimum cash-based ratios and thresholds, which guided the initial response to the impacts of COVID-19 in 2020. The thresholds included a minimum of $250 million in cash, which was equivalent to six month’s salary.
- ANU’s debt limit is set by the Finance Minister. In March 2020, the ANU Vice-Chancellor wrote requesting a borrowing limit of $800 million be granted. The request was approved on 29 March 2020.
- To avoid ‘another round of major University-wide job reductions’, the 2022 ANU Budget used the ‘top down’ ECF to introduce annual efficiency targets of $80 million from salary related costs savings (two per cent in 2023 and a further one per cent in 2024) and $80 million from non-salary related efficiencies (three per cent in 2023 and a further two per cent in 2025). To allow time for these to have their intended impact, the target to break even by 2024 was revised to 2026.
- Reporting and record keeping improvements were introduced from 2022, to provide a single source of truth for the presentation of financial results (there were previously seven different reporting approaches, which produced different results), and align the classification of income, expenses, assets, liabilities and equity in internal reporting with ANU’s statutory obligations for its financial statements.
- From March 2023, excess leave balances were recognised in divisional budgets, therefore forming part of the expenditure of local areas within the university.
3.27 Changes continued throughout 2024 and 2025, and these have also been included in Table 3.2.
Table 3.2: Financial management improvements reported by ANU, by year and issue, 2020 to 2025a
|
Issue |
Improvements reported by year |
|||||
|
|
2020 |
2021 |
2022 |
2023 |
2024 |
2025 |
|
Annual enterprise budget |
Expenditure Control Framework (ECF) Budget introduced |
Forward estimates of revenue and expenses |
No action reported |
No action reported |
No action reported |
No action reported |
|
Framework to apply reductions to spending |
Spending limits |
No action reported |
Annual efficiency targets |
Annual efficiency targets applied to business areas |
Additional mid-year reductions applied to business areas |
No action reported |
|
Cash and debt management strategy |
Council approved minimum cash ratios and thresholds |
No action reported |
No action reported |
No action reported |
Council approved revised minimum cash threshold |
No action reported |
|
Financial reporting |
No action reported |
No action reported |
New financial reports |
No action reported |
Real-time financial dashboards |
Student recruitment reporting |
|
Human resources (HR) controls |
No action reported |
No action reported |
No action reported |
Excess leave balances recognised in area budgets |
HR centralised; Recruitment Approval Committee |
Policy covering re-hiring after redundancy |
|
Financial oversight and accountability |
No action reported |
No action reported |
No action reported |
No action reported |
Vice-Chancellor’s Strategic Fund ended |
No action reported |
|
Financial record keeping |
No action reported |
No action reported |
No action reported |
New guidance |
Additional delegation requirements |
Policy and methodology clarifications |
|
Purchase and procurement |
No action reported |
No action reported |
No action reported |
No action reported |
No action reported |
Purchase card guidance and controls |
Note a: Activity over multiple years (for example, reporting changes) indicates successive changes, and is not necessarily indicative that work has been completed. The ANAO has relied on ANU reporting of improvements to develop this table. ANAO has not assessed if the changes constitute improvements against a framework.
Source: ANAO based on ANU records.
3.28 These actions focused on changes in policy and process — as of December 2025, ANU did not have assurance that arrangements were working as intended, and key deficiencies are evident in the ECF budget approach (paragraph 3.26), and reporting to Council (paragraph 4.5).
3.29 Further, quarterly reporting to Council and record keeping still rely on two unaudited measures (underlying operating result and management operating result, as outlined in Table 2.1) without clearly distinguishing between the different measures when used.
4. Actions to address financial pressures and conditions
Renew ANU, a plan to achieve financial sustainability via an organisational restructure and $250 million savings target (16.5 per cent of total expenses in 2024), was endorsed by the ANU Council in August 2024. At the time of this endorsement, Council had no clear evidence that $250 million in annual, ongoing savings by January 2026 was needed, achievable, urgently required, or likely to have the intended impact. By December 2024, analysis showed $133.4 million potential savings could be achieved, but no adjustment to the savings target or timeline was considered or made. The $250 million savings target was retired in October 2025.
As of February 2026, Renew ANU implementation has cost $35.9 million, and ANU reported it had achieved $74.8 million in annual salary savings. A more robust decision-making process by Council should have considered additional information, options, and perspectives, to achieve sustainable structural improvement to the ANU budget. As of January 2026, people risks and revenue risks remain.
From September 2023, ANU Council and executive were advised ANU was not on track to break even by 2026
4.1 In September and October 2023, the Audit, Finance and Risk Committee (then the Audit and Risk Management Committee, ARMC) and ANU Council were provided with information showing the university was not on track to break even on management’s unaudited underlying operating result basis by 2026 (this was the target agreed in the 2022 Budget, which was still in place, see paragraph 3.20). The ARMC considered ‘making prioritisation decisions and in some instances decisions to stop activities that are not aligned with our strategy or in some cases simply cannot afford’.
4.2 In early 2024, ANU underwent key personnel changes including a new Vice-Chancellor (January 2024), new Chief Financial Officer (April 2024) and new Chief Operating Officer (initially in interim capacity from July 2024).
4.3 From January to April 2024, the university executive sought external advice on ANU’s business model, including in comparison to other universities, and the question of how to achieve a positive operating margin. Three suppliers were approached, and Nous was contracted.75
4.4 On 9 February 2024, Council was advised that the university was tracking well against budget, but there were ‘concerns around student numbers as not where they were budgeted/predicted’.
4.5 At this time, financial reporting to Council did not:
- explain factors influencing the university’s financial sustainability — for example, where income from international student fees was lower than expected, Council was not provided with an explanation about why this might be the case;
- provide information about the university’s financial trajectory — that is, while year to date reporting was provided against the annual budget, it was not clear whether the results had improved or worsened compared with the previous quarter or previous year;
- explain the basis for forecast scenarios, including assumptions, the basis for the assumptions, or the operational plans underpinning forecasts; or
- explain whether reporting and associated financial analysis relied on the management operating result or underlying operating result, and, where used, the methodology used to calculate these (see paragraphs 2.27 to 2.30, and Table 2.1)76.
4.6 The Senior Leadership Group (SLG), an advisory body that brings together senior academic and professional leaders of the University, met weekly from 28 March 2024, with a view to improving operational controls and financial scrutiny.77
4.7 By the next Council meeting, on 5 April 2024, financial reporting revealed ‘it is likely that a revised 2024 full year revenue forecast will be significantly lower than the 2024 budget’ due to lower than forecast student revenue. Council held an out of session meeting on the university’s finances in May 2024, and were advised of SLG’s work at this meeting.
4.8 In June 2024, ANU Council discussed financial concerns in detail, including that controls were ‘not yet meaningfully changing outcomes’, the deficit was increasing (as measured by the underlying operating result, see Table 2.1), and student numbers were not hitting targets.
4.9 While no decision was made, ANU Council discussed how it could set priorities to address its financial concerns. The following issues were considered in discussion:
- reconsidering the university’s risk appetite;
- drawing on investment accounts (which at the time held a high level of cash), which would be lower cost compared with borrowing;
- the need to focus on revenue, while bringing spending down;
- the importance of a realistic timeframe for returning to surplus, and that realignment would be a ‘multi-year journey’;
- the need to involve Deans and College Managers in discussions and implementation of controls;
- the need to ensure functional and structural realignment delivered a lower cost university while maintaining the university’s values and national mission;
- the need to build and test different scenarios to shape thinking;
- the need to talk to all various stakeholders; and
- the importance of reporting to ensure realignment is monitored and remains on track.
4.10 In July and August 2024, the Finance Committee and Council agreed on the need to achieve a five per cent or greater operating margin (equal to approximately $250 million annual, ongoing savings) to satisfy their understanding of S&P’s criteria to retain ANU’s AA+ rating (see paragraphs 2.37 to 2.39 regarding credit ratings). The requirement was explained to the Finance Committee of Council on 26 July 2024:
The 5% or greater target represents the highest rating on S&P’s criteria and reflective of retention of the current AA+ rating. If this was in place for 2024, on a forecast Revenue of $1.343bn a Net Surplus of $67m would be required. This equates to a cost reduction in the order of $250m.
4.11 The endorsement of the 5 per cent operating margin acknowledged that a margin between 1 and 5 per cent would be sought ‘as the university returns to a positive operating margin over the 2025 to 2029 period’.
4.12 S&P’s risk assessment approach does not directly impose or require a fixed operating margin target. Instead, it analyses profitability, including operating margins, as part of a broader assessment of financial risk profiles.
4.13 Achieving a five per cent operating margin was a challenging prospect, as options discussed in the June 2024 meeting had been tried previously. Revenue measures, especially via efforts to increase student numbers (paragraphs 3.16 to 3.19) had not yielded expected results. Between 2020 and 2023, ANU had drawn on its investment income, with the intent of maintaining operating cash above $250 million. This continued in 2024, with the sale of shares valued at $44.8 million and withdrawal of $31.3 million investment income. Actual closing cash, compared with the balance adjusted to remove the impact of ANU’s choice to transfer assets into cash, is shown in Figure 4.1 — this shows that in practice a more conservative approach than planned was taken, with actual operating cash consistently above $300 million. On 5 December 2025, ANU advised the ANAO that drawing on investment income is not a sustainable way to meet ANU’s ongoing operational costs.
Figure 4.1: Impact of ANU drawing on investment income to support liquidity by quarter, January 2020 to December 2024
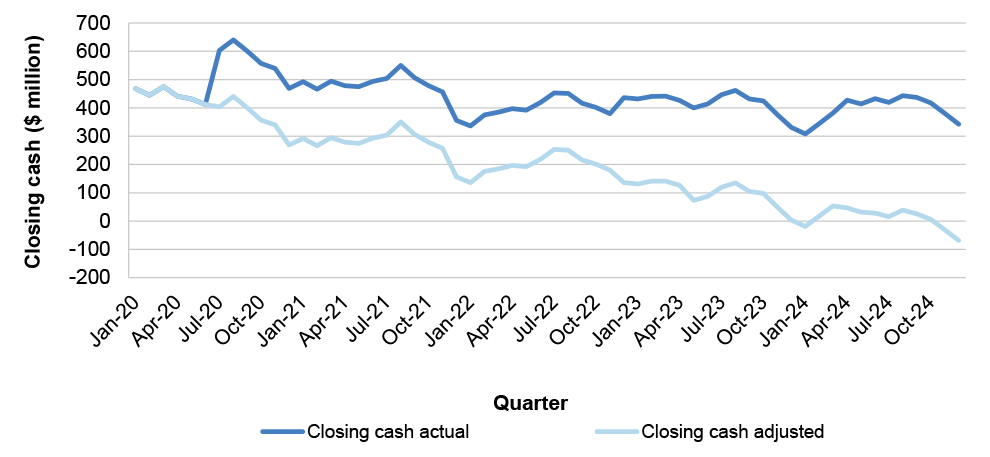
Source: ANAO from ANU data and analysis.
Renew ANU was approved by ANU Council in August 2024
4.14 Concerns about the university’s financial performance were not communicated beyond university management and Council until 20 August 2024, when the Vice-Chancellor shared publicly that the university was ‘spend[ing] more money each week than we bring in’ (on a management operating result basis, see Table 2.1).
4.15 On 9 August 2024, in response to the discussion in the June meeting, the Vice-Chancellor presented a proposal to Council for $200 million annual, ongoing savings (increased by Council to $250 million, see paragraph 4.17) from both salary and non-salary expenditure by the end of 2025 (Box 1). The proposal was based on a $202 million projected deficit in 2024, and analysis of ANU income, expenses and financial controls.
4.16 With the exception of one member, who was asked to leave due to a potential conflict of interest, 13 members and the Chair discussed the proposal. Council agreed that the conflict did not require the member to be excluded from discussing the proposal at the following meeting, in September 2024. Council records do not provide sufficient detail to determine the proportion of Council members who supported the proposal (see Appendix 2 for a detailed overview of the operations of Council), or the extent to which Council inquired into the proposal overall, which is recorded as ‘noted’, while the $250 million savings target (equal to 16.5 per cent of total expenses in 2024) is recorded as ‘endorsed’.78
|
Box 1: Renew ANU |
|
Renew ANU aimed to achieve financial sustainability by January 2026 via:
Renew ANU, as originally announced, ran from announcement in October 2024, to retirement of the savings target in October 2025, as shown below. Certain restructuring activities were ongoing as of January 2026. |
Figure 4.2: Timeline and key features of Renew ANU
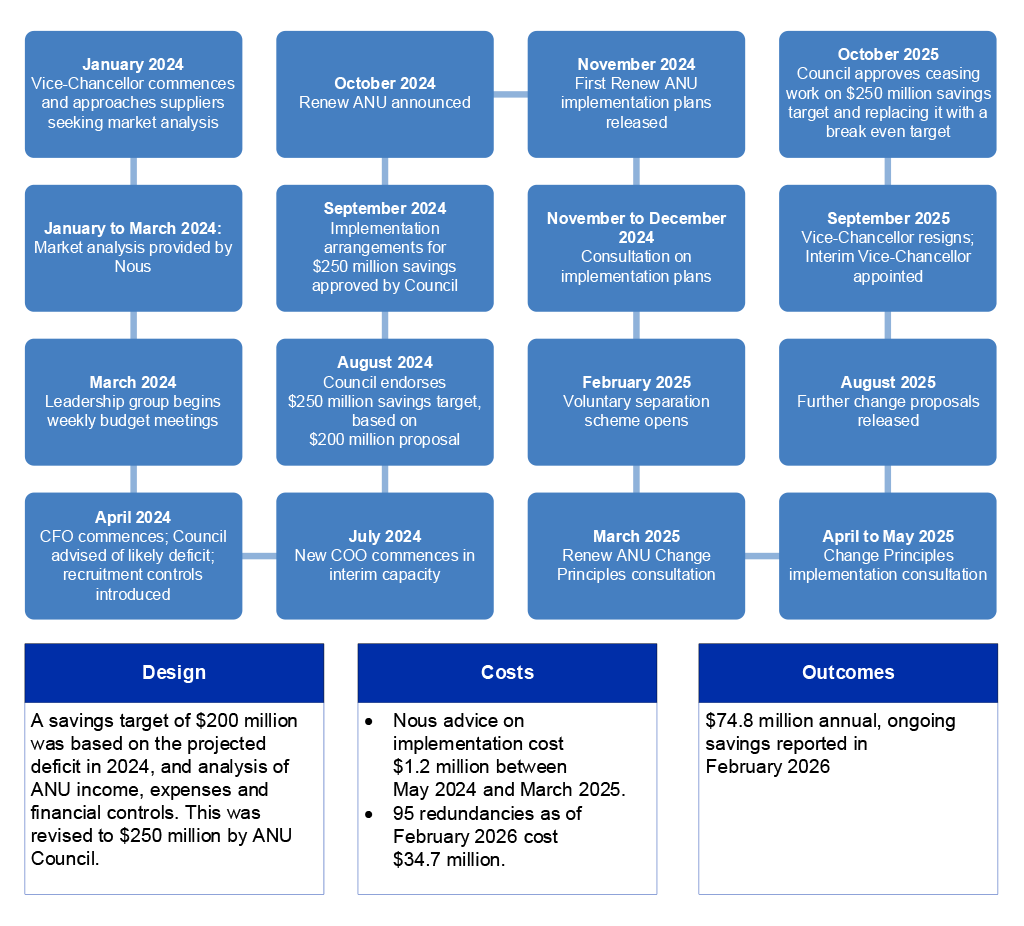
Source: ANAO based on ANU documents.
Renew ANU was approved without clear understanding of the problem, the options available, or implementation risks
4.17 The approach discussed in the June 2024 meeting, including broad consultation, options consideration and testing (paragraph 4.9) had not been undertaken to inform the development of the $250 million annual, ongoing savings agreed by Council in August 2024. The included evidence (paragraph 4.15) was presented as necessitating an immediate response with a short time horizon. The June 2024 meeting considered a ‘realistic timeframe’ and ‘multi-year’ strategy would be required to achieve ‘functional and structural realignment’ which would involve talking to stakeholders as it was ‘[i]mportant to bring ANU community along on the journey’. ANU Council’s obligations are outlined in Box 2.
|
Box 2: ANU Council obligations |
|
Under the Public Governance, Performance and Accountability Act 2013 (PGPA Act), the ANU Council is responsible for leading, governing and setting the strategic direction for the university. In performing these duties, ANU Council members are required to exercise the degree of care and diligence that a reasonable person would in the circumstances, and act honestly, in good faith, and for proper purpose. The Higher Education Standards Framework (Threshold Standards) 2021 further require they regularly monitor and understand financial position, financial performance, and cash flow information, and obtain and use such information and advice as is necessary for informed and competent decision making and direction setting. The Expert Council on University Governance — Final Report and Principles emphasises the need for ‘genuine inquisitiveness’, while ANAO performance audits of public sector boards have found board members must actively question and challenge management. These requirements are similar to expectations in other sectors articulated in the Australian Institute of Company Directors Not-for-Profit Governance Principles and ASX Corporate Governance Principles and Recommendations. The board of directors of a company or not-for-profit must exercise care and due diligence. The University Chancellors Council (UCC), of which ANU is a member, references the AICD and ASX guidance in its work on university governance. |
4.18 In addition to being at odds with the June 2024 discussion:
- Renew ANU only addressed one of the pressures and conditions faced by ANU between 2020 and 2024, namely overspending, and did not address lack of enrolment growth and poor financial management (for example, there was no structured approach to build on the kinds of improvements summarised in Table 3.2, or gain assurance that the improvements already made were having the intended impact).
- The proposed $200 million savings target was not supported by detailed costings demonstrating how the savings could be achieved, or analysis of the impact of proposed changes on the university’s ability to achieve its purpose. The ANU Council increased the savings target to $250 million in its August 2024 meeting. In November 2025, ANAO was advised by a Council member that the target was in the right order of magnitude and the right direction and was seen as aspirational rather than being based on detailed analysis.
- The January 2026 deadline reflects retaining the existing target to break even by 2026 on an underlying operating result basis, without further consideration of whether this was achievable (paragraph 3.20).
4.19 At Council’s request, more information on how the savings target could be met was provided at the September 2024 meeting. The Vice-Chancellor brought a paper, which was noted, proposing Council:
- note the previous Council endorsement of the need for a $250 million reduction in ‘recurring cost base’;
- note the plan for achieving the first wave of reductions via salary savings to be achieved via change proposals starting in October 2024;
- note the need for continued activity in 2025 to address the required structural change;
- note that the university has convened an Expenditure Task Force to ‘tackle the $150M reduction in non-salary spend’; and
- approve a variation to the academic structure of the university, including the disestablishment of the ANU College of Health and Medicine, and name changes of three colleges.
4.20 Between October 2024 and December 2024, as Renew ANU implementation began, Nous and the internal ANU Expenditure Taskforce provided analysis of areas where staff costs could be reduced and ANU’s operating model could be revised, and Colleges began developing change plans — estimates from this work show $133.4 million potential savings, of which $85.3 million was from staffing expenses, and $48.1 million was from non-salary expenses.79 This suggests that $250 million savings by January 2026 would not be achievable, but no adjustment to the savings target or timeline was considered or made.
The Renew ANU decision-making process should have commissioned and drawn together all relevant information at the decision point, including additional options and perspectives
4.21 The decision-making process regarding Renew ANU should have considered:
- a model or business case explaining the basis for the $250 million target;
- alternative ways to address identified financial problems across the university’s balance sheet (such as using one or more other approaches, such as revenue measures, borrowing, or the use of investment income in combination with savings efforts, to allow for a longer transition timeframe);
- feedback from meaningful consultation with a wide range of staff and students likely to be affected by proposed changes; and
- key risks, including the impact of the savings target on the university’s ability to achieve its purpose, and potential unintended consequences from the implementation timeframe (reaching sustainability by January 2026).
4.22 A thorough consideration of available financial options across the university’s balance sheet would have been aided by the provision of papers to Council that clearly explained factors influencing the university’s financial sustainability, provided information about the university’s financial trajectory, and explained whether reporting and associated financial analysis relied on the management operating result or underlying operating result, and, where used, the methodology used to calculate these (as discussed in paragraph 4.5, reporting did not do this at the time).
Challenges to Renew ANU from within Council were not consistently addressed
4.23 As outlined in the previous section (paragraphs 4.14 to 4.16), Council records are not detailed enough to provide evidence of the depth of discussion of the proposal by Council. ANAO was advised by Council members on 20 January 2026 and 9 February 2026 that in 2024 and 2025, debate was discouraged in Council meetings. A desire for ‘more rigorous discussion and deeper enquiry and probing at both Council and Committee level’ is identified as a key opportunity for ANU Council in the 2022 independent ANU Board Performance Review Report by BoardsGlobal. The report notes:
Providing meaningful challenge to management is an integral component in the work of Councils and boards. It is good practice and is expected by key stakeholders. It tests the facts, stretches management’s thinking on critical areas such as strategy, increases confidence in performance, enhances assurance, and improves outcomes. It will support the achievement of excellence.
4.24 After Renew ANU implementation began, emails to the Chancellor and Vice-Chancellor between December 2024 and July 2025 from multiple Council members indicate disagreement within Council over the decision to support Renew ANU, and a desire from some members to interrogate the evidence base and ensure outcomes were monitored. Issues raised in the emails include the need for:
- risk assessment;
- monitoring of staff morale and goodwill;
- data underpinning the need for the changes;
- an explanation of the basis for the 5 per cent operating margin target;
- wider consultation with university staff and leaders on the impact of the changes;
- a review or check-in to monitor the impact of the changes; and
- a future vision or strategy to inform the desired future state to be achieved by implementing Renew ANU.
4.25 At the July 2025 Council meeting, a motion was raised to pause the Renew ANU Program. This motion did not proceed to a vote, with the ANU Chancellor noting that a vote was not appropriate as the university needed advice from TEQSA about whether the regulator was ‘happy for it to proceed’, not all Council members were present, and the Renew ANU Program was by that time an operational matter outside of the Council’s direct remit.80 The TEQSA advice was not considered at the subsequent Council meeting of August 2025.
4.26 Additionally, in August 2025, concerns were raised with the Chancellor via email by one Council member about the relative balance between Council providing oversight of the university, versus support for management.
4.27 While some concerns raised with the Chancellor and Vice-Chancellor (such as requests for clarification of the basis for the 5 per cent operating margin) were addressed through provision of relevant information, others (such as the request for a review to monitor the impact of the changes) were not. Two Council members resigned (in April and August 2025) after raising their concerns.
4.28 Council remained accountable for overseeing implementation of Renew ANU over this period. While a ‘Program Board’, Chaired by the Chief Operating Officer, had been established in May 2025, its role was limited to ‘high-level oversight and advice to the Vice-Chancellor on formal change proposals and implementation plans associated with the program’. It did not have oversight or decision-making power in relation to the timing, scope or continuation of the program itself, and any decisions by the Board were considered advice to the Vice-Chancellor.
As of February 2026, Renew ANU cost $35.9 million and ANU reported saving $74.8 million in annual salary costs
4.29 At its 3 October 2025 meeting, ANU Council approved:
- the financial target of a break-even underlying operating result for 2026; and
- that the $250 million reduction in the recurring cost base by 1 January 2026 is superseded, and replaced with a break even target.
4.30 As of February 2026, Renew ANU redundancies had cost ANU $34.7 million, and Nous implementation advice cost $1.2 million, against a reported annual salary saving from Renew ANU of $74.8 million.81
4.31 The targeted break even (on an unaudited underlying operating result basis) by 2026 was not achieved, and the proposed 2026 ANU Budget considered by the Audit, Finance and Risk Committee in January 2026 estimated ANU will break even in 2027.
Going into 2026, ANU identified that people risks remain
4.32 Between March 2023 and November 2025, according to ANU staff surveys, ANU staff engagement declined. During this period, staff agreement with ‘I can voice a contrary opinion without fear of negative consequences’ in staff engagement surveys dropped 22 percentage points, from 60 per cent to 38 per cent. In September 2024, Comcare also undertook monitoring and compliance activity in relation to Work, Health and Safety (WHS) concerns raised by workers in the College of Arts and Social Sciences.
4.33 Decentralised Human Resources (HR) and WHS functions had been centralised into the People & Culture (P&C) team between January and August 2024, prior to Renew ANU. This enabled the introduction of entity-wide HR controls, such as Chief People Officer oversight of hiring (Table 3.2).
4.34 Savings targets in the 2026 budget led P&C to advise the Chief Operating Officer and Chief Financial Officer that ANU may be unable to:
- address Nixon Report recommendations82, and other strategic priorities, such as the leadership development framework;
- maintain commitments to staff wellbeing through its Employee Assistance Program (EAP), WHS advisors, WHS training, injury prevention services or system maintenance; and
- support enterprise bargaining and associated legal compliance required as ANU’s Enterprise Agreement 2023–2026 is due to expire on 30 June 2026.83
Going into 2026, ANU identified that revenue risks remain
4.35 ANU identified three key revenue risks going into 2026, all of which are associated with student fee income, which made up 29.2 per cent of ANU’s income — 10.7 per cent from domestic students and 18.5 per cent from international students in 2024 (latest available comparative data, see Figure 2.7).
Market concentration risk in international education will need to be actively managed
4.36 Australia was one of the top three destinations for international students before the pandemic (along with the USA and UK). In 2024 (latest available comparative data), Australian universities compete with a larger number of destination countries to attract international students.84
4.37 The Australian Government prioritises addressing market concentration in the Australian Strategy for International Education 2021–2030.85 As of October 2025, 31.2 per cent of all international higher education students studying in Australia were from China, while 66.9 per cent of international students studying at ANU in 2025 were from China (Figure 4.3). In 2024, ANU was second only to the University of Sydney in terms of market concentration. ANU considers this level of market concentration leaves it vulnerable to market volatility and Australian Government policy changes. This means it is more likely to experience significant downturns in international student fees (which make up 18.5 per cent of its income in 2024) than universities with more diverse student cohorts.
Figure 4.3: Nationality of international students studying in Australia, by top ten source countriesa, 2025b
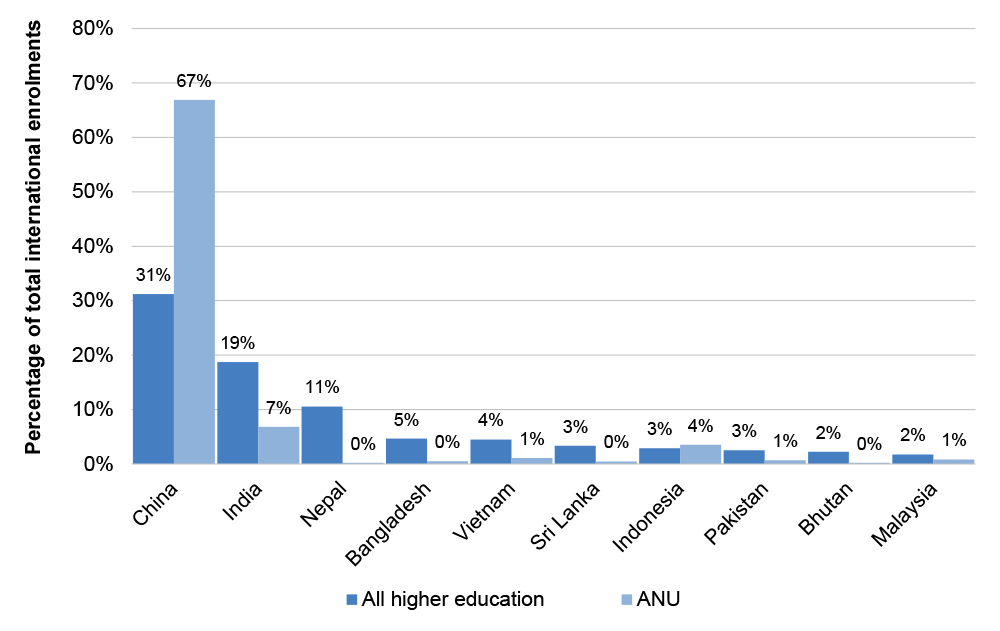
Note a: Top ten source countries are for the sector as a whole, ANU’s top ten are: China, India, Indonesia, Japan, United Kingdom, Republic of Korea, Vietnam, Hong Kong (SAR of China), United States of America, and Germany.
Note b: Sector-wide data is year to date as of October 2025 (the latest available at the time of drafting). ANU data is full year 2025.
Source: ANAO based on Department of Education data.
An increased proportion of international enrolments by postgraduate students increases pressure on ANU to improve student recruitment
4.38 Since 2020, an increasing proportion of international enrolments at ANU have been postgraduate students (Figure 4.4). Postgraduate courses are typically up to two years, compared with undergraduate students with study patterns of up to five years — this means increasing new enrolments will not have a positive revenue impact over the same period as was previously the case. As a consequence, ANU will need a stronger recruitment model, to support more frequent student turnover.
4.39 As of January 2025, international postgraduate enrolments were down 25 per cent compared to previous years, while international undergraduate enrolments are up 10 per cent. This was highlighted as a financial risk in the proposed 2026 ANU Budget taken to the Audit, Finance and Risk Committee, but the baseline revenue estimate:
does not reflect the recent softness in commencing international postgraduate enrolments in Semester 1 2026. Instead, it assumes a recovery from Semester 2 2026, supported by the proposed Differential Pricing Model and associated enrolment initiatives.
4.40 ANU will need to carefully manage risks associated with projecting increases in international student numbers given projected increases have historically taken longer than anticipated.
Figure 4.4: ANU international student enrolments (EFTSL) by course type, 2016 to 2025
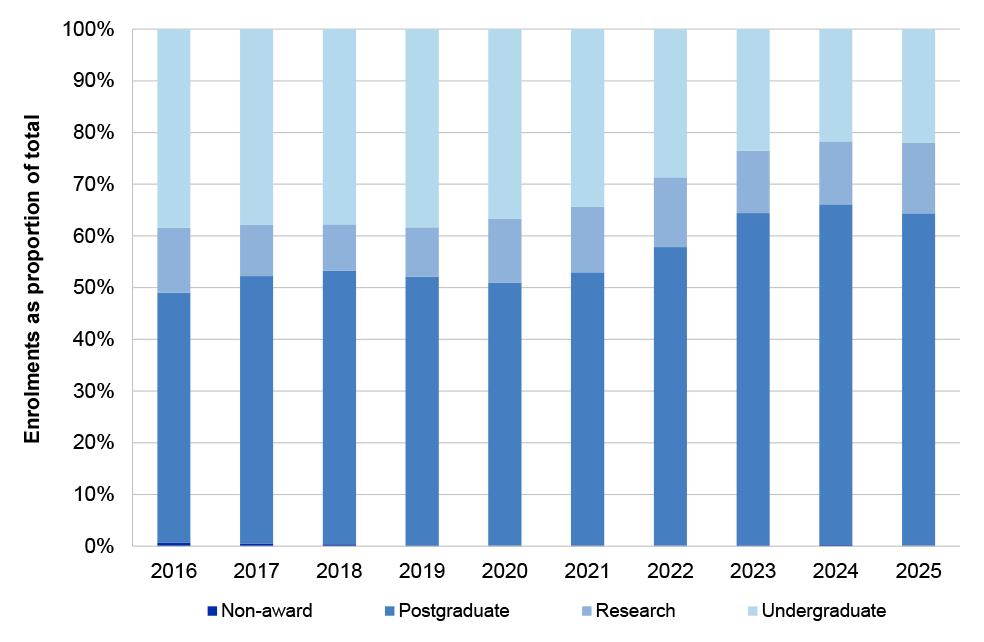
Source: ANAO based on ANU data.
Over-enrolment of domestic undergraduate students will end in 2027, putting approximately $9.4 million annual income at risk
4.41 ANU enrols more students eligible for an Australian Government fee subsidy via the Commonwealth Grant Scheme than the Australian Government will support — known as ‘over-enrolment’. This does not have any impact on the student’s fee, but it means the ANU receives only the ‘student contribution’ (paragraphs 2.5 to 2.7). Over-enrolment is currently allowable under the Australian Government funding legislation, HESA, but is expected to end from 2027 (see paragraph 2.7). As of 2024, the end of over-enrolment would represent a $9.4 million annual loss to ANU’s domestic student fee income, which in total makes up 10.7 per cent of ANU’s total income.
ANU is co-designing its next strategic plan and undertaking rapid stocktakes to inform next steps
4.42 As of February 2026, a co-design process is planned to inform the development of the next University Strategy and Academic Plan, and ‘rapid stocktakes’ are underway to inform decisions about university finances, culture and wellbeing, productivity and performance, and governance and reputation. The Roadmap informing this work emphasises three phases of action:
- foundation phase: stability — this phase includes completion of retained elements of Renew ANU, the rapid stocktakes, and more workplace support;
- growth phase: rebuilding trust — this phase includes a new Charter for Change endorsed by Council, to guide future change programs, a new budget model, open lines of communication, a quarterly staff survey, and a focus on staff learning and development; and
- future phase: a transparent plan that unites us — this phase includes a community-led codesign of the next university strategy, a revenue and reputation strategy, an expenditure control strategy, a focus on academic excellence, sustainable workforce planning, and redevelopment of the overseas student attraction strategy.
4.43 If effectively implemented, these measures could address many of the financial management and university governance limitations identified in this report.
Appendices
Appendix 1 Australian National University response
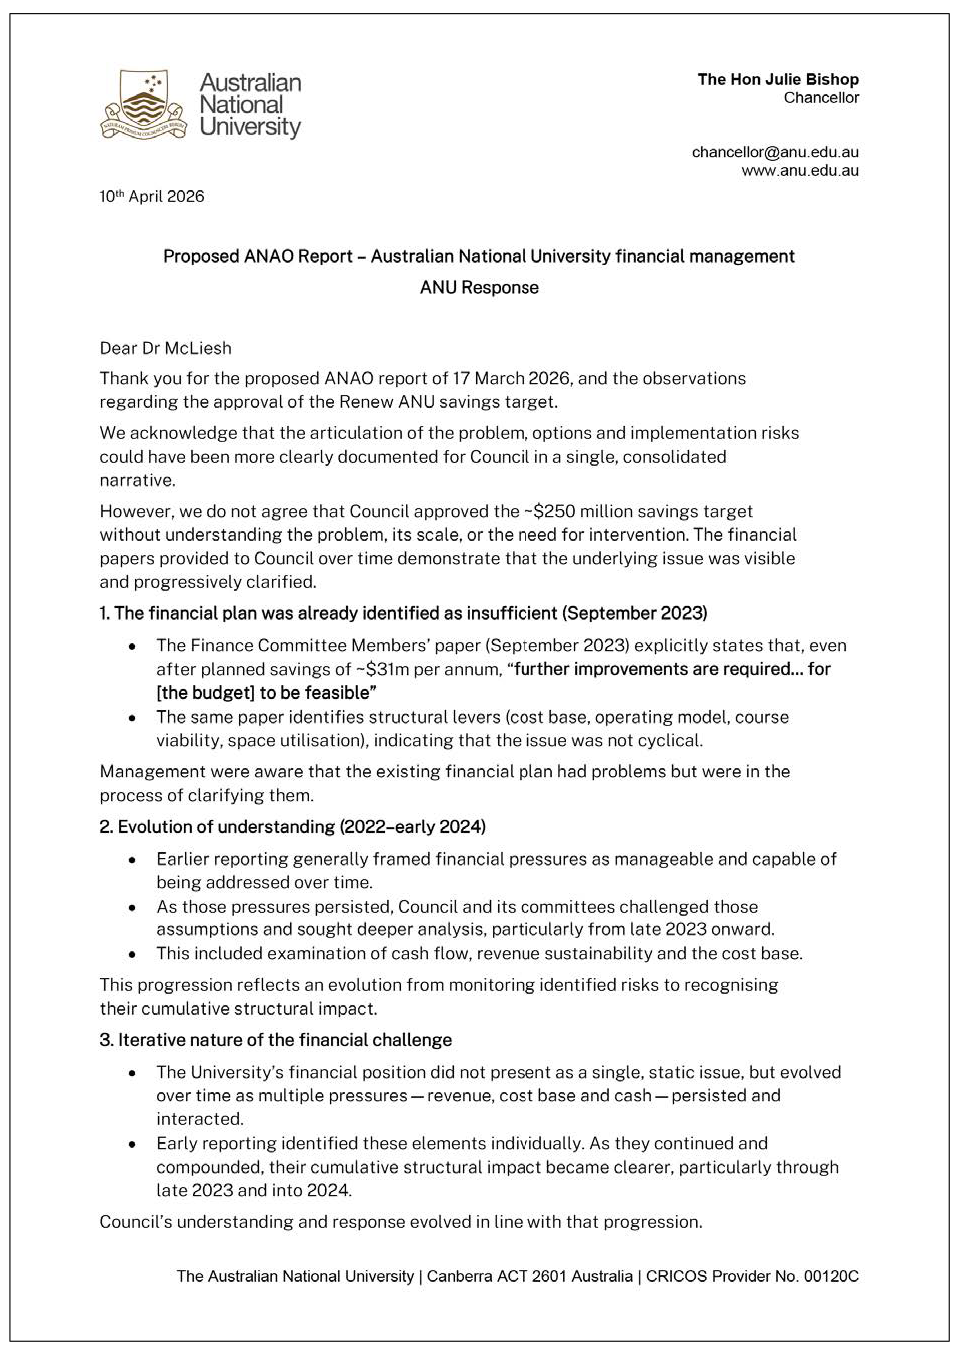
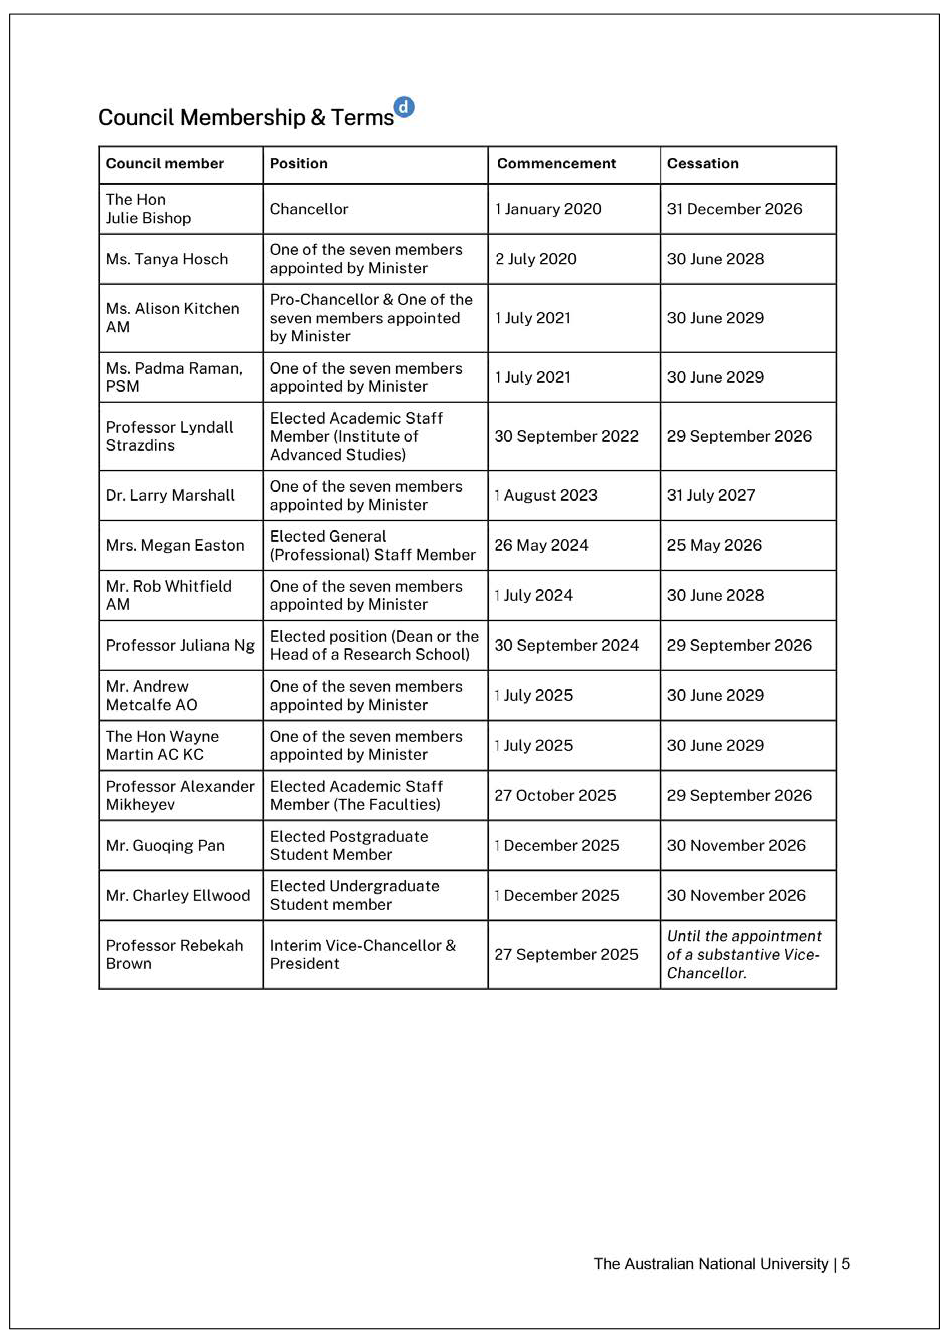
ANAO comment on Australian National University response
In addition to the ANAO comment on ANU’s summary response (paragraphs 18 and 19):
- The ANAO analysis (paragraph 2.24) shows that key revenue (as defined by ANU) is not sufficient to cover expenses without supplementation from other sources. This analysis cannot be used to conclude that revenue in general is not sufficient to cover expenses.
- The ANAO analysis (paragraph 2.32) supports a view that there has been a gradual deterioration of ANU’s financial position, but not that urgent action of the scale approved was needed.
- The ANAO analysis (paragraphs 3.29, 4.5 and 4.22) shows that at the time ANU Council approved Renew ANU, reporting to Council did not explain whether reporting and associated financial analysis relied on the management operating result or underlying operating result. By clearly identifying when these measures are used, each Council member can be confident that what is being provided to support their decision-making is clear and well understood.
- The composition of the ANU Council changed following this response to the ANAO report. The Hon Julie Bishop, ANU Chancellor from 1 January 2020, resigned on 7 May 2026. Ms Tanya Hosch, The Hon Wayne Martin AC KC, Mr Rob Whitfield AM, and Ms Padma Raman PSM resigned in the following week.
Appendix 2 Operations of ANU Council and university executive
Role and constitution of the ANU Council
1. The Accountable Authority of the ANU is the Council.86 Under the Australian National University Act 1991 (ANU Act), Council has control and management of the university, including appointment of leadership roles and the making of statutes setting out university governance arrangements, which are legislative instruments under the ANU Act.87
2. Council is Chaired by the Chancellor, and composed of up to 14 other members, including the Vice-Chancellor, six members representative of academic staff and students, and seven members appointed by the Education Minister on the recommendation of the Nominations Committee of Council.88
3. At least two members appointed by the Minister must have a high level of relevant financial expertise.89 As of October 2025, four Council members satisfied this criteria — three of these members were on Council and attended the August 2024 meeting that endorsed the $250 million savings target.
4. Under the Charter of the ANU Council it:
has oversight of the University and is responsible for its mission and strategic direction, ensuring effective overall governance and management, and responsible finance and risk management.90
Operations of the ANU Council
5. At a meeting of the Council, a quorum is constituted by a majority of the members holding office at that time.91
6. Council decisions are made by resolution decided by a majority of Council members present and voting.92 The Chair and members each have a single vote.93 A motion is carried if voted for by a majority of the members present or, if the agreement of a specified number of members is required by statute, by the number of members prescribed — the Chair has a deliberative, but not casting vote. In the event there is an equal number of votes for and against, the motion is lost.94
7. The number of votes for and against is not recorded in Council minutes from 2020 to 2025.
8. The mover of a motion may not speak for more than five minutes, and members must not speak for more than three minutes, without the leave of the Council.95
Role of the ANU Chancellor
9. The Chancellor is appointed, and may be terminated, by the Council.96
10. The Chancellor is not an executive officer within the university.97 Their principal responsibilities are to provide appropriate leadership to the Council and to ensure the Council fulfils its obligations under the Charter.98 The Chancellor is also expected to:
- chair Council meetings, and other governance-level meetings; and to facilitate discussion within each meeting;
- represent the views of the Council to the University community, government, business, civil society and the public;
- maintain a regular dialogue with the Vice-Chancellor and University Executive, serving as a primary link between the Council and Executive, and providing continuity between Council meetings;
- work with the Vice-Chancellor in relation to the Council’s requirements for information to contribute effectively to the Council decision-making process and to monitor the effective implementation of Council decisions; and
- preside over ceremonial occasions of the University, including the Conferring of Awards ceremonies. 99
Role of the ANU Vice-Chancellor
11. The Vice-Chancellor is appointed, and may be terminated, by the Council.100
12. The academic standards, management and administration of the University are the responsibility of the Vice-Chancellor.101 The Vice-Chancellor is accountable to the Council for the discharge of these responsibilities.102 Council expects that the Vice-Chancellor, in leading and making decisions, and shaping university culture, exemplify, promote, and ensure that:
- members of the University community (i.e. staff, students and others holding an academic title within the University) conduct themselves in a manner that reflects commonly accepted standards of academic or business practice and ethics, including acting with honesty and integrity, with respect and dignity in relationships amongst those involved in, or affected by, the University’s activities;
- resource allocation decisions, capital and operating expenditure, or financing decisions, are made with due reference to their impact on the financial condition of the University, and the associated impact on the achievement of the strategic plan;
- decisions or actions are taken with due reference to their impact on the health, safety and environmental outcomes, and the associated impact on the achievement of the Strategic Plan;
- decisions or actions are taken with due reference to their effect on the reputation of the University and the associated impact on the achievement of the Strategic Plan;
- risks that are material to the University’s functions are identified and managed within an appropriate system/s of control; and
- the Executive of the University is organised with processes for ensuring long term succession planning, attracting and retaining talent, building a capable and agile management team and ensuring equal opportunity.103
Appendix 3 Underlying operating result
Table A.1: Adjustments to ANU net operating result to arrive at underlying operating result, 2016 to 2024 ($’000)
|
Category |
Item |
2016 |
2017 |
2018 |
2019 |
2020 |
2021 |
2022 |
2023 |
2024 |
|
Philanthropy |
Philanthropic Funds |
-6,977 |
-11,176 |
-25,273 |
-13,000 |
-15,321 |
-19,347 |
-17,320 |
-9,163 |
-16,579 |
|
Investment |
Income |
-116,104 |
-104,901 |
-75,129 |
-233,773 |
-61,452 |
-150,802 |
43,910 |
-175,003 |
-215,010 |
|
Expense |
45,264 |
47,252 |
45,251 |
44,353 |
38,199 |
28,611 |
39,685 |
48,102 |
44,532 |
|
|
Specific purpose funds |
Movement in specific purpose funds |
7,281 |
4,656 |
6,799 |
-6,870 |
-12,548 |
-3,582 |
-5,022 |
-3,034 |
-3,231 |
|
One offs |
Capital grants |
– |
-12,000 |
-69,200 |
-49,911 |
-19,289 |
– |
– |
– |
– |
|
Net additional RSP funding |
– |
– |
– |
– |
– |
-49,700 |
– |
– |
– |
|
|
Insurance income |
-5,885 |
-2,400 |
-3,085 |
-10,000 |
-91,015 |
-50,000 |
-37,250 |
-112,750 |
-50,000 |
|
|
Covid support |
– |
– |
– |
– |
27,546 |
– |
– |
– |
– |
|
|
Hail damage expense |
– |
– |
– |
– |
12,318 |
1,386 |
816 |
618 |
2,010 |
|
|
NRAS revenue |
-7,754 |
-9,211 |
-7,785 |
-7,942 |
-7,985 |
-4,611 |
-2,874 |
– |
– |
|
|
Staff separation expense |
– |
17,029 |
– |
– |
66,544 |
17,613 |
347 |
-568 |
6,257 |
|
|
Net impact of PBSA |
53,778 |
-7,722 |
– |
9,565 |
– |
– |
– |
– |
– |
|
|
Revaluation decrements |
– |
– |
7,082 |
– |
– |
– |
– |
– |
– |
|
|
Adjustments attributable to one-offs |
40,139 |
-14,304 |
-72,988 |
-58,288 |
-11,881 |
-85,312 |
-38,961 |
-112,700 |
-41,733 |
|
|
Total adjustments |
-30,397 |
-78,473 |
-121,340 |
-267,578 |
-63,003 |
-230,432 |
22,292 |
-251,799 |
-232,021 |
|
|
Net operating result |
67,030 |
168,717 |
226,961 |
316,502 |
-17,699 |
232,429 |
-139,565 |
146,595 |
87,117 |
|
|
Underlying operating result |
36,633 |
90,244 |
105,621 |
48,924 |
-80,702 |
1,997 |
-117,273 |
-105,204 |
-144,904 |
|
Source: ANAO analysis of ANU data.
Appendix 4 University performance against key financial indicators, 2024
|
University |
Salaries and on-costs as % total revenue |
Salaries and on-costs as % AG grants and student fees |
Repayments of borrowings from cash flows as % total revenue |
Payments for property, plant and equipment from cash flows as % of total revenue |
Current ratio (assets / liabilities)a |
|
Charles Sturt University |
65.26 |
73.79 |
0.06 |
13.6 |
0.48 |
|
Macquarie University |
57.40 |
65.51 |
22.57 |
17.54 |
0.53 |
|
The University of Newcastle |
52.34 |
63.34 |
0.00 |
11.59 |
0.62 |
|
Southern Cross University |
52.86 |
62.19 |
2.61 |
3.64 |
0.46 |
|
The University of New England |
60.85 |
69.03 |
2.21 |
5.70 |
0.87 |
|
The University of New South Wales |
49.44 |
57.04 |
0.07 |
5.29 |
1.07 |
|
The University of Sydney |
50.09 |
66.43 |
0.00 |
7.04 |
1.11 |
|
University of Technology, Sydney |
58.17 |
64.92 |
0.00 |
5.15 |
0.91 |
|
Western Sydney University |
49.67 |
61.25 |
4.61 |
23.06 |
0.62 |
|
University of Wollongong |
60.73 |
71.62 |
19.57 |
8.06 |
0.99 |
|
Federation University Australia |
65.11 |
84.09 |
0.00 |
3.11 |
1.00 |
|
Deakin University |
60.45 |
75.07 |
0.00 |
3.29 |
0.55 |
|
La Trobe University |
56.21 |
67.34 |
0.00 |
13.48 |
0.58 |
|
The University of Melbourne |
52.42 |
73.28 |
3.00 |
6.48 |
0.29 |
|
Monash University |
46.27 |
58.25 |
0.04 |
5.27 |
0.83 |
|
RMIT University |
60.92 |
72.54 |
13.45 |
5.86 |
0.39 |
|
Swinburne University of Technology |
44.04 |
53.76 |
0.00 |
8.32 |
0.46 |
|
Victoria University |
47.56 |
61.52 |
0.00 |
8.10 |
0.88 |
|
Central Queensland University |
53.44 |
64.12 |
0.00 |
5.50 |
1.43 |
|
Griffith University |
57.47 |
68.97 |
1.20 |
15.88 |
2.85 |
|
James Cook University |
48.84 |
55.11 |
1.40 |
10.04 |
0.98 |
|
Queensland University of Technology |
51.81 |
64.24 |
0.51 |
5.03 |
0.64 |
|
University of the Sunshine Coast |
56.62 |
67.14 |
2.51 |
4.49 |
2.24 |
|
The University of Queensland |
49.73 |
68.38 |
0.52 |
3.53 |
0.92 |
|
University of Southern Queensland |
73.61 |
80.79 |
0.16 |
4.12 |
1.33 |
|
Curtin University of Technology |
53.37 |
65.40 |
0.24 |
7.71 |
0.99 |
|
Edith Cowan University |
39.47 |
47.94 |
0.23 |
45.59 |
2.80 |
|
Murdoch University |
48.92 |
61.64 |
1.03 |
3.93 |
1.32 |
|
The University of Notre Dame Australia |
60.79 |
64.25 |
0.76 |
28.68 |
0.81 |
|
The University of Western Australia |
46.24 |
66.76 |
0.17 |
6.93 |
0.93 |
|
University of Adelaide (Adelaide University as of 2026) |
51.18 |
62.67 |
0.07 |
8.96 |
1.66 |
|
Flinders University |
58.58 |
67.05 |
0.00 |
14.06 |
1.69 |
|
University of South Australia (Adelaide University as of 2026) |
59.12 |
71.35 |
0.00 |
3.84 |
2.14 |
|
University of Tasmania |
57.34 |
71.38 |
0.00 |
0.00 |
1.60 |
|
Batchelor Institute of Indigenous Tertiary Education |
60.96 |
121.19 |
0.00 |
4.88 |
1.92 |
|
Charles Darwin University |
52.53 |
63.41 |
0.00 |
18.89 |
1.25 |
|
Australian National University |
52.36 |
73.87 |
0.00 |
11.95 |
2.99 |
|
University of Canberra |
64.77 |
72.20 |
1.98 |
4.17 |
0.41 |
|
Australian Catholic University |
61.25 |
66.54 |
0.76 |
1.91 |
1.10 |
|
Avondale University |
68.43 |
106.51 |
0.00 |
1.64 |
1.16 |
|
Bond University |
63.78 |
70.56 |
0.36 |
4.97 |
2.25 |
|
University of Divinity |
25.35 |
33.84 |
0.00 |
0.03 |
0.61 |
|
Torrens University |
43.14 |
43.32 |
0.00 |
0.00 |
1.74 |
|
ANU rank |
Spends less than average (17th out of 43 universities) |
Spends more than average (38th out of 43 universities) |
Equal lowest, with 18 other universities |
Spends more than average (10th out of 43 universities) |
Highest current ratio of all 43 universitiesa |
|
Average of all universities |
54.63 |
67.43 |
1.86 |
8.64 |
1.17 |
Note a: In 2025, ANU reclassified a portion of its investment assets from current to non-current. This reclassification rectified an error in the application of the requirements of the Australian Accounting Standards in prior years to accurately reflect the ANU’s investment policy that its investment pool is not held for trading and is managed on a long term basis. The reclassification does not change the fact that the majority of the assets are such that they could be readily realised to meet financial obligations, if required. The 2024 current ratio for ANU after the reclassification is 1.42.
Source: ANAO based on Department of Education data and Universities Australia financial indicators.
Footnotes
1 The staffing expenditure saving target was not expressed in terms of number of staff.
2 Section 39 of the Auditor-General Act 1997 sets out that the Australian National Audit Office (ANAO) was established to assist the Auditor-General in performing the Auditor-General’s functions.
3 Auditor-General Report No. 11 2021–22, Australian National University’s Governance and Control Framework, ANAO, Canberra, 2021, available from https://www.anao.gov.au/work/performance-audit/australian-national-university-governance-and-control-framework [accessed 23 February 2026].
4 Auditor-General Report No. 30 1996–97, Australian National University Administration, ANAO, Canberra, 1997, available from https://catalogue.nla.gov.au/catalog/1472475 [accessed 23 February 2026].
5 The Organisation for Economic Co-operation and Development, The Financial Sustainability of Higher Education: Insights from Policy in OECD Countries, Higher Education, OECD Publishing, Paris, 2025, available from https://doi.org/10.1787/f544ccfe-en [accessed 30 January 2026].
6 Expert Council on University Governance, Expert Council on University Governance — Final Report and Principles, Department of Education, 18 October 2025, available from https://www.education.gov.au/australian-universities-accord/resources/expert-council-university-governance-final-report-and-principles [accessed 27 January 2026].
7 Education and Employment Legislation Committee, Australian Senate, Quality of governance at Australian higher education providers — final report, 2025, available from https://www.aph.gov.au/Parliamentary_Business/Committees/Senate/Education_and_Employment/UniversityGovernance48/Final_report [accessed 27 January 2026].
8 As of February 2026, work specific to the Australian National University (ANU) included the ANU Governance Project Working Group, ANU Governance Project Final Report, ANU, 20 November 2025, available from https://dspace-prod.anu.edu.au/entities/publication/7bcee5bf-6162-45ba-a7ba-67d659ed8359 [accessed 27 January 2026]; 2026 Report of the ANU Special Governance Committee, headed by Dr Vivienne Thom, ANU, Special Governance Committee, ANU, October 2025, available from https://www.anu.edu.au/about/governance/committees/special-governance-committee [accessed 27 January 2026]; and compliance assessment by the Tertiary Education Quality and Standards Agency (TEQSA), TEQSA, ANU, n.d, available from https://www.anu.edu.au/about/parliamentary-engagement-0/teqsa [accessed 29 March 2026].
9 For example: ACT Audit Office, University of Canberra financial governance arrangements, ACT Audit Office, Canberra, 27 March 2027, available from https://www.audit.act.gov.au/reports-and-publications/audit-reports/2026/2026-03-university-of-canberra-financial-governance-arrangements/university-of-canberra-financial-governance-arrangements [accessed 29 March 2026].
New South Wales Auditor-General’s Report to Parliament, Universities 2024, Audit Office of New South Wales, Sydney, 5 June 2025, p. 14, available from https://www.audit.nsw.gov.au/sites/default/files/documents/Final%20report%20-%20Universities% 202024.pdf [accessed 27 January 2026].
10 Higher Education Standards Framework (Threshold Standards) 2021, Standard 6.2.1 and 6.2.1c.
11 Department of Finance, PGPA legislation, associated instruments and policies, Finance, Canberra, 2 March 2026 available from https://www.finance.gov.au/government/managing-commonwealth-resources/pgpa-legislation-associated-instruments-and-policies [accessed 13 March 2026].
12 Auditor-General Report No. 17 2025–26, Audits of the Financial Statements of Australian Government Entities for the Period Ended 30 June 2025, ANAO, Canberra, 2025, p. 48, available from https://www.anao.gov.au/work/financial-statement-audit/audits-of-the-financial-statements-of-australian-government-entities-the-period-ended-30-june-2025 [accessed 27 January 2026].
13 New South Wales Auditor-General’s Report to Parliament, Universities 2024, p. 14.
14 Auditor-General Report No. 17 2025–26, Audits of the Financial Statements of Australian Government Entities for the Period Ended 30 June 2025, p. 48.
15 ibid.
16 Public Governance, Performance and Accountability Act 2013 (PGPA Act), section 25.
17 Finance, General Duties Of Officials (RMG 203): Duty of care and diligence, Finance, Canberra, 6 March 2023 available from https://www.finance.gov.au/government/managing-commonwealth-resources/general-duties-officials-rmg-203/duty-care-and-diligence [accessed 21 April 2026].
18 Australian National University Act 1991 (ANU Act), section 5.
19 Explanatory Memorandum, Australian National University Bill 1991, p. 3.
20 Australian National University, Campuses & facilities, ANU, Canberra, n.d., available from https://www.anu.edu.au/about/campuses-facilities [accessed 3 October 2025].
21 Education and Employment Legislation Committee, Quality of governance at Australian higher education providers — final report, Australian Senate, 2025, Chapter 2, paragraphs 2.8 to 2.22.
22 ANU Act, subsection 9(1).
23 ‘Proper’ means efficient, effective, economical and ethical.
ANU Act, section 8;
Public Governance, Performance and Accountability Act 2013, sections 8 and 12, and paragraphs 15(1)(a) and (b); and
Department of Finance, Duties of Accountable Authorities (RMG 200), Finance, Canberra, May 2025, available from https://www.finance.gov.au/government/managing-commonwealth-resources/duties-accountable-authorities-rmg-200 [accessed 11 March 2026].
24 PGPA Act, section 16.
25 PGPA Act, section 11.
26 Public Service Act 1999, sections 58 and 59; ANU Act, subsection 9(2) and section 15.
27 ANU Act, section 15. Section 30 of the PGPA Act provides that a member of a Corporate Commonwealth entity Accountable Authority may be terminated by the minister who appointed them for contravening the general duties of officials. This provision is regarded as a supplemental power, to be used only when the entity’s enabling legislation is inadequate, whereas the ANU Act explicitly provides Council itself with the power to remove members for breach of their general duties under the PGPA Act.
Department of Finance, Duties Of Accountable Authorities (Rmg 200): Other legal requirements, Finance, Canberra, 1 May 2024, available from https://www.finance.gov.au/government/managing-commonwealth-resources/duties-accountable-authorities-rmg-200 [accessed 22 April 2026].
28 ANU Act, sections 32 and 34; Australian National University (Governance) Statute 2024 sections 41, 42, 43, 53, 59 and 60. On 24 April 2026, the higher education regulator, the Tertiary Education Quality and Standards Agency (TEQSA), accepted a voluntary undertaking from the ANU setting out a process for recruiting the next Chancellor. A majority independent selection panel will manage the recruitment and selection process and recommend the strongest candidate to the Council, which retains legal responsibility for appointing the Chancellor.
Tertiary Education Quality and Standards Agency, Voluntary undertaking accepted 27 April 2026 [sic], TESQA, Melbourne, n.d., available from https://www.teqsa.gov.au/national-register/condition-decision/voluntary-undertaking-accepted-27-april-2026 [accessed 11 May 2026].
29 The other members are the Vice-Chancellor, and six members representative of academic staff and students. In addition to the 14 members, Council is chaired by the ANU Chancellor.
30 Section 44 of the ANU Act.
31 Section 32 of the Tertiary Education Quality and Standards Agency Act 2011 (TEQSA Act).
TEQSA must notify the higher education provider of any decision to impose additional conditions in writing and the provider may apply for review of such a decision, or for the condition to be varied or revoked.
TEQSA Act, section 183 and subsections 32(3) and 32(4); Education and Employment Legislation Committee, Estimates, Parliament of Australia, 12 February 2026, p. 111, available from https://parlinfo.aph.gov.au/parlInfo/search/display/display.w3p;query=Id%3A%22committees%2Fcommsen%2F29371%2F0000%22 [accessed 29 March 2026];
Education and Employment Legislation Committee, Estimates, Parliament of Australia, Canberra, 4 December 2025, pp. 90–91, available from https://parlinfo.aph.gov.au/parlInfo/search/display/display.w3p;query=Id%3A%22 committees%2Festimate%2F29017%2F0000%22 [accessed 14 Apil 2026].
32 PGPA Act, sections 25 and 26. This requirement is in similar terms to the requirements for company directors in section 180 of the Corporations Act 2001.
33 Australian Government, Higher Education Standards Framework (Threshold Standards) 2021, Commonwealth of Australia, Canberra, 2021, Standard 6, especially 6.1.3a and 6.2.1d, available from https://www.legislation.gov.au/F2021L00488/latest/text [accessed on 10 March 2026].
34 Expert Council on University Governance, Expert Council on University Governance — Final Report and Principles, Department of Education, 18 October 2025, p. 27, available from https://www.education.gov.au/australian-universities-accord/resources/expert-council-university-governance-final-report-and-principles [accessed 27 January 2026]; and
Australian National Audit Office, Board Governance, ANAO, Canberra, 17 May 2019, available from https://www.anao.gov.au/work/insights/board-governance [accessed 11 March 2026].
35 Australian Institute of Company Directors, Not-for-Profit Governance Principles, AICD, Sydney, April 2024, available from https://www.aicd.com.au/content/dam/aicd/pdf/tools-resources/nfp-governance-principles/aicd-nfp-governance-principles-2024.pdf [accessed 13 March 2026]; and
ASX Corporate Governance Council, Corporate Governance Principles and Recommendations, ASX Corporate Governance Council, Sydney February 2019, available from https://www.asx.com.au/content/dam/asx/about/corporate-governance-council/cgc-principles-and-recommendations-fourth-edn.pdf [accessed 13 March 2026].
The University Chancellors Council, of which ANU is a member, references the AICD and ASX guidance in its work on university governance.
The University Chancellors Council, Governance of Australian Universities, 2025, UCC, Melbourne, available from https://ucc.edu.au/university-governance [accessed 21 April 2026]; and
The University Chancellors Council, Code of Governance Principles and Practice for Australia’s Public Universities, UCC, Melbourne, December 2024, available from https://ucc.edu.au/codes [accessed 21 April 2026].
36 Tertiary Education Quality and Standards Agency, National Register, TEQSA, Melbourne, n.d., available from https://www.teqsa.gov.au/national-register [accessed 21 April 2026];
Department of Education, Key findings from the 2024 Higher Education Student Statistics, Education, Canberra, September 2025, available from https://www.education.gov.au/higher-education-statistics/student-data/selected-higher-education-statistics-2024-student-data/key-findings-2024-higher-education-student-statistics [accessed 20 November 2025];
Tertiary Education Quality and Standards Agency, Annual Report 2019–20, TEQSA, Melbourne, August 2020, p. 43, available from https://www.teqsa.gov.au/about-us/reporting-and-accountability/annual-report [accessed 30 January 2026].
37 Higher Education Standards Framework (Threshold Standards) 2021, Part B1.3.5–6 and B1.3.16–19.
38 Under the Tertiary Education Quality and Standards Agency Act 2011 and Education Services for Overseas Students Act 2000, and Higher Education Support Act 2003, respectively.
39 Income also includes state and territory government funding, investment income, and income from contract research and consultancies. Universities Australia, How universities are funded, Universities Australia, n.d., available from https://universitiesaustralia.edu.au/policy-submissions/teaching-learning-funding/how-universities-are-funded/ [accessed 26 October 2025].
40 Department of Education, Commonwealth Grant Scheme (CGS), Education, Canberra, n.d., available from https://www.education.gov.au/higher-education-funding/commonwealth-grant-scheme-cgs [accessed 20 November 2025].
41 Department of Education, Portfolio Budget Statements 2024–25, Budget Related Paper No. 1.5, Education Portfolio, Commonwealth of Australia, May 2025, p. 52, available from https://www.education.gov.au /download/19070/2025-26-education-portfolio-budget-statements/40877/document/pdf [accessed 19 January 2025].
42 Study Assist, Commonwealth supported places (CSPs), Department of Education, Canberra, n.d., available from https://www.studyassist.gov.au/financial-and-study-support/commonwealth-supported-places-csps [accessed 27 January 2026].
43 As of 2025, student contribution and Commonwealth contribution amounts vary from a $16,992 student contribution and a $1,286 Commonwealth contribution for many humanities, arts and social sciences units, to a $4,627 student contribution and a $31,641 Commonwealth contribution for certain agriculture and pathology units. Universities receive only the student contribution for enrolments over the maximum CGS funding level.
Department of Education, 2025 Allocation of units of study to funding clusters, Education, 11 July 2024, available from https://www.education.gov.au/higher-education-loan-program/resources/2025-allocation-units-study-funding-clusters [accessed 20 November 2025].
44 Productivity Commission, The Demand Driven University System: A mixed report card, Productivity Commission, Canberra, 17 June 2019, available from https://www.pc.gov.au/inquiries-and-research/university-report-card/ [accessed 27 January 2026].
45 Department of Education, Higher education providers’ 2024-2025 Commonwealth Grant Scheme funding agreements, Education, Canberra, n.d., available from https://www.education.gov.au/collections/higher-education-providers-2024-2025-commonwealth-grant-scheme-funding-agreements [accessed 20 November 2025].
46 Education and Employment Legislation Committee, Higher Education Support Amendment (Job-Ready Graduates and Supporting Regional and Remote Students) Bill 2020, Australian Senate, September 2020, p. 46, available from https://www.aph.gov.au/Parliamentary_Business/Committees/Senate/Education_and_ Employment/JobReadyGraduates/Report [accessed 27 January 2026].
47 Department of Education, Managed Growth Funding, Education, Canberra, n.d., available from https://www.education.gov.au/australian-universities-accord/accord-202425-budget-and-myefo-measures/managed-growth-funding [accessed 1 December 2025].
48 Department of Education, Higher education funding supports better learning and teaching, Education, Canberra, n.d., available from https://www.education.gov.au/higher-education-funding [accessed 13 January 2026].
49 Department of Education, Research Block Grants, Education, Canberra, n.d., available from https://www.education.gov.au/research-block-grants [accessed 20 November 2025].
50 Department of Education, Portfolio Budget Statements 2024–25, Budget Related Paper No. 1.5, Education Portfolio, Commonwealth of Australia, Canberra, May 2025, p. 60, available from https://www.education.gov.au/download/19070/2025-26-education-portfolio-budget-statements/40877/document/pdf [accessed 19 January 2025].
51 Department of Education, Research Block Grants.
52 Department of Education, 2020-21 Budget, Education, Canberra, 2020, available from https://www.education.gov.au/about-department/corporate-reporting/budget/budget-2020-21#section-higher-education-research-and-international [accessed 20 November 2025].
53 Department of Education, Support programs for the research sector, Education, Canberra, n.d., available from https://www.education.gov.au/support-programs-research-sector#toc-funding-for-australia-s-research-sector [accessed 13 January 2025].
54 Restrictions were initially introduced in December 2023 via Ministerial Direction 107, then revised in December 2024 by Ministerial Direction 111. The restrictions were a ‘soft cap’ in that Ministerial Direction 107 directed immigration processing to prioritise student visas for low-risk providers (generally older universities), and Ministerial Direction 111 directed immigration processing to prioritise those universities and other higher education providers that remained under a specified enrolment level (different enrolment levels applied to each provider).
Minister for Home Affairs and Minister for Cyber Security, Direction No. 107 - Order for considering and disposing of Student Guardian visa applications and offshore Subclass 500 (Student) visa applications, 14 December 2023, available from http://www.immi-to-australia.com/pdf/20240103/Ministerial-Direction-107.pdf [accessed 27 January 2026];
Assistant Minister for Citizenship and Multicultural Affairs, Direction No. 111 — Order for considering and disposing of offshore Subclass 500 (Student) visa applications, 18 December 2024, available from https://immi.homeaffairs.gov.au/support-subsite/files/ministerial-direction-111.pdf [accessed 27 January 2026].
55 Registered not-for-profits in Australia are: small charities, with annual revenue under $500,000; medium charities, with annual revenue of $500,000 or more, but under $3 million; and large charities, with annual revenue of $3 million or more.
Australian Charities and Not-for-profits Commission, Charity size, ACNC, Melbourne, n.d. available from https://www.acnc.gov.au/tools/topic-guides/charity-size [accessed 10 February 2026]; and
Australian Charities and Not-for-profits Commission, Australian National University, ACNC, Melbourne, n.d. available from https://www.acnc.gov.au/charity/charities/3ef40f2a-39af-e811-a963-000d3ad244fd/profile [accessed 20 October 2025].
56 Operating surplus refers to total revenue less expenses. As outlined at Figure 2.4, expenses associated with operating surplus from teaching include teaching and support space utilisation, staff time, academic support services, and campus-wide overheads such as library and IT support.
57 Public sector research funding includes the National Institutes Grant.
58 Nationally competitive research grants include those provided by the Australian Research Council and National Health and Medical Research Council and Medical Research Future Fund. ANU has decreased its share of National Health and Medical Research Council and Australian Research Council grants, and while it has increased its share of Medical Research Future Fund grants, this is from a low base, with earnings totalling $34.5 million from 2018 to 2023.
59 Other income comprises: donations and bequests; scholarships and prizes; non-government grants; net gain on disposal of property, plant and equipment; net foreign investment gains; revenue related to service concession arrangements; and other revenue (not elsewhere classified).
60 The Group of Eight (Go8) is eight of Australia’s leading research-intensive universities, which include the Australian National University ($1.6 billion revenue in 2024), Monash University ($3.5 billion revenue in 2024), The University of Adelaide (now Adelaide University, $1.3 billion revenue in 2024), The University of Melbourne ($3.7 billion revenue in 2024), The University of New South Wales ($3.3 billion revenue in 2024), The University of Queensland ($2.7 billion revenue in 2024), The University of Sydney ($3.9 billion revenue in 2024), and The University of Western Australia ($1.3 billion revenue in 2024).
Department of Education, Finance 2024: Financial Reports of Higher Education Providers, Education, Canberra, November 2025, available from https://www.education.gov.au/higher-education-publications/resources/finance-2024-financial-reports-higher-education-providers [accessed 30 January 2026].
61 Auditor-General Report No. 30 1996–97, Australian National University Administration, p. 5.
62 In November 2025, the Audit Finance and Risk Committee considered a paper explaining the key adjustments and assumptions in reporting the underlying operating result.
63 Australian Securities and Investments Commission, Regulatory Guide 230 Disclosing non-IFRS financial information, ASIC, December 2011, p. 19, available from https://download.asic.gov.au/media/1241462/rg230-published-9-december-2011.pdf [accessed 27 January 2026], states: ‘[i]tems that have occurred in the past or are likely to occur in a future period should not be described as ‘one-off’ or ‘non-recurring’.’
64 Australian National Audit Office, Financial statement audit information, ANAO, Canberra, 4 March 2024, available from https://www.anao.gov.au/financial-statement-audit-information [accessed 27 January 2026].
65 Auditor-General Report No. 17 2025–26, Audits of the Financial Statements of Australian Government Entities for the Period Ended 30 June 2025, pp. 49–50.
66 ibid., p. 50.
67 S&P Global, Understanding Credit Ratings, S&P Global, n.d., available from https://www.spglobal.com/ratings/en/credit-ratings/about/understanding-credit-ratings [accessed 27 January 2026].
68 Equivalent full time student load (EFTSL) is a standardised measure of a student’s academic study load over a year. An EFTSL of 1.0 represents the full annual workload for a full-time student.
69 Australian Trade and Investment Commission, Pathways: ELICOS, VET and Foundation Studies, ATIC, Sydney, n.d., available from https://www.studyaustralia.gov.au/en/plan-your-studies/universities-and-higher-education/pathways-to-university [accessed 19 January 2026].
70 ibid.
71 This calculation is based on average margin across ANU postgraduate and undergraduate courses. Shortfalls in research and non-award student load have been excluded for the purposes of this analysis. Domestic undergraduate enrolments in 2020 (a subset of total domestic enrolments) were higher than expected (7,691, compared with 7,188 in the projections accompanying the 2018 decision to cap student numbers). ANU made an average loss of $659 per domestic undergraduate enrolment in 2020, and this has been included in the $32.2 million shortfall.
72 Reserve Bank of Australia, The COVID-19 Pandemic: 2020 to 2021, RBA, Sydney, n.d. available from https://www.rba.gov.au/education/resources/explainers/the-covid-19-pandemic-2020-to-2021.html [accessed 20 January 2025].
73 ibid.
74 ANU defines ‘restricted’ funds as ‘investments arising from donations and bequests from donors for the purpose of funding scholarships, prizes, foundations and endowments held in perpetuity, with only distributions available for expenditure [and] funds to meet the cost of the employer’s liability under the Commonwealth Superannuation Scheme’.
Australian National University, Annual Report 2024, ANU, Canberra, April 2025, p. 177, available from https://www.anu.edu.au/about/strategic-planning/annual-report-2024 [accessed 30 January 2026].
75 The value of this contract was $48,000.
76 The presentation of financial information to Council presents items that are routinely excluded from the management and underlying operating results (investment income, insurance proceeds from the hail event, and deferred expenses) on separate lines. The February 2024 Council meeting minutes record consideration of how to publicly communicate the gap between the underlying operating result (which was projected to be in deficit) and the audited net operating result (which was projected to be in surplus).
77 The Senior Leadership Group (also known as the Strategic Leadership Group) is composed of: Vice-Chancellor (Chair); Provost (Deputy Chair); Deputy Vice-Chancellors; College Deans; Chief Operating Officer; Vice Presidents; Chief Financial Officer; Chief People Officer; and Chief Information Officer. The Vice-Chancellor, Provost, and one College Dean (as Chair, Academic Board (non-voting) are also members of Council.
78 In November 2025 and January 2026 ANAO was advised by the Chancellor (and Council Chair) and a Council member that Council records were intentionally limited due to concerns about confidential information being provided to media and Senators. One potential misuse of information following a meeting of the ANU Council on 3 July 2025 was investigated. The fact that the information was shared was substantiated, but the source of the information was not identified. There is no evidence that concerns about leaked information from Council would have affected record-keeping in August 2024.
79 The total cost of ‘strategic change support’ from Nous between May 2024 to March 2025 was $1.2 million (including extensions and excluding GST). Nous was contracted for a further engagement in April 2025 to support Renew ANU, with a total value over the term of that contract of up to $2 million. The ANAO saw no invoices for work completed under this second engagement.
80 On 4 July 2025, the Vice-Chancellor sought advice from TEQSA: ‘As you might also be aware, there has been some speculation in the media and within my own community that the University must pause its Renew ANU activities whilst this TEQSA Compliance Assessment occurs. It would be helpful to understand TEQSA’s expectations here.’ The response from TEQSA, dated 17 July 2025, stated: Regarding ‘Renew ANU’, TEQSA has not required ANU to suspend its current operations and programs of work, including ‘Renew ANU’. This is because TEQSA has not made any findings that would prompt this action.’ [Underlining in original.]
81 The total cost of ‘strategic change support’ from Nous between May 2024 and March 2025 was $1.2 million (including extensions and excluding GST). Nous was further contracted in April 2025 to support Renew ANU, with a total value over the term of the contract of up to $2 million. The ANAO saw no invoices for work completed under this second engagement.
82 Commonly known as the ‘Nixon Report’, the Report of a Review into matters of gender and culture in the ANU College of Health and Medicine and its constituent Schools, the John Curtin School of Medical Research, the School of Medicine and Psychology, and the National Centre for Epidemiology and Population Health was commissioned on 12 September 2024 by the Provost following disclosures of harm from staff and students.
Australian National University, Nixon Review about gender and culture matters at ANU former College of Health and Medicine: Final Report published, ANU, Canberra, n.d., available from https://www.anu.edu.au/news/all-news/nixon-review-report-published [accessed 30 January 2026].
83 Australian National University, The Australian National University Enterprise Agreement 2023–2026, ANU, Canberra, 5 December 2023, clause 1.2, available from https://services.anu.edu.au/human-resources/enterprise-agreement [accessed 21 April 2026].
84 ANAO analysis based on UNESCO, Other Policy Relevant Indicators — Education, Total inbound internationally mobile students, both sexes (number), available from https://databrowser.uis.unesco.org/browser/EDUCATION/UIS-EducationOPRI [accessed 1 February 2026].
85 Department of Education, Australian Strategy for International Education 2021-2030, Education, Canberra, February 2025, p. 6, available from https://www.education.gov.au/australian-strategy-international-education-2021-2030 [accessed 27 January 2026].
86 ANU Act, section 8; PGPA Act, sections 8 and 12.
87 ANU Act, sections 9, 32, 33, 34, 35, 37 and 50.
88 ibid., sections 10 and 12.
89 ibid., subsections 10(4) and 10(5).
90 Charter of the ANU Council, clause 4.
91 ANU Act, subsection 12(4).
92 Australian National University (Governance) Statute 2024, subsection 22(1).
93 ibid., subsection 22(2).
94 Standing Orders of the ANU Council and Council Committees, clause 13.
95 ibid., clause 24.
96 ANU Act, section 32; Australian National University (Governance) Statute 2024, sections 41 to 45; Charter of the ANU Council, clause 7.
97 Australian National University (Governance) Statute 2024, subsection 40(3).
98 ibid., section 40; Charter of the ANU Council, clause 7.
99 ibid.
100 ANU Act, section 34; Australian National University (Governance) Statute 2024, section 53 and 59 to 62; Charter of the ANU Council, clause 10.
101 Charter of the ANU Council, clause 10.
102 ibid.
103 ibid., clause 10.1.