Browse our range of reports and publications including performance and financial statement audit reports, assurance review reports, information reports and annual reports.
Annual report
ANAO Annual Report 2025–26
Published
Tuesday 22 September 2026
Contact
Please direct enquiries through our contact page.
This annual report documents the performance of the Australian National Audit Office (ANAO) in the financial year ended 30 June 2026. The report addresses all applicable obligations under the Public Governance, Performance and Accountability Act 2013; the Public Governance, Performance and Accountability Rule 2014; the Auditor-General Act 1997; the performance measures set out in the outcome and programs framework in the ANAO’s Portfolio Budget Statements 2025–26 and in the ANAO Corporate Plan 2025–26; and annual reporting requirements set out in other relevant legislation.
1. Review by the Auditor-General
I am pleased to present the Australian National Audit Office (ANAO) Annual Report for 2025–26.
Throughout 2025–26, the ANAO continued to fulfil the Auditor-General’s mandate under the Auditor-General Act 1997 through the delivery of independent, high-quality reporting to the Australian Parliament on the financial and non-financial performance of Australian Government entities.
Our work continued to be shaped by broader trends affecting the Australian public sector. Geopolitical developments, fiscal pressures, the rapid emergence of new technologies, including artificial intelligence, and heightened cyber and security risks are among the factors influencing government activity and risk — and therefore the ANAO in its work as the government’s independent auditor.
In this environment, our audits have reinforced the importance of disciplined governance, effective controls and clear accountability in supporting sound public administration.
Our work
Throughout the year, the ANAO contributed to transparency, accountability and improved public sector performance by reporting on matters of significant public interest and consequence. Our performance audits covered areas including Commonwealth procurement, grants management, cyber security, integrity, as well as major programs such as the National Disability Insurance Scheme (NDIS), Commonwealth Home Support Program, the Age Pension and Snowy 2.0.
In December 2025, we delivered the 18th and final annual Major Projects Report with the Department of Defence, a product that served the Parliament well for many years. Going forward I intend to provide the Parliament with increased assurance across the Defence portfolio, including through audits of Defence capability investment priorities.
The impact of our work is reflected in how our reports are used by the Parliament, acted on by entities and influence changes to public sector frameworks. This year, for example, our audit findings informed legislative reforms to strengthen integrity and safeguarding arrangements in the NDIS, contributed to APS-wide integrity action plans, and informed parliamentary debate on the measurement, oversight and delivery of suicide prevention programs.
Our financial statements audits have led to improvements in public sector financial management and internal controls with the majority of financial statements audit findings agreed to and addressed by audited entities. However, the continued prevalence of weaknesses in IT controls, and an increase in reported legislative breaches, are areas where sustained attention is needed.
Our performance statements audits are supporting entities to comply with legislative requirements, build capability in performance management systems, and increase reliability and quality of performance measures. There remains an opportunity for improvement in more meaningful performance reporting, measurement of efficiency and productivity, and reporting on cross entity measures.
Our relationship with the JCPAA remained central to the impact of our work. During 2025–26, the committee commenced eight inquiries covering 15 Auditor-General reports, and we supported its work through public hearings, private briefings, correspondence and advice. Following the election of the 48th Parliament, we increased our engagement with the newly constituted committee, and other parliamentary committees. This engagement helps ensure our work remains responsive to the Parliament’s priorities and supports the JCPAA in scrutinising the use of public resources and the performance of government entities.
During 2025–26, the ANAO delivered:
- 243 audit opinions for annual financial statements of Commonwealth entities, Commonwealth companies and their subsidiaries, and the consolidated financial statements of the Australian Government;
- 21 audit opinions for annual performance statements of material Commonwealth entities;
- 39 performance audits, one priority assurance review, the 2024–25 Major Projects Report, and one other report on the Australian National University’s financial management;
- 51 other audit services undertaken under legislation or section 20 of the Auditor-General Act 1997;
- four reports summarising themes and lessons from our financial statements, performance statements and performance audit work; and three insights products aimed at contributing to improved public sector performance.
We met five of our nine performance measures. External pressures, including rising costs and delays in activity by audited entities, contributed to the targets not met. We will continue to focus on the aspects of our performance that are within the ANAO’s control.
Beyond delivering our mandated functions, in 2025–26 we made progress against our strategic priorities: impact where it matters, performance through innovation, and inspiring and developing our people. In the first year of implementing our strategic program, we trialled new approaches to audits, including rapid reviews and report-at-a-glance plain English summaries. We better calibrated our audit effort to risk, launched our Digital Strategy and AI policy, and increased use of data analytics and AI tools. We also increased our focus on internal staff mobility and career development, streamlined aspects of our governance, and introduced additional staff engagement activities to support and strengthen our already high levels of engagement.
Safeguarding quality and independence
All our work is underpinned by an enduring focus on quality and integrity. This year’s reports on the ANAO’s Quality Management Framework and Integrity Framework concluded that the frameworks were operating effectively. At a time when ethical conduct in the private audit profession is under heightened scrutiny, we have worked to strengthen the quality and integrity assurances we seek from contractors as well as continually improve our internal quality and integrity systems. These foundations are essential to maintaining the independence of the office and the trust placed in our work by the Parliament and the Australian public.
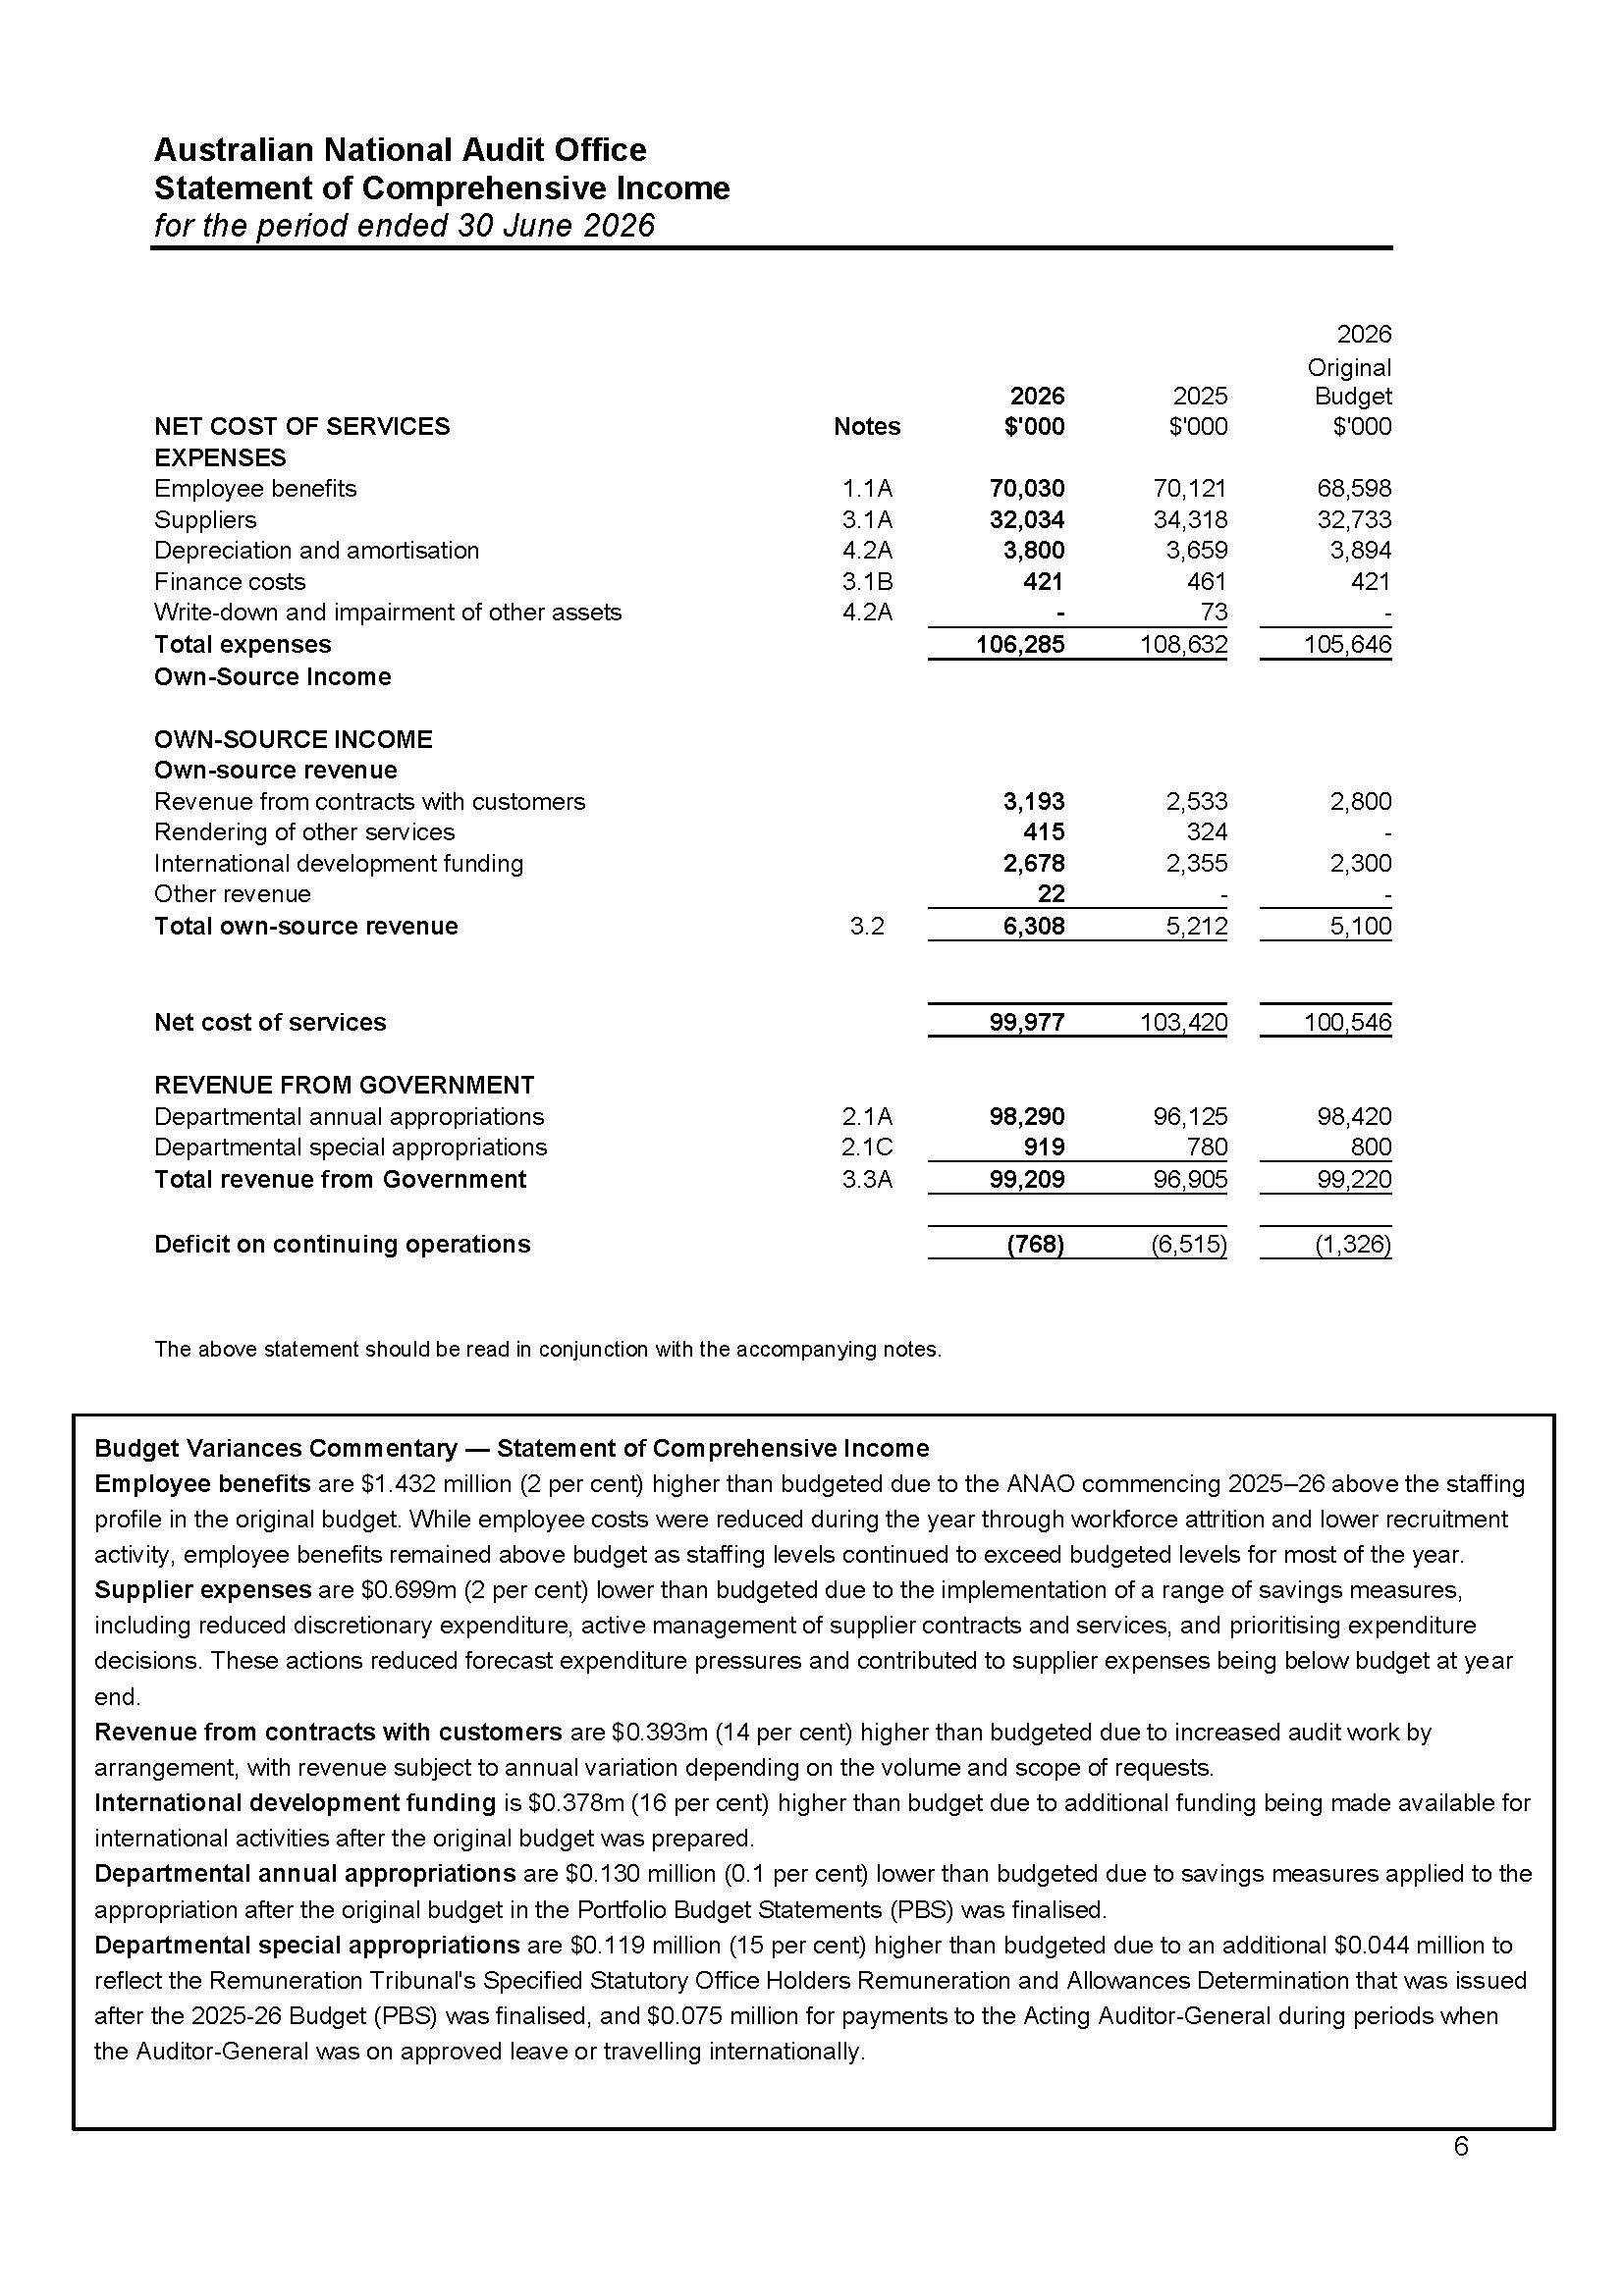
The ANAO reported an operating deficit of $0.768 million in 2025–26 — reduced from a $6.515 million operating deficit in 2024–25. Achieving this required a reduction in the target number of performance audits from 48 in 2024–25 to 38 to 42 in 2025–26, and efforts to increase efficiency including through a greater focus on aligning audit effort to risk, managing peak workloads and use of automation. Our average staffing levels reduced through attrition and controlled recruitment, and supplier expenses were managed through efficiencies and careful prioritisation of procurement activity.
Financial sustainability remains an ongoing challenge. In its 2026–27 Budget Day Statement the JCPAA observed that ‘funding of the ANAO continues to be of serious concern to the Committee as it threatens the robustness of the vital audit function that this agency conducts for the Commonwealth.’ A benchmarking exercise of the Australasian Council of Auditors-General found that Australia’s Auditor-General independence arrangements fell from seventh in 2020 to ninth in 2025, out of 12 rankings. Low scores on financial and managerial autonomy were key factors contributing to this result.
The JCPAA’s 2022 Report 491 Review of the Auditor-General Act 1997 recommended changes to preserve and enhance the Auditor-General’s independence and mandate. I look forward to the government’s response to the JCPAA’s recommendations.
Acknowledgements
Our people are the foundation of all that we achieved in 2025–26. Audit is demanding work, and this year we asked a great deal of our auditing staff and those who support them. I am proud of the ANAO team and grateful for the professionalism, engagement and deep commitment to our purpose they have shown throughout the year. Their work reflects our values of respect, integrity and excellence, and the discipline and ethical judgement that underpin trust in the ANAO.
I want to acknowledge the leadership and service of the former Deputy Auditor-General, Rona Mellor PSM, who retired during the year after a distinguished 40-year career in the Australian Public Service, including almost 11 years at the ANAO. Rona made a significant contribution to the office’s work and culture, and leaves a legacy of quality independent assurance and service to the Parliament that we continue to build on.
2026 marks the 125th anniversary of the passage of the Audit Act 1901 by the first Parliament of the Commonwealth of Australia. It is a milestone that invites reflection on the enduring role of public sector audit in Australia’s public accountability framework. Much has changed in Australia since the Federation, but the ANAO’s focus remains constant: to provide independent assurance to the Parliament and contribute to better outcomes for the Australian public. I look forward to working with our ANAO team as we continue to uphold our purpose and serve the Parliament and the Australian community.
Dr Caralee McLiesh PSM
Auditor-General
Summary of performance results
2. Overview of the ANAO
Our purpose and outcome
The Australian National Audit Office’s purpose and outcome is to support accountability and transparency in the Australian Government sector through independent reporting to the Parliament, and thereby contribute to improved public sector performance.
We provide independent assurance to the Parliament on whether the executive government is operating, and accounting for its performance, in accordance with the Parliament’s intent.
Our mandate, functions and accountable authority
The ANAO delivers its purpose under the Auditor-General’s mandate, in accordance with the Auditor-General Act 1997, the Public Governance, Performance and Accountability Act 2013 and the Public Service Act 1999.
The Auditor-General is the accountable authority for the ANAO. During the reporting period 1 July 2025 to 30 June 2026, the Auditor-General was Dr Caralee McLiesh PSM. Dr McLiesh was appointed on 4 November 2024.
The Governor-General, on the recommendation of the Joint Committee of Public Accounts and Audit (JCPAA) and the Prime Minister, appoints the Auditor-General for a term of 10 years.
As an independent officer of the Parliament, the Auditor-General has complete discretion in exercising functions and powers under the Auditor-General Act 1997 and is not subject to direction in relation to:
- whether a particular audit is to be conducted;
- the way a particular audit is to be conducted; or
- the priority given to any particular matter.
Under the Auditor-General Act 1997, the Auditor-General’s functions include:
- auditing the annual financial statements of Commonwealth entities, Commonwealth companies and their subsidiaries, and the consolidated financial statements;
- conducting performance audits and assurance reviews;
- auditing the annual performance statements and performance measures of Commonwealth entities and Commonwealth companies and their subsidiaries;
- conducting performance audits of Commonwealth partners under section 18B of the Act;
- providing other audit services as required by legislation or under section 20 of the Act; and
- reporting directly to the Parliament, or to a minister, on matters that warrant attention.
In exercising these functions and powers, the Auditor-General must have regard to the audit priorities of the Parliament, as determined by the JCPAA, and any reports made by the committee under the Public Accounts and Audit Committee Act 1951.
The ANAO supports the Auditor-General in performing this work.
Our programs
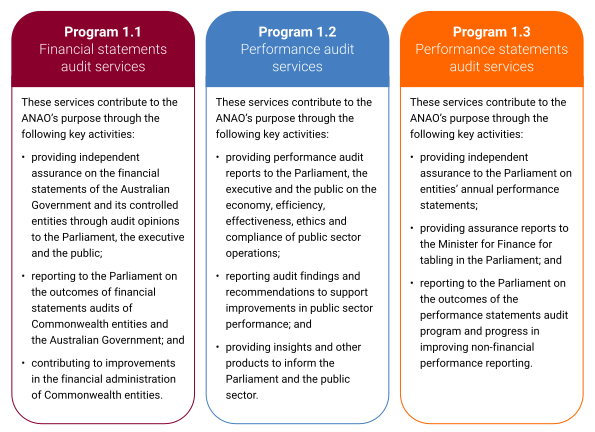
The ANAO’s three programs for 2025–26, and the key activities within these programs, are shown in Figure 2.1.
Figure 2.1: ANAO programs and key activities, 2025–26
Organisational structure
To deliver its purpose, the ANAO is organised into six functional areas:
- Corporate Management Group leads corporate strategy and operations, providing enabling services across finance, governance, human resources, information technology, communications, change management, procurement, legal support and external relations.
- Financial Statements Audit Services Group provides independent assurance on the financial statements and financial administration of Australian Government entities, and conducts assurance reviews.
- Performance Audit Services Group conducts performance audits and assurance reviews of Australian Government entities and their activities, and produces performance audit publications.
- Performance Statements Audit Services Group audits annual performance statements and measures of Australian Government entities.
- Professional Services Group provides technical accounting expertise, audit support, and manages the ANAO’s quality management and integrity frameworks.
- Systems Assurance and Data Analytics Group provides IT and data analytics support to the ANAO’s full range of audit work.
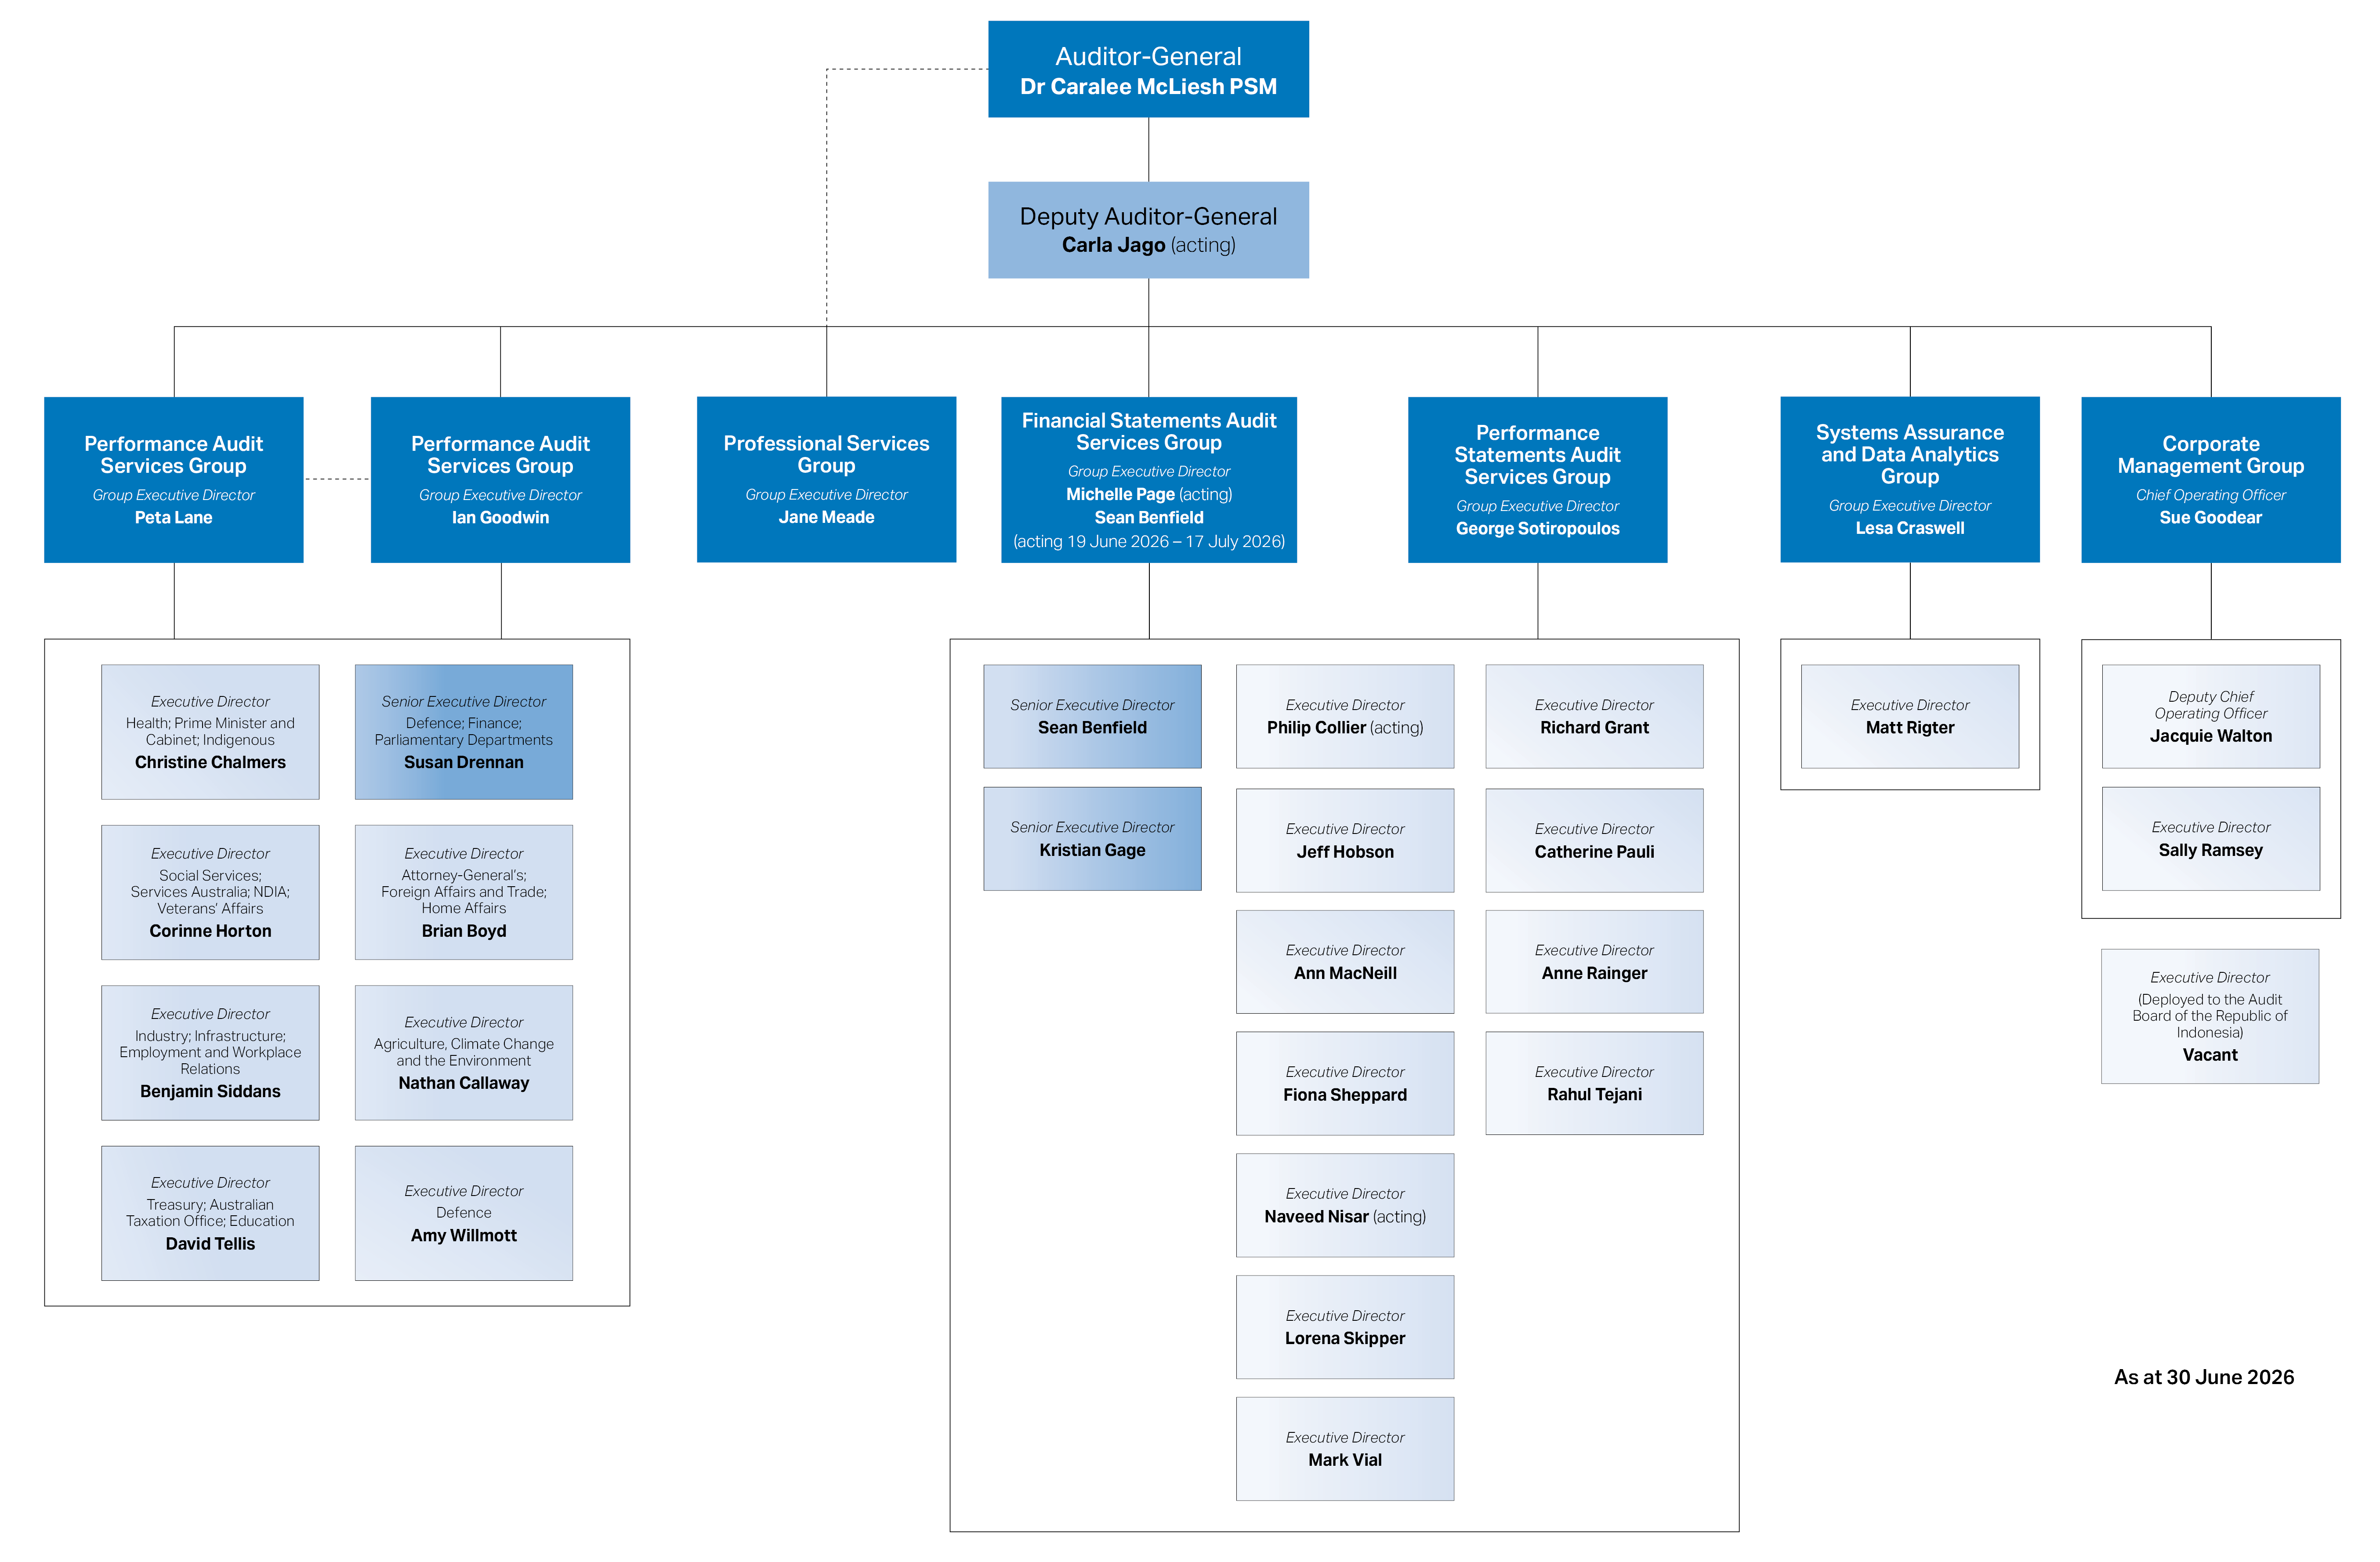
The ANAO’s organisational structure at 30 June 2026 is shown in Figure 2.2.
Figure 2.2: Organisational structure at 30 June 2026
3. Annual performance statements
Independent Auditor’s report
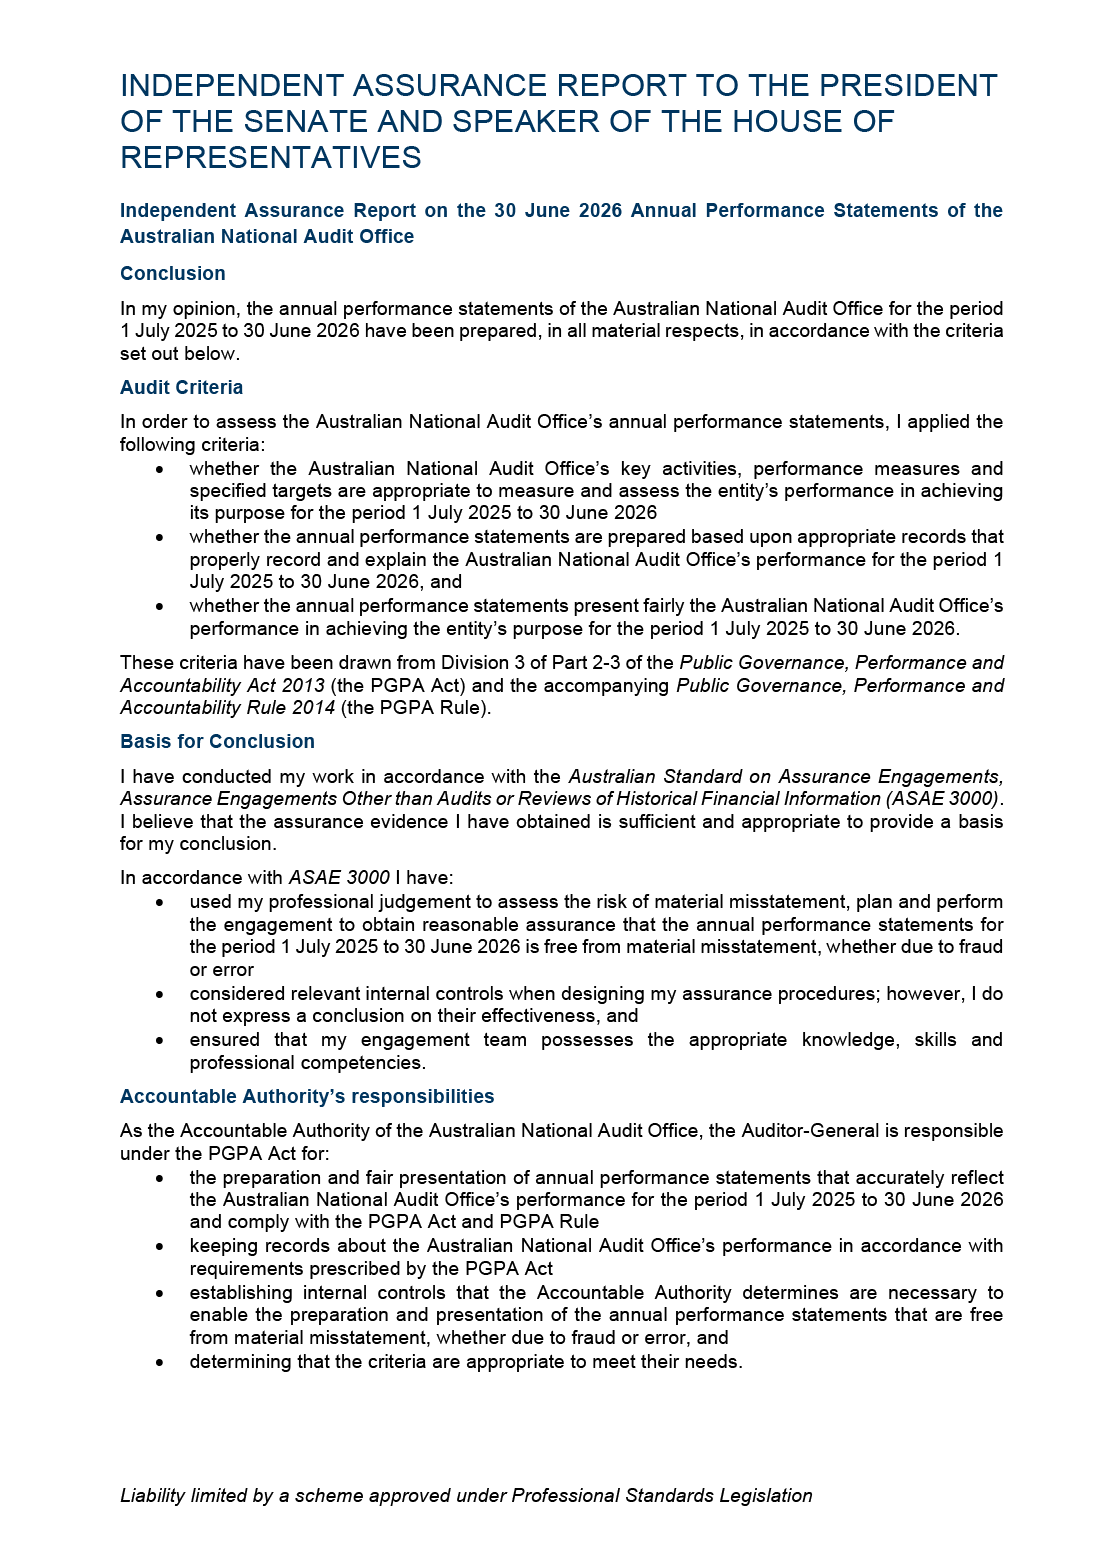
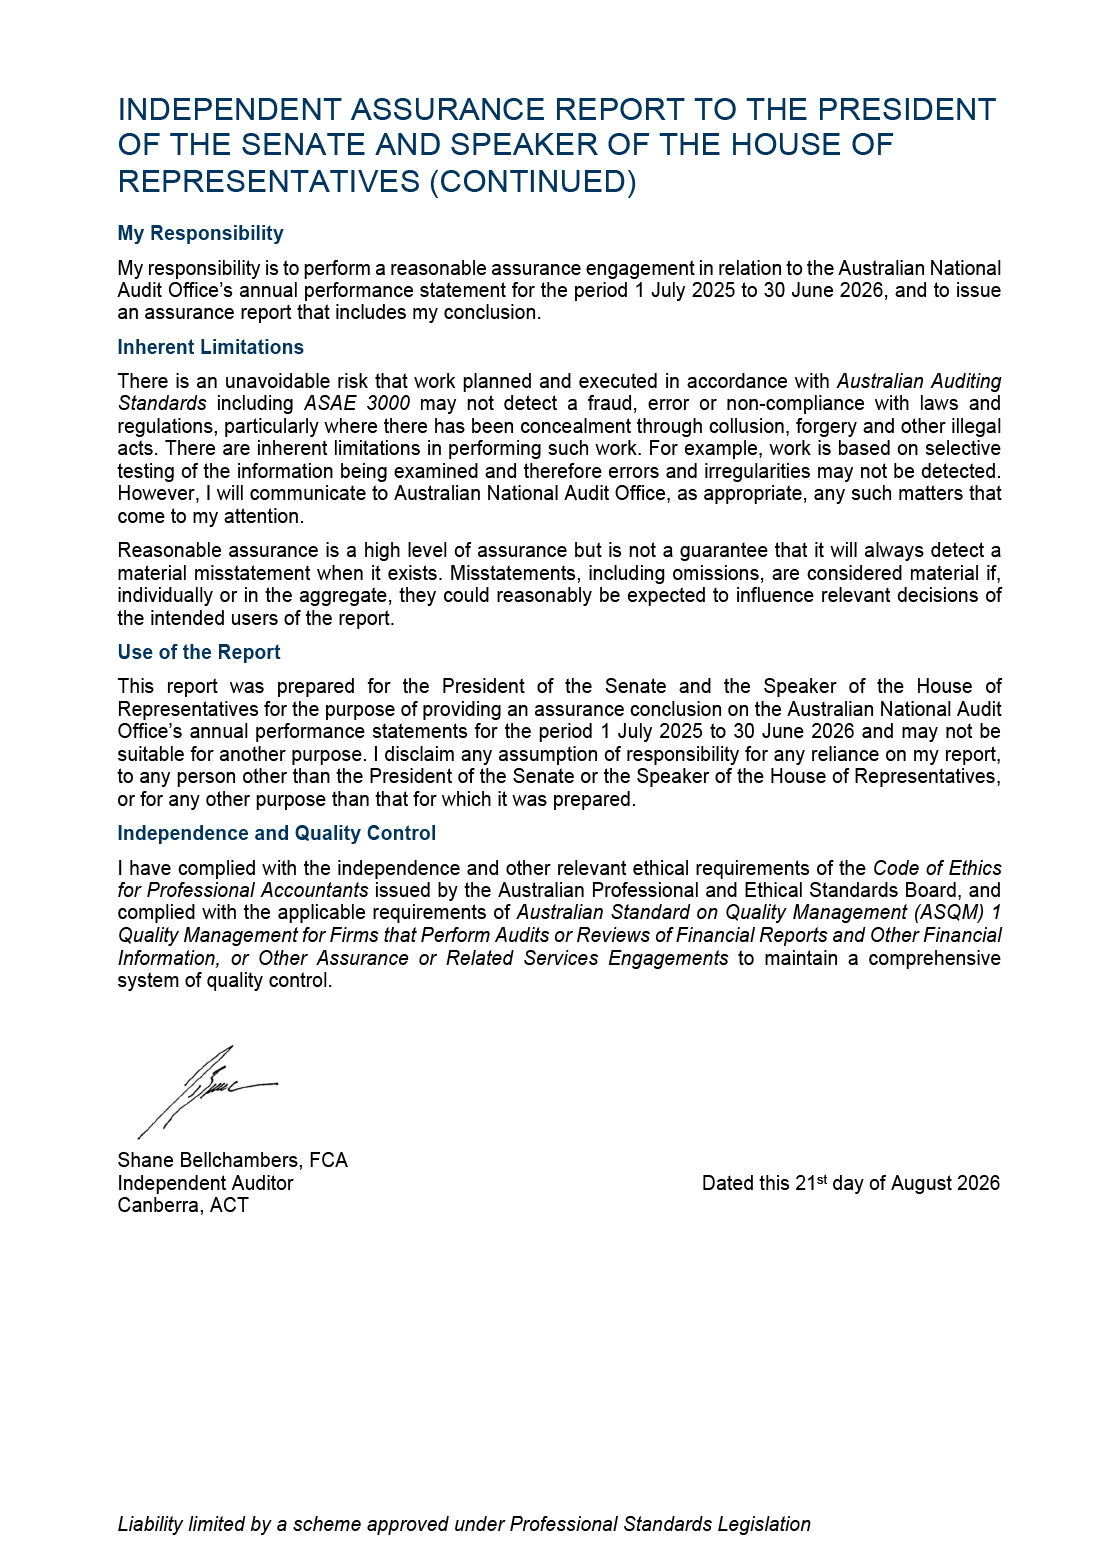
Statement of preparation by the Auditor-General
As the Accountable Authority of the Australian National Audit Office (ANAO), I present the 2025–26 annual performance statements as required under paragraph 39(1)(a) and (b) of the Public Governance, Performance and Accountability Act 2013 (PGPA Act), and section 16F of the Public Governance, Performance and Accountability Rule 2014.
In my opinion, these annual performance statements are based on properly maintained records, accurately present the ANAO’s performance in the reporting period and comply with subsection 39(2) of the PGPA Act.
Overview of performance
In 2025–26, the ANAO continued to achieve our purpose through the delivery of independent audit and assurance services to the Parliament and Australian Government entities. Across financial statements, performance audit and performance statements audit functions, the ANAO provided assurance, insights and recommendations that contributed to improved accountability, transparency and public sector administration.
Performance results
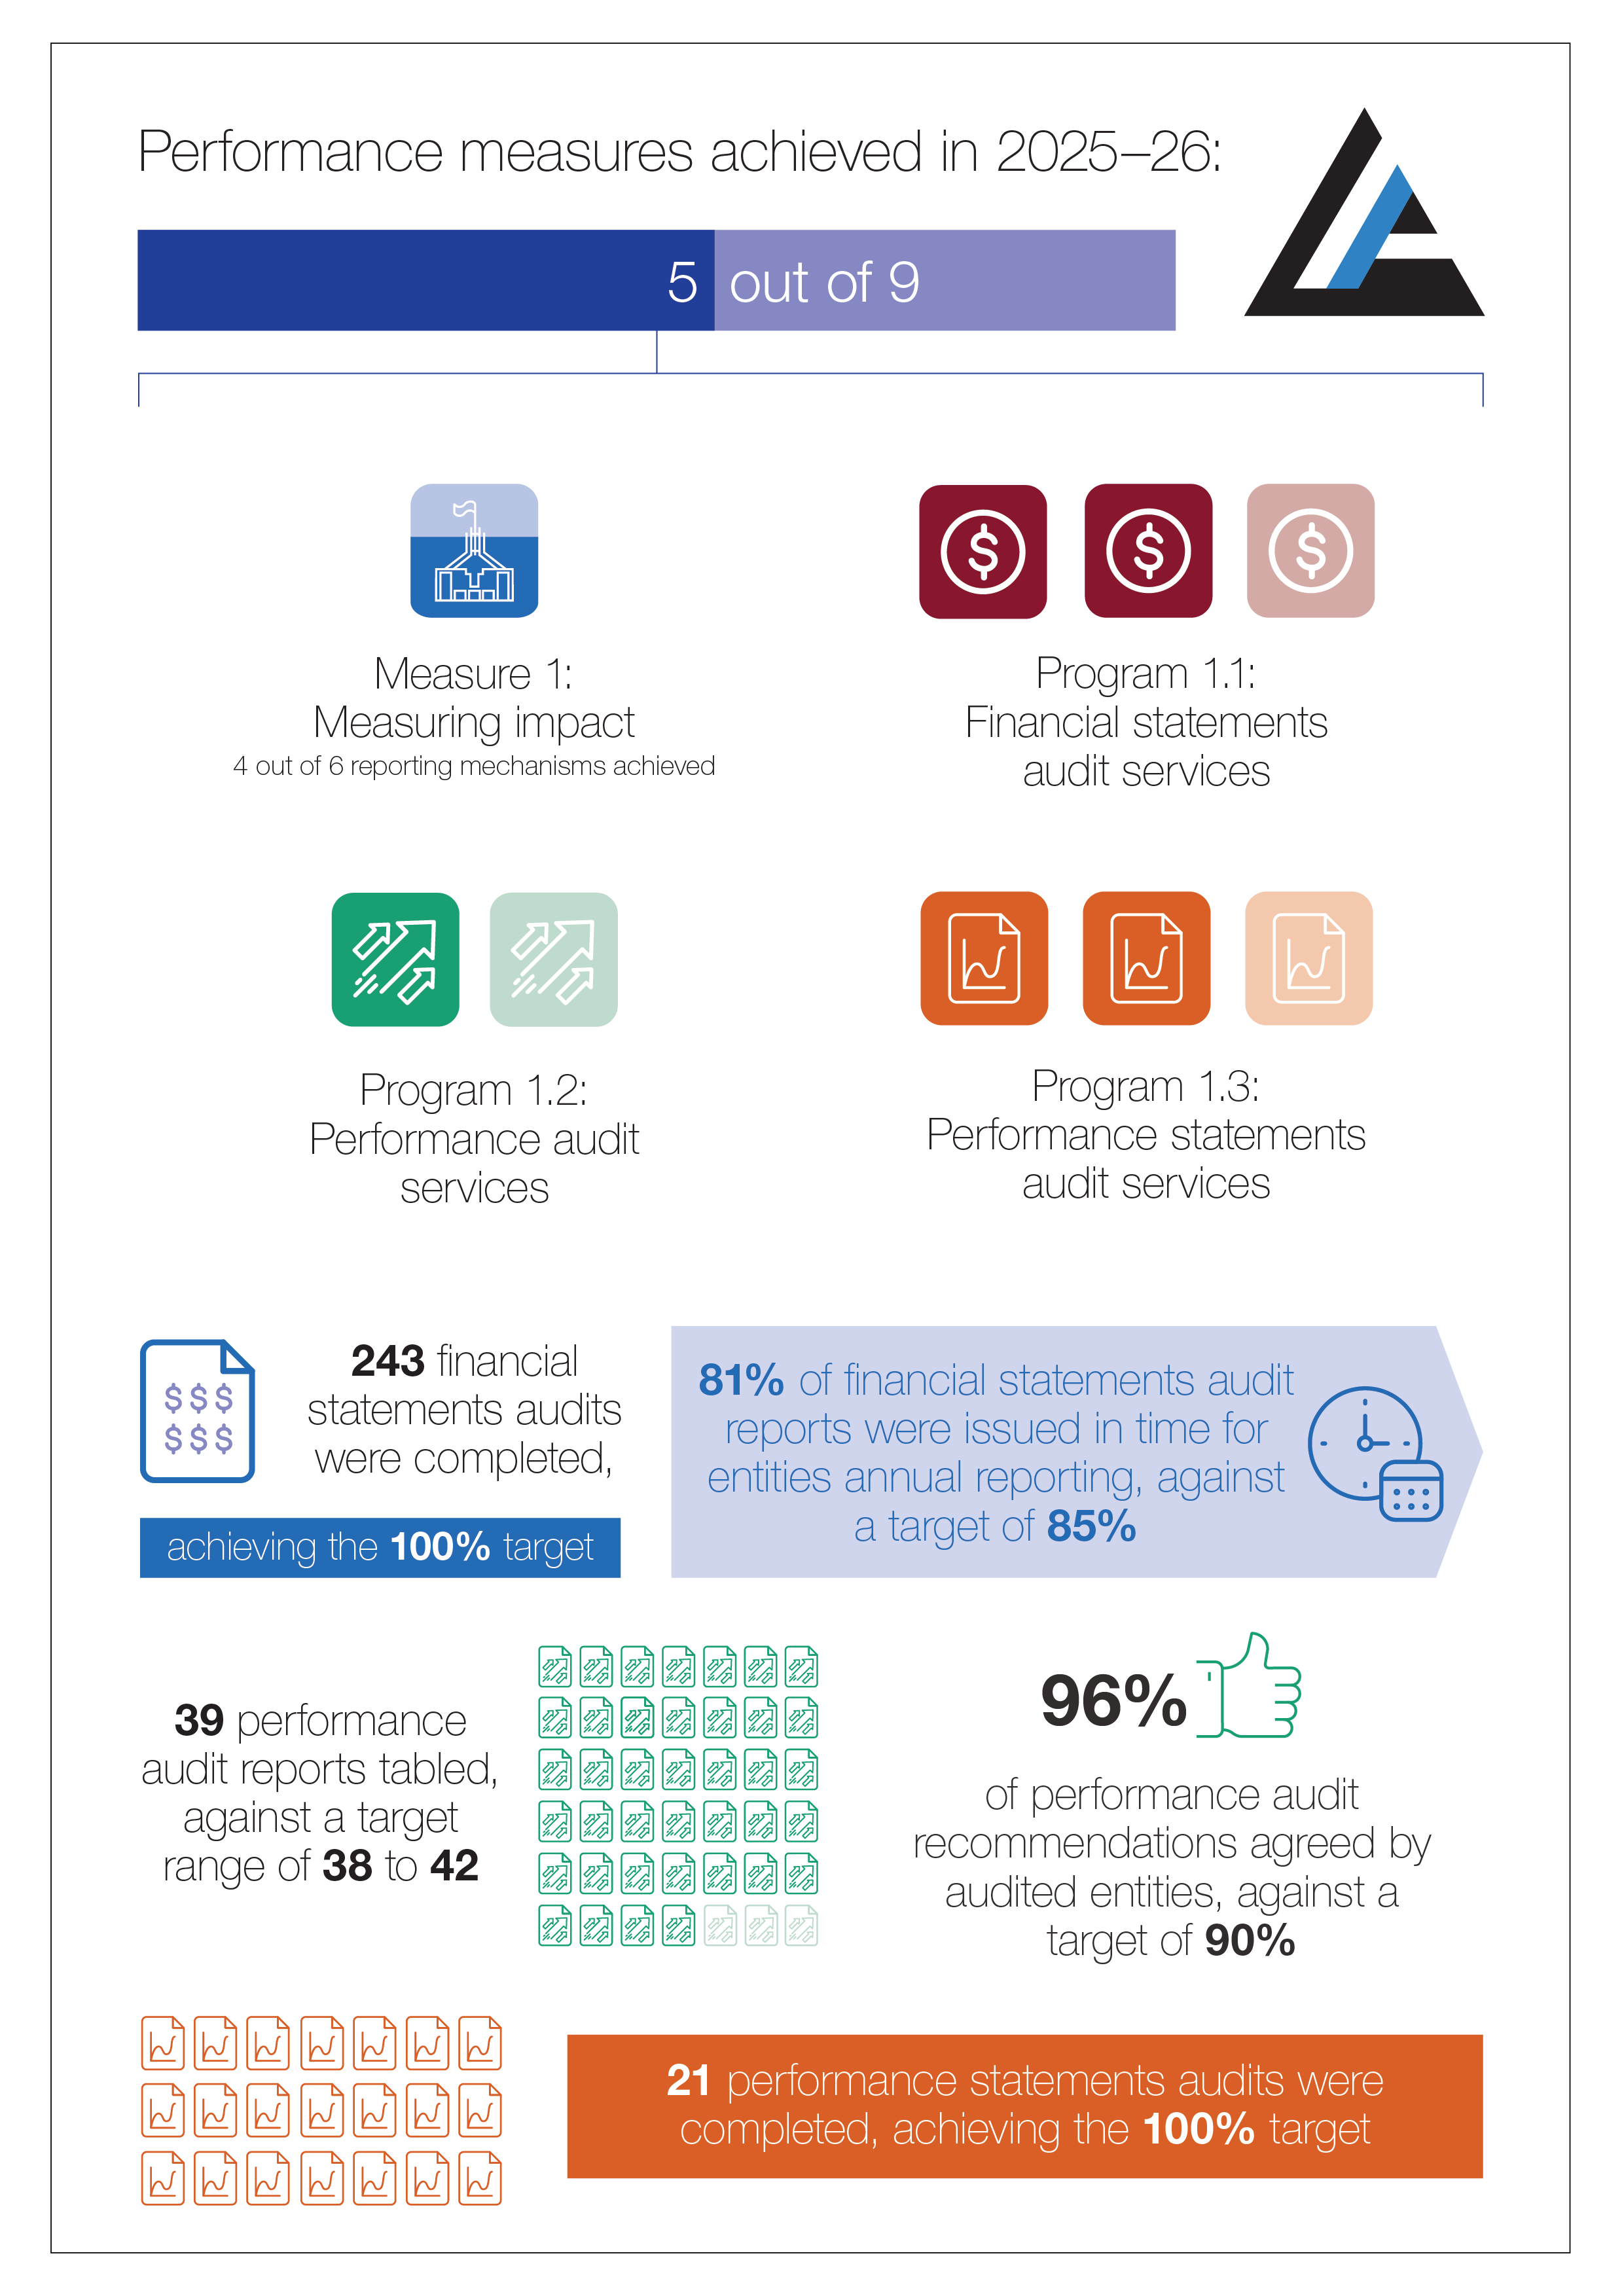
The ANAO achieved five of nine performance measures in 2025–26. While not all measures were achieved, the ANAO maintained audit quality and delivered its mandated financial statements audit program, requested performance statements audits and performance audit program in full.
Taken together, the results demonstrate strong core delivery in a more complex audit environment, while also highlighting areas for continued improvement in timeliness of delivery for financial statements audits and performance statements audits, efficiency of performance audits of complex programs, and the way we demonstrate the impact of our work. In particular, the impact measure reflects the challenge of measuring influence that often emerges over time. We will continue to strengthen the evidence base for this measure by refining how we identify, monitor and use potential and realised impacts to inform future audit planning, engagement and reporting.
In summary, the 2025–26 performance results were:
- Measure 1 — Impact: Four of six reporting mechanisms achieved. As all six mechanisms must be met for the measure to be achieved, the overall measure was not met.
- Program 1.1 — Financial Statements Audit Services: Two of three performance measures achieved.
- Program 1.2 — Performance Audit Services: One of two performance measures achieved.
- Program 1.3 — Performance Statements Audit Services: Two of three performance measures achieved.
Factors influencing performance
The ANAO delivered its performance in an operating environment increasingly shaped by complex service delivery models, cross-entity dependencies, fiscal and workforce pressures, regulatory and stewardship challenges, major program and project delivery, emerging digital and cyber risks, and heightened expectations of transparency, productivity and measurable impact. These conditions are changing the nature of audit risk and will continue to shape where assurance can provide the greatest value to the Parliament and the public sector.
These factors, together with delays in receiving auditable information from some entities and the expansion of performance statements auditing from 14 to 21 audits, affected some timeliness and efficiency measures. These pressures were moderated by improvements in audit methodology, greater standardisation through digital adoption, and increasing maturity within audited entities. This indicates that future performance and impact will depend not only on ANAO efficiency and capability, but also on the readiness of audited entities and the quality of public sector performance information.
The insights from this year’s results will inform future audit priorities and delivery approaches, helping the ANAO better target effort towards areas of greatest risk, complexity and public value, including digital transformation, service delivery performance and accountability across interconnected programs.
We also progressed implementation of our Strategy on a Page program which is helping translate the Auditor-General’s strategic direction into focused priorities, practical initiatives and measurable improvements in how the ANAO works. Building on the gains made this year in methodology, digital adoption and organisational capability, the program will continue to support innovation, improve productivity and strengthen our ability to deliver high-quality, impactful audit work in a more complex operating environment.
Performance measure 1
The ANAO recognises that meaningful performance information should go beyond describing our audit activity to explaining how our work has positive impact. For the ANAO, impact is therefore assessed through multiple indicators that reflect how audit work is used, acted on and trusted by the Parliament and Australian Government entities.
To give effect to this broader view of performance, we introduced performance measure 1 in the 2025–26 Corporate Plan to provide a more systematic basis for assessing how we measure and assess our impact. The measure recognises that the ANAO’s impact is realised not only through the delivery of audit reports, but through the extent to which those reports inform parliamentary scrutiny, prompt entity action, strengthen public sector frameworks and contribute to better administration and performance across government.
Performance measure 1 brings together six reporting mechanisms that assess the impact of our work and provide a more rounded assessment of how ANAO work contributes to public value. All six mechanisms must be achieved for the measure to be met.
In 2025–26, the ANAO met four of the six reporting mechanisms under this measure. The overall measure was not met because two mechanisms fell marginally below their targets, with both results within one percentage point of the required threshold. This outcome indicates that the ANAO has established a strong foundation for assessing impact, while also highlighting the need to further strengthen how audit findings are translated into timely entity action and how longer-term influence is evidenced.
The result should be viewed in the context of the nature of audit impact. While audit outputs and immediate responses can be measured directly, broader influence often emerges over time through changes to legislation, public sector frameworks, entity practices, parliamentary debate and stakeholder expectations.
During 2025–26, the ANAO continued to mature its approach through the use of an impact register and more systematic monitoring of potential and realised impacts. This will support stronger evidence of how audit work contributes to change beyond the delivery of individual products, and will better inform future audit planning, parliamentary engagement, entity follow-up and reporting on the ANAO’s contribution to improved accountability and public sector performance.
|
Measure 1 |
The extent to which our work and products support the Parliament and contribute to improvements in public sector performance |
|
|
Source |
ANAO Corporate Plan 2025–26 |
|
|
Overall resulta |
Achieved a result of 4 reporting mechanisms met against a target of 6 |
NOT MET |
|
200 |
390 |
124 |
Note a: The ANAO reports ‘not met’ if any of the mechanism targets are not met.
|
Reporting mechanism |
Outcomes |
Performance |
|
Reporting mechanism 1 |
||
|
Qualitative analysis of the use of ANAO products by the Parliament and changes to public sector frameworks. Feedback from the Joint Committee of Public Accounts and Audit (JCPAA) indicates the ANAO has contributed to improved public sector accountability and transparency and public sector administration through its reports and services to the Parliament. Assessment of the ANAO’s consideration of the audit priorities of the Parliament as determined by the JCPAA. |
Satisfied |
Achieved a result of MET |
|
Reporting mechanism 2 |
||
|
Percentage of moderate or significant findings from mandated financial statements audits and the performance statements audits that are agreed to by audited entities |
Financial statements audits — 89% against a target of 90% Performance statements audits — 97% against a target of 90% |
Achieved a result of NOT MET |
|
Reporting mechanism 3 |
||
|
Percentage of moderate or significant findings from mandated financial statements audits and the performance statements audits that are addressed by audited entities within 24 months of reporting |
Financial statements audits — 89%a against a target of 90% Performance statements audits — 94% against a target of 70% |
Achieved a result of NOT MET |
|
Reporting mechanism 4 |
||
|
Percentage of performance audit recommendations agreed to by audited entities and implemented within 24 months of performance audit being presented |
Agreed — 96% against a target of 90%b Implemented — 92% against a target of 70% |
Achieved a result of MET |
|
Reporting mechanism 5 |
||
|
Percentage of positive feedback received from entity surveys on the impact of audits |
Financial statements audit achieved a result of 92% against a target of 70% Performance audit achieved a result of 86% against a target of 70% Performance statements audit achieved a result of 92%c against a target of 70% |
Achieved a result of MET |
|
Reporting mechanism 6 |
||
|
The ANAO’s independent quality assurance program indicates that audit opinions and conclusions are appropriate and support the integrity of our audit reports |
Satisfied |
Achieved a result of MET |
Note a: All results in the ANAO’s 2025–26 performance statements have been rounded to the nearest whole number, with one exception. The rounding up of reporting mechanism 3 would have produced a false positive to having met the target (89.74 per cent against target of 90 per cent), so for this mechanism the number was rounded down.
Note b: This total consists of 89 per cent fully agreed and seven per cent agreed with qualification.
Note c: The result of 92 per cent represents positive feedback received from all individual respondents.
Reporting mechanism 1
Use of ANAO products by the Parliament and changes to public sector frameworks; the ANAO’s contribution to improved public sector accountability, transparency and administration; and the ANAO’s consideration of the audit priorities of the Parliament
As the independent auditor for the Parliament, we assess our impact through the extent to which our work informs parliamentary scrutiny and contributes to improvements in public sector accountability, administration and frameworks. Evidence of impact includes parliamentary use of Auditor-General reports, parliamentary engagement, and changes to legislation, policies and frameworks arising from our work.
Under this mechanism, we considered:
- parliamentary use of our products and changes to public sector frameworks;
- feedback from the Joint Committee of Public Accounts and Audit (JCPAA) on our performance; and
- our consideration of parliamentary audit priorities identified by the JCPAA.
The JCPAA is our primary parliamentary relationship, with responsibilities for reviewing Auditor-General reports, determining the audit priorities of the Parliament and overseeing our work. During 2025–26, we supported the committee through public hearings, private briefings, correspondence and advisory support.
During the year, the JCPAA commenced eight inquiries covering 15 Auditor-General reports. We attended seven public hearings and 11 private briefings and provided 24 pieces of correspondence. Private briefings increased from five in 2024–25, reflecting stronger engagement with the newly constituted committee and continued reliance on our advice to support committee inquiries.1
We also supported parliamentary scrutiny more broadly through appearances at committees other than the JCPAA, private briefings, submissions and tailored information for parliamentarians. During 2025–26, we attended seven public hearings, four private briefings and one classified hearing with other parliamentary committees. We also provided 27 private briefings to parliamentarians, compared to 20 in 2024–25, with 18 relating to specific audit reports, demonstrating continued parliamentary interest in and use of Auditor-General reports.2
Summary-level information of private briefings provided by the ANAO to parliamentarians and parliamentary committees is published on the ANAO website as they occur.
Feedback from the Joint Committee of Public Accounts and Audit
The ANAO seeks annual feedback from the JCPAA on the quality and usefulness of our reports and services to the Parliament. The feedback process asks the committee to consider six statements relating to the quality of ANAO reports, the value of ANAO advice and services, and the ANAO’s contribution to public sector administration, accountability and transparency.
For 2025–26, the JCPAA agreed with all six statements presented by the ANAO. The committee commented that: ‘The Committee thanks the ANAO for the high quality of its reports and analysis, and for the professionalism with which its officials engage with the Committee.’
Consideration of the audit priorities of the Parliament
In determining the ANAO’s audit work program3, the Auditor-General is required to have regard to the audit priorities of the Parliament as determined by the JCPAA. For the Annual Audit Work Program 2026–27, the ANAO addressed all 13 priority topics identified by the JCPAA. Three topics commenced as audits during 2025–26 and the remaining 10 topics were incorporated into the Annual Audit Work Program 2026–27. Additional suggestions from JCPAA members and other parliamentary committees were also reflected in the program through either standalone topics or expanded audit scopes.
Inclusion of a topic in the annual audit work program does not necessarily result in an audit being undertaken, as commencement decisions are at the sole discretion of the Auditor-General, and are informed by resource availability, emerging risks, and program prioritisation. The ANAO manages this through ongoing monitoring and adjustment of the work program.
ANAO impact register
During 2025–26, we further refined our approach to identifying, monitoring and evaluating our impact, including through the development of an impact register. This provides a more systematic evidence base for understanding how audit findings contribute to change beyond the delivery of audit products, including through improvements to public sector frameworks, entity practices and parliamentary scrutiny. Over time, these insights will help us better assess where our work has the greatest influence and use that evidence to inform future audit priorities and maximise the value of our assurance work.
The timing of these impacts varies. Some become evident shortly after our work is completed, while others emerge over a longer period. In 2025–26, we tracked changes to public sector frameworks resulting from our work, including impacts arising from audits completed in earlier years.
Table 3.1 provides an overview of impacts realised during the year.
Table 3.1: Overview of ANAO impacts realised in 2025–26
|
Type of impact |
Number of impactsa |
|
Change of legislation |
1 |
|
Change to Australian Public Service framework |
1 |
|
Increased awareness/discussion in the parliament |
5 |
|
Increased entity awareness |
3 |
Note a: Some audits are counted multiple times as they covered multiple impact types.
Illustrative examples of audit impact
Table 3.2 highlights a selection of impacts realised in 2025–26. These examples demonstrate how our work contributed to changes in legislation, public sector frameworks, entity practices and increased parliamentary awareness, supporting parliamentary scrutiny, public administration and accountability across government.
Table 3.2: Selected audit impact examples, 2025–26
|
Impact type |
Impact description |
Audit product |
|
Change of legislation |
Impact Our audit findings informed reforms that strengthened integrity and safeguarding arrangements within the NDIS. Evidence During debate on the National Disability Insurance Scheme Amendment (Integrity and Safeguarding) Bill 2026, parliamentarians referred to ANAO audit findings on fraud prevention controls and claimant compliance in support of enhanced powers, penalties, and compliance measures. |
Auditor-General Report No. 48 2024–25 National Disability Insurance Agency’s Management of Claimant Compliance with National Disability Insurance Scheme Claim Requirements |
|
Change to APS framework Increased entity awareness |
Impact Our audit contributed to APS-wide integrity reforms that strengthened governance, capability, assurance, and oversight arrangements. Evidence On 30 June 2025, the APSC published Strengthening Integrity in the APS and an accompanying action plan setting out short-, medium-, and longer-term reform activities that would commence from 1 July 2025. Reforms were consistent with a number of findings/recommendations made through our audit. https://www.apsc.gov.au/working-aps/hr-practitioners/aps-framework/strengthening-integrity-aps |
Auditor-General Report No. 43 2023–24 Australian Public Service Commission’s Administration of Integrity Functions |
|
Increased awareness/discussion in the parliament |
Impact Our audit informed parliamentary consideration of opportunities to strengthen the measurement, oversight, and delivery of suicide prevention programs. Evidence During debate in the Federation Chamber, members referred to our findings and recommendations. It was noted that the government had accepted the recommendations and was strengthening how suicide prevention programs are measured and delivered. |
Auditor-General Report No. 23 2025–26 Suicide Prevention Policy Development and Monitoring |
Reporting mechanism 2
Percentage of moderate or significant findings from mandated financial statements audits and the performance statements audits that are agreed to by audited entities
Audit findings
We provide audit findings to entities based on observations from financial and performance statements audits. These findings are aimed at assisting entities to improve financial and performance reporting, internal controls and business processes. Findings are classified into six categories based on risk and legal non-compliance.4
Findings are reported to accountable authorities and copied to audit committee chairs through management letters and closing reports. We confirm factual observations with entities before finalising reports, recognising that agreed findings and recommendations are more likely to be addressed.
This measure includes recommendations where an entity agrees with our observations but proposes an alternative approach to addressing the issue.
Financial statements results
The ANAO audits the annual financial statements of all Commonwealth entities and the consolidated financial statements of the Australian Government. In addition, the ANAO conducts audits by arrangement, contributing to a total program of 294 financial statements audits, comprising 243 mandated audits and 51 audits by arrangement during the 2024–25 financial statements audit cycle.
This measure reports on moderate or significant findings for material mandated entities raised during the 2024–25 financial statements audit cycle.5
During the 2024–25 financial statements audit cycle, no new significant findings were raised in material entity audits. Nine moderate findings were raised primarily related to IT governance, IT change management, accounting and control of non-financial assets, and compliance and quality assurance frameworks.6 One moderate finding on the valuation of land and building assets was not agreed to by the audited entity, the Australian War Memorial7 resulting in the majority of moderate or significant findings for material mandated entities (89 per cent) being agreed to by the entity, marginally missing the target of 90 per cent. The Australian War Memorial did not agree with the ANAO’s assessment of risk for the financial statements, however noted the ANAO’s recommendation. The ANAO reported on all financial statements findings across the sector in Auditor-General Report No. 17 2025–26 Audits of the Financial Statements of Australian Government Entities for the Period Ended 30 June 2025.
Performance statements results
This measure reports on moderate or significant findings for material entities raised during the 2024–25 performance statements audit cycle.8
During the 2024–25 performance statements audit cycle, eight significant and 27 moderate findings were raised. One moderate finding was not agreed to by the audited entity, resulting in 97 per cent of findings being agreed.
All audit findings and recommendations are followed up as part of the audit of the following year’s performance statements.
Reporting mechanism 3
Percentage of moderate or significant findings from mandated financial statements and the performance statements audits that are addressed by audited entities within 24 months of reporting
Entities are expected to address audit findings in a timeframe commensurate with the level of risk identified. We review the status of all findings during the interim and final stages of financial statements and performance statements audits. This measure assesses the percentage of significant and moderate findings addressed by entities as an indicator of our impact on public administration and financial and performance reporting.
The measure includes significant and moderate findings addressed by audited material entities within 24 months. A finding is considered addressed when the entity has responded to and actioned it.
Findings are reported at the conclusion of each audit cycle, and recommendations can take time to implement and embed. For 2025–26, this measure assessed whether findings raised in the 2022–23 audit cycle had been addressed by the time the 2024–25 audit cycle results were published.9
Financial statements results
During the 2022–23 financial statements audit cycle, we raised eight significant and 31 moderate findings in material entity audits. By the conclusion of the 2024–25 audit cycle, 35 findings (89 per cent) had been addressed.
We report annually to the Parliament on entities’ responses to financial statements audit findings through mid-year and end-of-year audit reports, which are published on our website, available at Financial statements audit reports | Australian National Audit Office (ANAO).
Performance statements results
For the 2024–25 performance statements audit cycle, only ten entities were included in this measure, as they had been audited over the full 24-month period from 2022–23 to 2024–25.
By the conclusion of the 2024–25 performance statements audit cycle, 16 moderate and 15 significant findings had been agreed to by entities. Of these, 29 findings (94 per cent) were addressed within the 24-month period, with two significant findings outstanding.
Reporting mechanism 4
Percentage of performance audit recommendations agreed to by audited entities and implemented within 24 months of performance audit being presented
Entity agreement to audit recommendations
We make recommendations in performance audit reports to support parliamentary scrutiny and improve public administration. Throughout an audit, we engage with entities on emerging findings and potential recommendations to ensure they understand their basis and intent, supporting informed responses before reports are finalised.
This measure assesses the percentage of recommendations agreed by audited entities. Where entities respond with qualifications, ANAO senior executives assess whether the qualification is consistent with the intent of the recommendation and should be counted as agreed.
Table 3.3 outlines entity responses to our recommendations. Recommendations are counted as agreed where they are accepted without qualification, or where any qualification does not contradict the recommendation’s intent.
In 2025–26, 184 recommendations were counted as agreed, including 14 agreed with qualification, resulting in a total of 96 per cent agreed. Four recommendations were agreed with qualification but assessed as not agreed, and four were noted. Recommendations may be noted where responsibility for implementation is shared across government and cannot be addressed by a single entity alone.
Table 3.3: Agreement to recommendations in performance audit reports, 2023–24 to 2025–26
|
|
Recommendations |
||||
|
Year |
Total number |
Fully agreed (%) |
Agreed with qualifications (%) |
Not agreed (%) |
Noted or no response by entities (%) |
|
2025–26 |
192 |
89 |
7 |
2 |
2 |
|
2024–25 |
221 |
95 |
1 |
3 |
1 |
|
2023–24a |
254 |
94 |
5 |
1 |
0 |
|
94 |
71 |
67 |
109 |
67 |
102 |
Note a: The total number of recommendations for 2023–24 has been corrected from 255 to 254 as a recommendation was double-counted in the ANAO Annual Report 2023–24.
Entity implementation of audit recommendations
We monitor entities’ implementation of performance audit recommendations through attendance at audit committees, follow-up audits and annual self-assessments by entities on implementation progress over a two-year period.
The ANAO has undertaken a series of performance audits of entities’ implementation of parliamentary and Auditor-General recommendations.10 These audits provided independent assurance over entities’ implementation of recommendations by examining audit evidence. Between 2019–20 and 2025–26, these audits assessed the implementation status of recommendations from selected performance audits.
The ANAO also collects self-reported implementation data from entities on the progress of audit recommendations two years after they were agreed. For 2025–26, this relates to recommendations from performance audits tabled in 2023–24. Self-reported data indicates that entities are largely implementing recommendations within 24 months of agreement (Table 3.4). For recommendations not yet implemented, most entities advised that work is underway.
Self-reported implementation data is not independently audited at the time of reporting. Implementation audits have identified instances where recommendations reported as implemented were assessed as not fully implemented. Across the implementation audits completed to date, 25 per cent of recommendations reported by entities as implemented were assessed by the ANAO as partly implemented or not implemented.11 This demonstrates that self-reported implementation results can differ from the results of ANAO audits.
Table 3.4: Percentage of performance audit recommendations implemented within 24 months
|
|
Recommendations |
|||
|
Year in which recommendations made |
Total number |
Implemented (%) |
Not implemented (%) |
No response provided (%) |
|
2023–24 |
254 |
92 |
8 |
0 |
|
2022–23 |
194 |
80 |
20 |
0 |
|
2021–22 |
161 |
80 |
20 |
0 |
|
141 |
108 |
108 |
108 |
105 |
Reporting mechanism 5
Entity feedback on the impact of audits
In 2025–26, ORIMA Research conducted independent surveys for the Financial Statements Audit Services Group and Performance Audit Services Group, measuring entities’ perceptions of the value of our audits in improving performance. Results are reported as index scores.
Financial statements audit services
The survey measured entity perceptions of financial statements audit services provided during the 2024–25 audit cycle, including the value of our assurance, policy and technical advice, and recommendations to improve financial management and internal controls.
Financial Statements Audit Services Group achieved a 65 per cent response rate, up from 59 per cent in 2024–25. Overall, 92 per cent of respondents agreed that they valued our work, a decrease from 96 per cent in the prior year.
Performance audit services
The survey covered 37 entities across 44 performance audits tabled between the final quarter of 2024–25 and the third quarter of 2025–26. Results were based on respondents’ level of agreement with four statements relating to the value of our assurance, support for performance improvement, sharing of good practice, and independent audit opinions.
Performance Audit Services Group achieved a response rate of 62 per cent, up from 59 per cent in 2024–25. The survey result increased from 82 per cent to 86 per cent.
The survey also assessed entities’ overall perception of the value of performance audit services. Overall, 85 per cent of respondents agreed that they valued these services, unchanged from 2024–25.
Performance statements audit services
In 2025–26, the Performance Statements Audit Services Group conducted its first in-house survey of audited entities to assess the value and impact of its work. Covering services delivered during the 2024–25 audit cycle, the survey measured entities’ perceptions of the value of our audit insights, recommendations and contribution to improving performance reporting.
The survey was sent to 58 individuals from 21 entities. Responses were received from 17 individuals representing 12 identified separate entities. This equates to an entity response rate of 57 per cent. Two responses were received from unidentified entities and therefore could not be included in the entity response rate calculation. Overall, 92 per cent of individual respondents agreed that they valued our work.
Reporting mechanism 6
The ANAO’s independent quality assurance program indicates that audit opinions and conclusions are appropriate and support the integrity of our audit reports
Quality in the delivery of our audit services is critical to maintaining confidence in our audit reports and supporting the integrity of our work. This is reflected in the target for reporting mechanism 6.
A key component of our quality management framework is monitoring compliance with the policies and procedures that comprise our system of quality management. Through internal and external quality assurance reviews, we obtain reasonable assurance that audits comply with professional standards and relevant legislative requirements, and that audit reports are appropriate in the circumstances.
In 2025–26, our quality assurance program included reviews of completed and in-progress financial statements, performance and performance statements audits, peer reviews by the New Zealand Office of the Auditor-General, and an internal audit of compliance with selected requirements of the ANAO Audit Manual.
Consistent with our risk-based approach, the program assessed findings relative to the risk of the underlying financial statements item, performance measure or subject matter. Two higher-risk findings were identified but did not affect the supportability of the audit opinions. Remediation procedures were required in two financial statements audits to confirm that audit conclusions were appropriate.
Following review of all remediation work, we were satisfied that the audit conclusions subject to monitoring were appropriate in the circumstances.
Deficiencies and improvement opportunities identified through quality reviews are monitored through follow-up actions. Further information on our quality assurance program, including root cause analysis and improvement initiatives, is provided in the Audit Quality Report 2025–26.
Performance measures 2 to 4
Performance results for Program 1.1: Financial statements audit services
Financial statements provide important information on an entity’s financial performance and position, supporting accountability to ministers, the Parliament and the public. Timely and accurate audited financial statements are also an important indicator of effective financial management.
The Auditor-General is mandated to audit the annual financial statements of all Commonwealth entities and the consolidated financial statements of the Australian Government.
Our financial statements audits provide independent assurance that Australian Government entities’ financial statements comply with the financial reporting framework and accounting standards, and fairly present their financial performance and position. Through this work, we contribute to improvements in public sector financial administration.
We report the results of financial statements audits to the Parliament twice a year through the Interim Report on Key Financial Controls of Major Entities and Audits of the Financial Statements of Australian Government Entities. These reports support accountability and transparency across the Australian Government sector.
To assess performance against our purpose in relation to financial statements audit activities, we measure:
- the percentage of mandated financial statements audit reports issued;
- the percentage of mandated financial statements audit reports issued in time to meet entity annual reporting timeframes; and
- whether the average cost of a financial statements audit does not increase by more than the Consumer Price Index (CPI) from the prior year.
|
Measure 2 |
Percentage of mandated financial statements audit reports issued |
|
|
Source |
ANAO Corporate Plan 2025–26 Portfolio Budget Statements 2025–26, Program 1.1, p. 93 |
|
|
Result |
Achieved a result of 100% against a target of 100% |
MET |
|
124 |
407 |
124 |
The percentage of financial statements auditor’s reports issued is a key measure of the ANAO’s core business in achieving its purpose. During 2025–26, the ANAO completed 100 per cent of the 243 mandated financial statements audits.12 This included the consolidated financial statements of the Australian Government. This reflects the ANAO’s effective delivery of audit work across the full program. The result was supported by early planning, ongoing engagement with entities throughout the audit cycle, and timely resolution of audit matters to enable all audit opinions to be issued.
Details of issues identified during the financial statements audits are included in Auditor-General Report No. 17 2025–26 Audits of the Financial Statements of Australian Government Entities for the Period Ended 30 June 2025.
In addition to the 243 mandated audits, in 2025–26, we also completed 51 financial statements audits under section 20 of the Auditor-General Act 1997.
|
Measure 3 |
Percentage of mandated financial statements audit reports issued in time to meet entity annual reporting timeframes |
|
|
Source |
ANAO Corporate Plan 2025–26 Portfolio Budget Statements 2025–26, Program 1.1, p. 93 |
|
|
Result |
Achieved a result of 81% against a target of 85% |
NOT MET |
|
124 |
407 |
124 |
To support timely reporting of entities’ financial performance to the Parliament through annual reports, the ANAO aims to issue 85 per cent of auditor’s reports within three months of the financial year-end reporting date.13,14
The achievement of this measure relies on entities providing the ANAO auditable financial statements within agreed timeframes. Auditor-General Report No. 17 2025–26 Audits of the Financial Statements of Australian Government Entities for the Period Ended 30 June 2025 includes commentary on aspects of financial statements preparation and the audits thereon, as reflected by:
- the delivery of financial statements to the ANAO in line with agreed timeframes;
- Improvements in entities’ financial statements processes reflected in the number of adjusted and unadjusted audit differences;
- the timeliness of financial statements audits reflected in the proportion of auditor’s reports issued within three months of the end of the reporting period; and
- the proportion of entities that tabled annual reports in advance of supplementary estimates hearings.
Factors that have contributed to this result included delays in the preparation of financial statements by some entities that resulted in delays in the audit process; unplanned staff absences in some audit teams; and changes to planned financial statements signing dates by audited entities.
|
Measure 4 |
Average cost of a financial statements audit does not increase by more than the CPI from the prior year |
|
|
Source |
ANAO Corporate Plan 2025–26 Portfolio Budget Statements 2025–26, Program 1.1, p. 93 |
|
|
Result |
Achieved a result of the average cost of a financial statements audit decreasing by 2% against the CPI rate of 3.7% for that perioda |
MET |
|
124 |
407 |
124 |
Note a: This measure used the CPI rate for the 12 months to February 2026, consistent with the ANAO Performance Reporting Manual and the ANAO’s approach of finalising financial statement audits and performance statement audits performance reporting at the end of quarter 3 where possible.
Note: A revised methodology was introduced for the 2025–26 reporting period for measures 4, 6 and 9, which look at the average costs of the ANAO’s audits. These measures now consider CPI, whereas results reported for these measures in previous years did not apply CPI.
In aggregate, the average cost of a financial statements audit for the 2024–25 audit cycle was $183,557. The average cost in the 2023–24 audit cycle was $187,212, representing a two per cent decrease in 2025–26 (Table 3.5).
The financial statements audit program is delivered through a mix of in-house audits and contracted engagements. For those audits delivered in-house, increased mobility of staff from across the organisation is used to support peak workload periods. The ANAO also uses private sector firms, under the supervision of senior staff at the ANAO, to manage audit delivery in peak workload periods, to support complex engagements, and manage geographic or workload considerations. The reduction in average cost relative to 2024–25 reflects the continued drive for efficiencies across in-house audits through more structured risk-based approaches to align audit effort with areas of highest risk and value. In the prior year, several audits incurred higher costs due to complex audit matters, and in 2025–26 their costs returned to expected levels. These cost efficiencies were partly offset by increased cost pressures associated with audits contracted to private sector firms, reflecting higher supplier rates and changes in audit mix and complexity.
The ANAO is continuing to focus on reducing effort in lower-risk areas to avoid over auditing, while maintaining audit quality and efficiency. Other initiatives include development of more streamlined audit approaches, increased standardisation of workpapers and methodologies, and productivity gains arising from greater team continuity and experience.
Table 3.5: Average cost of financial statements audits — 2022–23 to 2024–25 audit cycles
|
Audit cyclea |
Percentage increase target (%) |
Average cost per mandated audit ($)b |
Actual result (%)c |
|
2024–25 |
0 |
183,557 |
−2 |
|
2023–24 |
0 |
187,212 |
+6 |
|
2022–23 |
0 |
176,842 |
+4 |
Note a: Audit cycle refers to the year of the entity’s financial statements — so the 2024–25 audit cycle concerns audits of entities’ 2024–25 financial statements completed by the ANAO in the 2025–26 financial year. Please note, a small number of audits follow the calendar year rather than the financial year, so have December year ends.
Note b: Cost is calculated on a nominal cost recovery basis using an accrual-based costing model.
Note c: From 2025–26, the performance measure assesses the annual percentage change in average cost per performance audit after adjusting for CPI. Results for earlier years are not presented on this basis.
Performance measures 5 and 6
Performance results for Program 1.2: Performance audit services
We conduct performance audits to support parliamentary scrutiny and identify opportunities to improve public administration. Performance audits are tabled in the Parliament and provide independent assurance on the administration of Australian Government programs and activities.
In 2025–26, our audit program focused on areas of significant public expenditure, delivery risk and parliamentary interest. We also piloted four rapid engagement approaches, three of which are included in the 39 performance audits tabled in 2025–26 and published three Insights products to share lessons and better practice across the public sector.
To assess performance against our purpose in relation to performance audit activities, we measure:
- the number of performance audits presented to the Parliament;
- whether the average cost of a performance audit does not increase by more than the Consumer Price Index (CPI) from the prior year; and
- the percentage of recommendations agreed to, and their implementation status.
|
Measure 5 |
Number of performance audit reports and related products presented to the Parliament or published by the Auditor-General |
|
|
Source |
ANAO Corporate Plan 2025–26 Portfolio Budget Statements 2025–26, Program 1.2, p. 94 |
|
|
Result |
Achieved 39 audit reports against a target range of 38 to 42 audit reports and delivered all required additional outputs (1 Major Projects Report and 3 Insights). |
MET |
|
124 |
407 |
124 |
In 2025–26, the Auditor-General presented 39 performance audits for tabling in the Parliament (Table 3.6) against a target range of 38 to 42 performance audits.
In addition to the 39 performance audits tabled in the Parliament, Auditor-General Report No. 16 2025–26 2024–25 Major Projects Report was tabled in December 2025. This was the final report in that series, concluding an 18-year program of assurance reviews of Defence specialist military equipment acquisitions.15 In 2025–26, we also published three Insights products:
- Fraud and Corruption Control Arrangements;
- Official Travel; and
- Information-gathering, Confidentiality and Reporting.
Further, the ANAO presented two other reports for tabling in the Parliament:
- Auditor-General Report No. 4 2025–26 2024–25 Performance Audit Outcomes included an analysis of performance audits from 2020–21 to 2024–25 and the key themes from the 44 performance audits tabled in 2024–25; and
- Auditor-General Report No. 36 2025–26 Australian National University Financial Management examined the university’s financial management arrangements, providing transparency through independent analysis, findings and recommendations.
The number of performance audits delivered in a given year is influenced by the composition, scale and timing of the audit program, together with the availability and allocation of audit resources. In 2025–26, delivery reflected the complexity of audits undertaken and the coordination required to finalise reports for tabling, while concurrently trialling innovative approaches to how the ANAO delivers its program. Program delivery also occurred within a constrained funding environment, characterised by ongoing cost pressures and increasing demand for audit services. Within available resources, these pressures have required a continued focus on efficiency and are reflected in the lower performance audit target for 2025–26 compared to prior years. Future audit delivery will continue to be influenced by these factors and is managed through program planning, flexible scheduling and ongoing governance oversight.
Table 3.6: Number of performance audit reports, 2023–24 to 2025–26
|
Year |
Target |
Result |
|
2025–26 |
Target range of 38 to 42 |
39 |
|
2024–25 |
48 |
44 |
|
2023–24 |
45 |
45 |
|
Measure 6 |
Average cost of a performance audit does not increase by more than the CPI from the prior year |
|
|
Source |
ANAO Corporate Plan 2025–26 Portfolio Budget Statements 2025–26, Program 1.2, p. 94 |
|
|
Result |
Achieved a result of the average cost of a performance audit increasing by 6% against the CPI rate of 4% for that perioda |
NOT MET |
|
124 |
407 |
124 |
Note a: This measure used the CPI rate for the 12 months to May 2026, as the performance audit tabling program continues through to the end of the financial year.
The average cost of audits delivered in 2025–26 was six per cent higher than the prior year. After adjusting for CPI, the increase was two per cent (Table 3.7). This largely reflects the composition of the audit program, audits involving major Defence capability and sustainment projects, large-scale government service delivery programs, and cross-entity policy and governance initiatives.
The cost of a performance audit is calculated based on the hours worked by staff, using ANAO defined charge-out rates for each APS classification level, along with other direct costs such as travel or contracted services. Charge-out rates include both staff costs and the overhead costs required to support audit delivery.
From 2025–26, this measure assesses changes in average audit cost after adjusting for CPI. This recognises changes in audit costs by accounting for inflationary pressures, including increases in staff charge-out rates, travel or contracted services that may occur independently of changes in audit effort or complexity.
The ANAO’s average cost measure is sensitive to the composition and scale of the audit program in a given year. In years where the number of audits is lower, or where a greater proportion of audit effort is directed to larger or more complex audits, the average cost may increase accordingly. This may result in variability in the reported outcome from year to year, even where overall audit effort and budget settings are managed within agreed parameters. Over the 2026–27 program, the ANAO plans to undertake an increased number of smaller audits and has also recently introduced rapid engagements which offer a shorter, timelier product suited to particular topics.
Table 3.7: Average cost of performance audits — 2023–24 to 2025–26
|
Year of audit |
Percentage increase target (%) |
Average cost per audit ($)a |
Actual result (%)b |
|
2025–26 |
0 |
603,000 |
+2 |
|
2024–25 |
0 |
571,000 |
+15 |
|
2023–24 |
0 |
496,000 |
−5 |
Note a: Cost is calculated on a nominal cost recovery basis using an accrual-based costing model and is rounded to the nearest thousand dollars.
Note b: From 2025–26, the performance measure assesses the annual percentage change in average cost per performance audit after adjusting for CPI. Results for earlier years are not presented on this basis.
Performance measures 7 to 9
Performance results for Program 1.3: Performance statements audit services
On 2 July 2024, the Minister for Finance requested that the Auditor-General undertake assurance audits of 21 entities’ 2024–25 performance statements. We completed all 21 audits under the Auditor-General Act 1997, and the Minister for Finance tabled the audit reports in the Senate on 4 December 2025.
To assess performance against our purpose in relation to performance statements audit activities, we measure:
- the number of performance statements audit reports issued;
- the percentage of performance statements audit reports issued in time to meet entity annual reporting timeframes; and
- whether the average cost of a performance statements audit does not increase by more than the Consumer Price Index (CPI) from the prior year.
|
Measure 7 |
Percentage of performance statements audit reports issued |
|
|
Source |
ANAO Corporate Plan 2025–26 Portfolio Budget Statements 2025–26, Program 1.3, p. 95 |
|
|
Result |
Achieved a result of 100% against a target of 100% |
MET |
|
124 |
407 |
124 |
During 2025–26, the ANAO completed 100 per cent of the 21 entity 2024–25 performance statements audits that were requested by the Minister for Finance as part of the annual performance statements audit program.
Details of the lessons identified during the performance statements audits are included in Auditor-General Report No. 22 2025–26 Performance Statements of Major Australian Government Entities — Outcomes from the 2024–25 Audit Program.
|
Measure 8 |
Percentage of performance statements audit reports issued in time to meet entity annual reporting timeframes |
|
|
Source |
ANAO Corporate Plan 2025–26 Portfolio Budget Statements 2025–26, Program 1.3, p. 95 |
|
|
Result |
Achieved a result of 48% against a target of 100% |
NOT MET |
|
124 |
407 |
124 |
The ANAO aims to issue performance statements audit reports within three months of the end of the financial year. While including audited annual performance statements in annual reports to the Parliament is not a mandatory requirement for entities under the PGPA Act, the timely completion of audit reports encourages this practice.
In 2025–26, 10 audit reports were issued within three months of the end of the financial year, representing 48 per cent of the program. Reports for the remaining 11 entities were issued outside this timeframe. Three audit reports were finalised within seven days of the reporting deadline, and all audits were finalised by the end of October 2025.16
Achievement of this measure relies on entities providing the ANAO with auditable and signed annual performance statements within the required timeframe. Delays in the provision of auditable statements by some entities, together with challenges in obtaining sufficient and appropriate audit evidence, affected the timely completion of audit procedures across the program. These factors had the greatest impact on the audits of the Department of Home Affairs, the National Disability Insurance Agency and the National Indigenous Australians Agency, contributing to the late issuance of audit reports for those entities.
The 2024–25 audit cycle also included seven entities being audited for the first time, representing a 50 per cent expansion of the program compared to 2023–24. This significant increase required a substantial uplift in ANAO capability and capacity, placing pressure on available resourcing and affecting planned audit timeframes across the program. These pressures were particularly evident in the audits of the Department of Home Affairs, Department of Health, Disability and Ageing, Department of Employment and Workplace Relations and Department of Agriculture, Fisheries and Forestry audits.
In addition, the accountable authorities of the Department of Social Services and the Department of Defence planned to sign their 2024–25 performance statements after 30 September, with the ANAO meeting the adjusted timeframes set by the entities.
The ANAO is continuing to improve the efficiency of its audit processes, including through refinements to audit methodology and planning, which is expected to support more timely completion of audits in future cycles.
|
Measure 9 |
Average cost of a performance statements audit does not increase more than the CPI from the prior year |
|
|
Source |
ANAO Corporate Plan 2025–26 |
|
|
Result |
Achieved a result of the average cost of a performance statements audit decreasing by 17% against the CPI rate of 3.7% for that perioda |
MET |
|
124 |
407 |
124 |
Note a: This measure used the CPI rate for the 12 months to February 2026, consistent with the ANAO Performance Reporting Manual and the ANAO’s approach of finalising financial statement audits and performance statement audits performance reporting at the end of quarter 3 where possible.
The average cost of a performance statements audit in the 2024–25 cycle was $510,401. The average cost in the 2023–24 cycle was $615,849, representing a 17 per cent reduction in 2025–26 (Table 3.8).
Factors that contributed to the reduction in the average cost of an audit in the 2024–25 audit cycle included:
- Repeat audits — Fourteen of the 21 audits were repeat engagements, including 10 entities audited for a third time in 2025–26. Increased familiarity with entities, their corporate plans and performance measures reduced the time required for audit planning, particularly when there were no material changes from the prior year. This improved efficiency and reduced overall audit hours.
- More mature methodology — While the performance statements audit program continues to evolve, the methodology is now more established than in earlier cycles, enabling more consistent and efficient application of risk-based auditing by audit teams.
- Uplift in entity maturity — To support the embedding of better practice in performance statements preparation, the ANAO has developed a maturity assessment model to assist entities in presenting statements that are meaningful for readers. In 2025–26, average maturity levels increased across all five categories of the model compared to the previous year. This uplift in entity capability — reflected in stronger processes, controls and documentation — reduced the level of audit effort required, supporting more efficient audit delivery.17
Table 3.8: Average cost of performance statements audits — 2022–23 to 2024–25 audit cycles
|
Audit cyclea |
Percentage increase target (%) |
Average cost per audit cycle ($)b |
Actual result (%)c |
|
2024–25 |
0 |
510,401 |
−17 |
|
2023–24 |
0 |
615,849 |
+14 |
|
2022–23 |
0 |
539,253 |
−18 |
Note a: Audit cycle refers to the year of the entity’s performance statements — so the 2024–25 audit cycle concerns audits of entities’ 2024–25 performance statements completed by the ANAO in the 2025–26 financial year.
Note b: Cost is calculated on a nominal cost recovery basis using an accrual-based costing model.
Note c: From 2025–26, the performance measure assesses the annual percentage change in average cost per performance audit after adjusting for CPI. Results for earlier years are not presented on this basis.
Looking ahead, the ANAO will continue to mature its risk-based approach to performance statements auditing by further targeting audit effort to the measures, systems and controls that matter most to the quality and usefulness of entity performance information. As entity capability improves and audit knowledge deepens, greater use of prior year insights, maturity assessments and risk indicators will enable more proportionate audit planning and effort, earlier risk identification and stronger entity readiness. Over time, this should support a more sustainable and cost-effective audit program, lift the quality of performance statements and strengthen the assurance and insight available to the Parliament and the public.
4. Report on financial performance
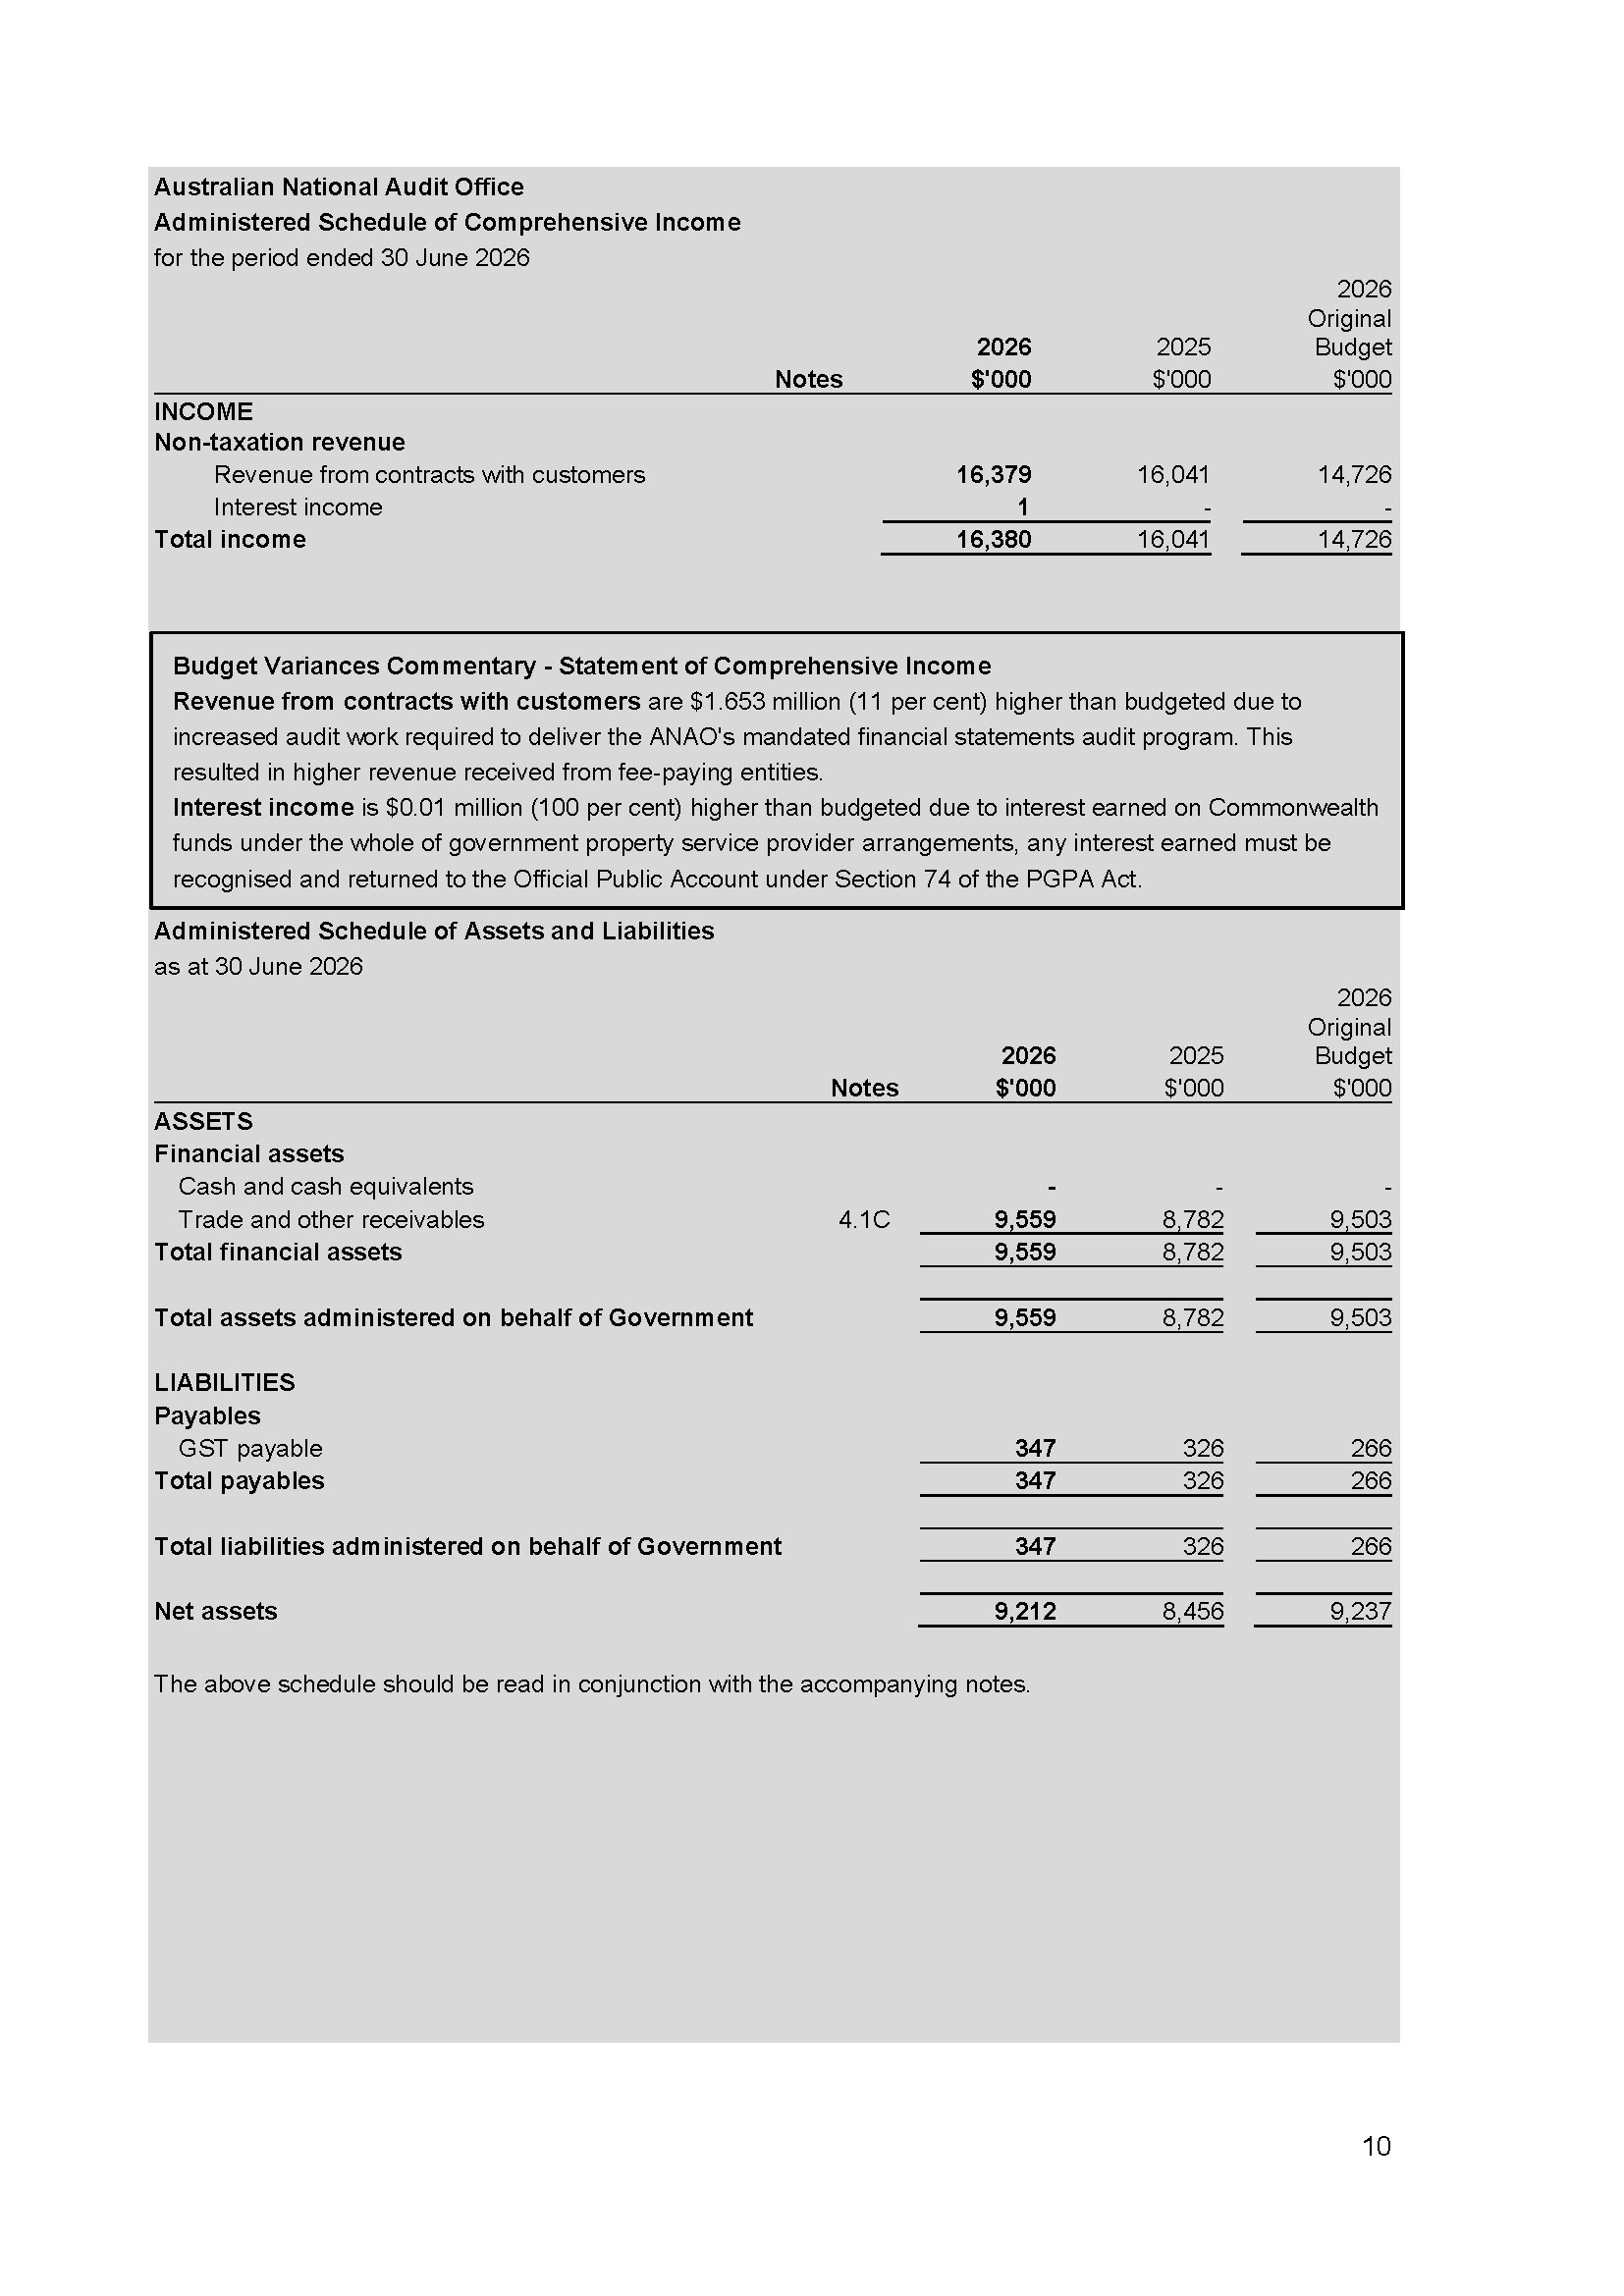
The ANAO is funded largely by government appropriation, with a small amount of revenue generated from audit fees paid by audited entities for audits by arrangement under section 20 of the Auditor-General Act 1997. Audit fees are set to recover the expenses incurred to undertake audits under section 20.
Overview of financial performance
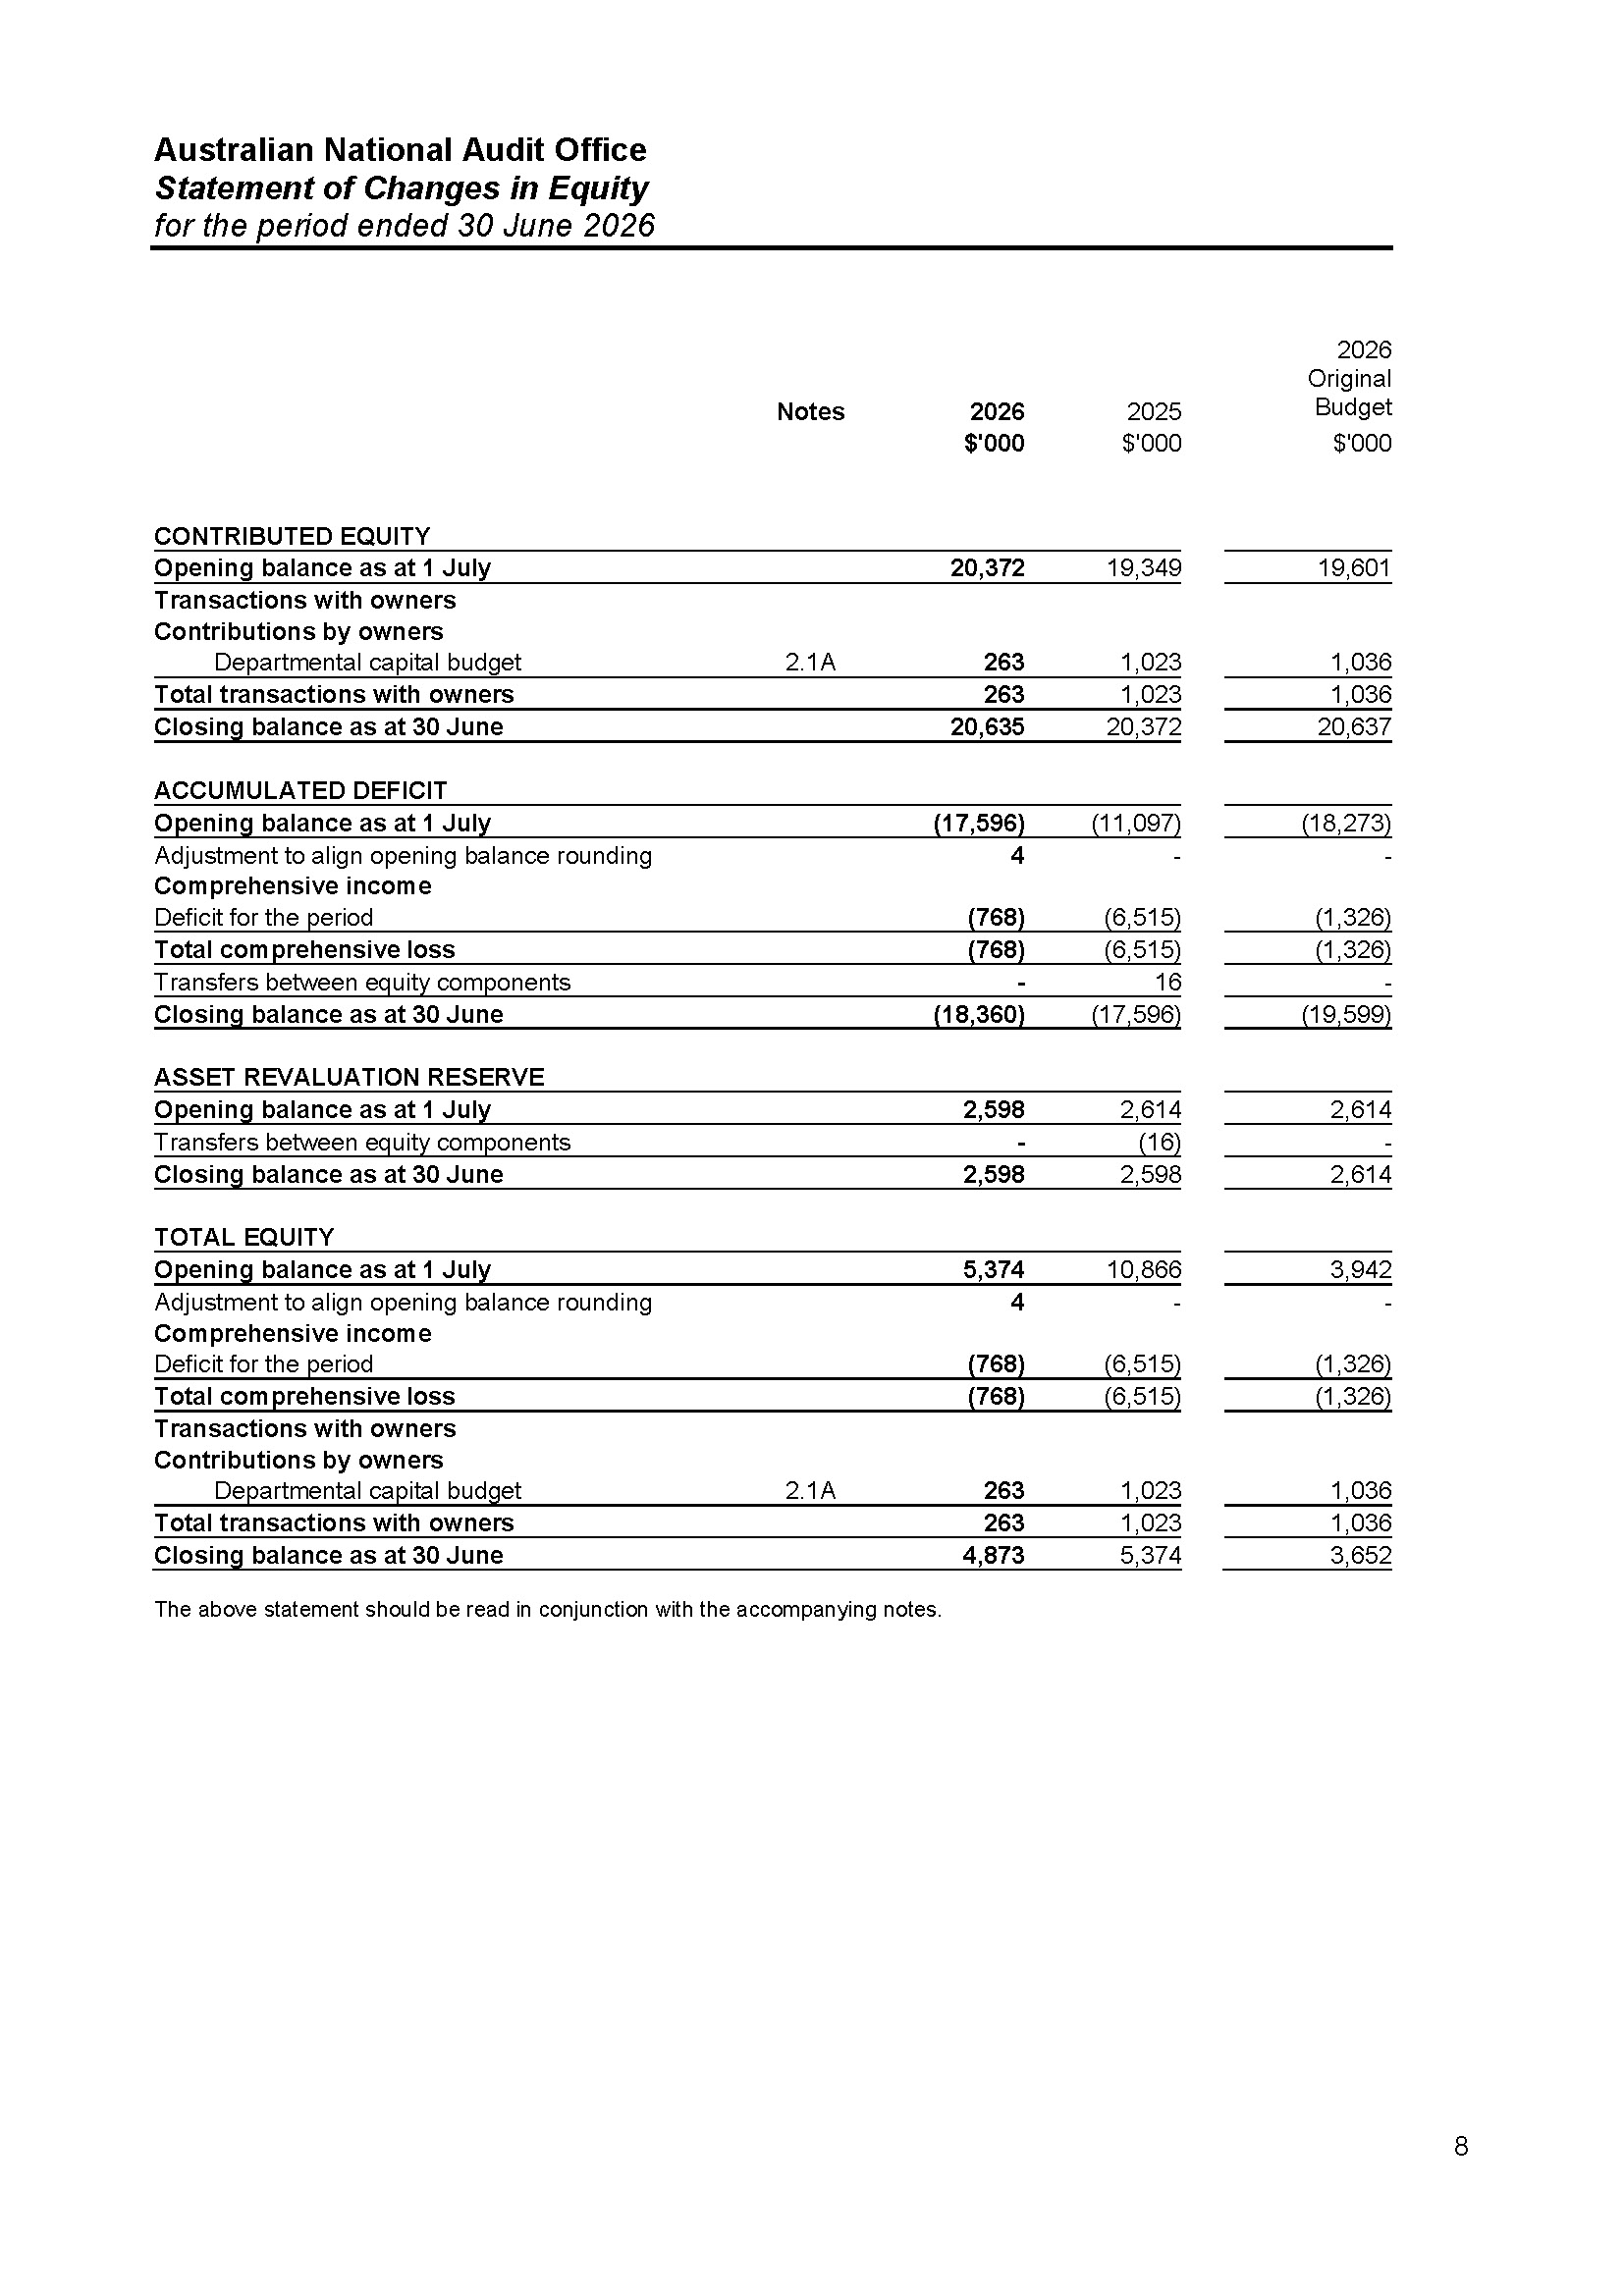
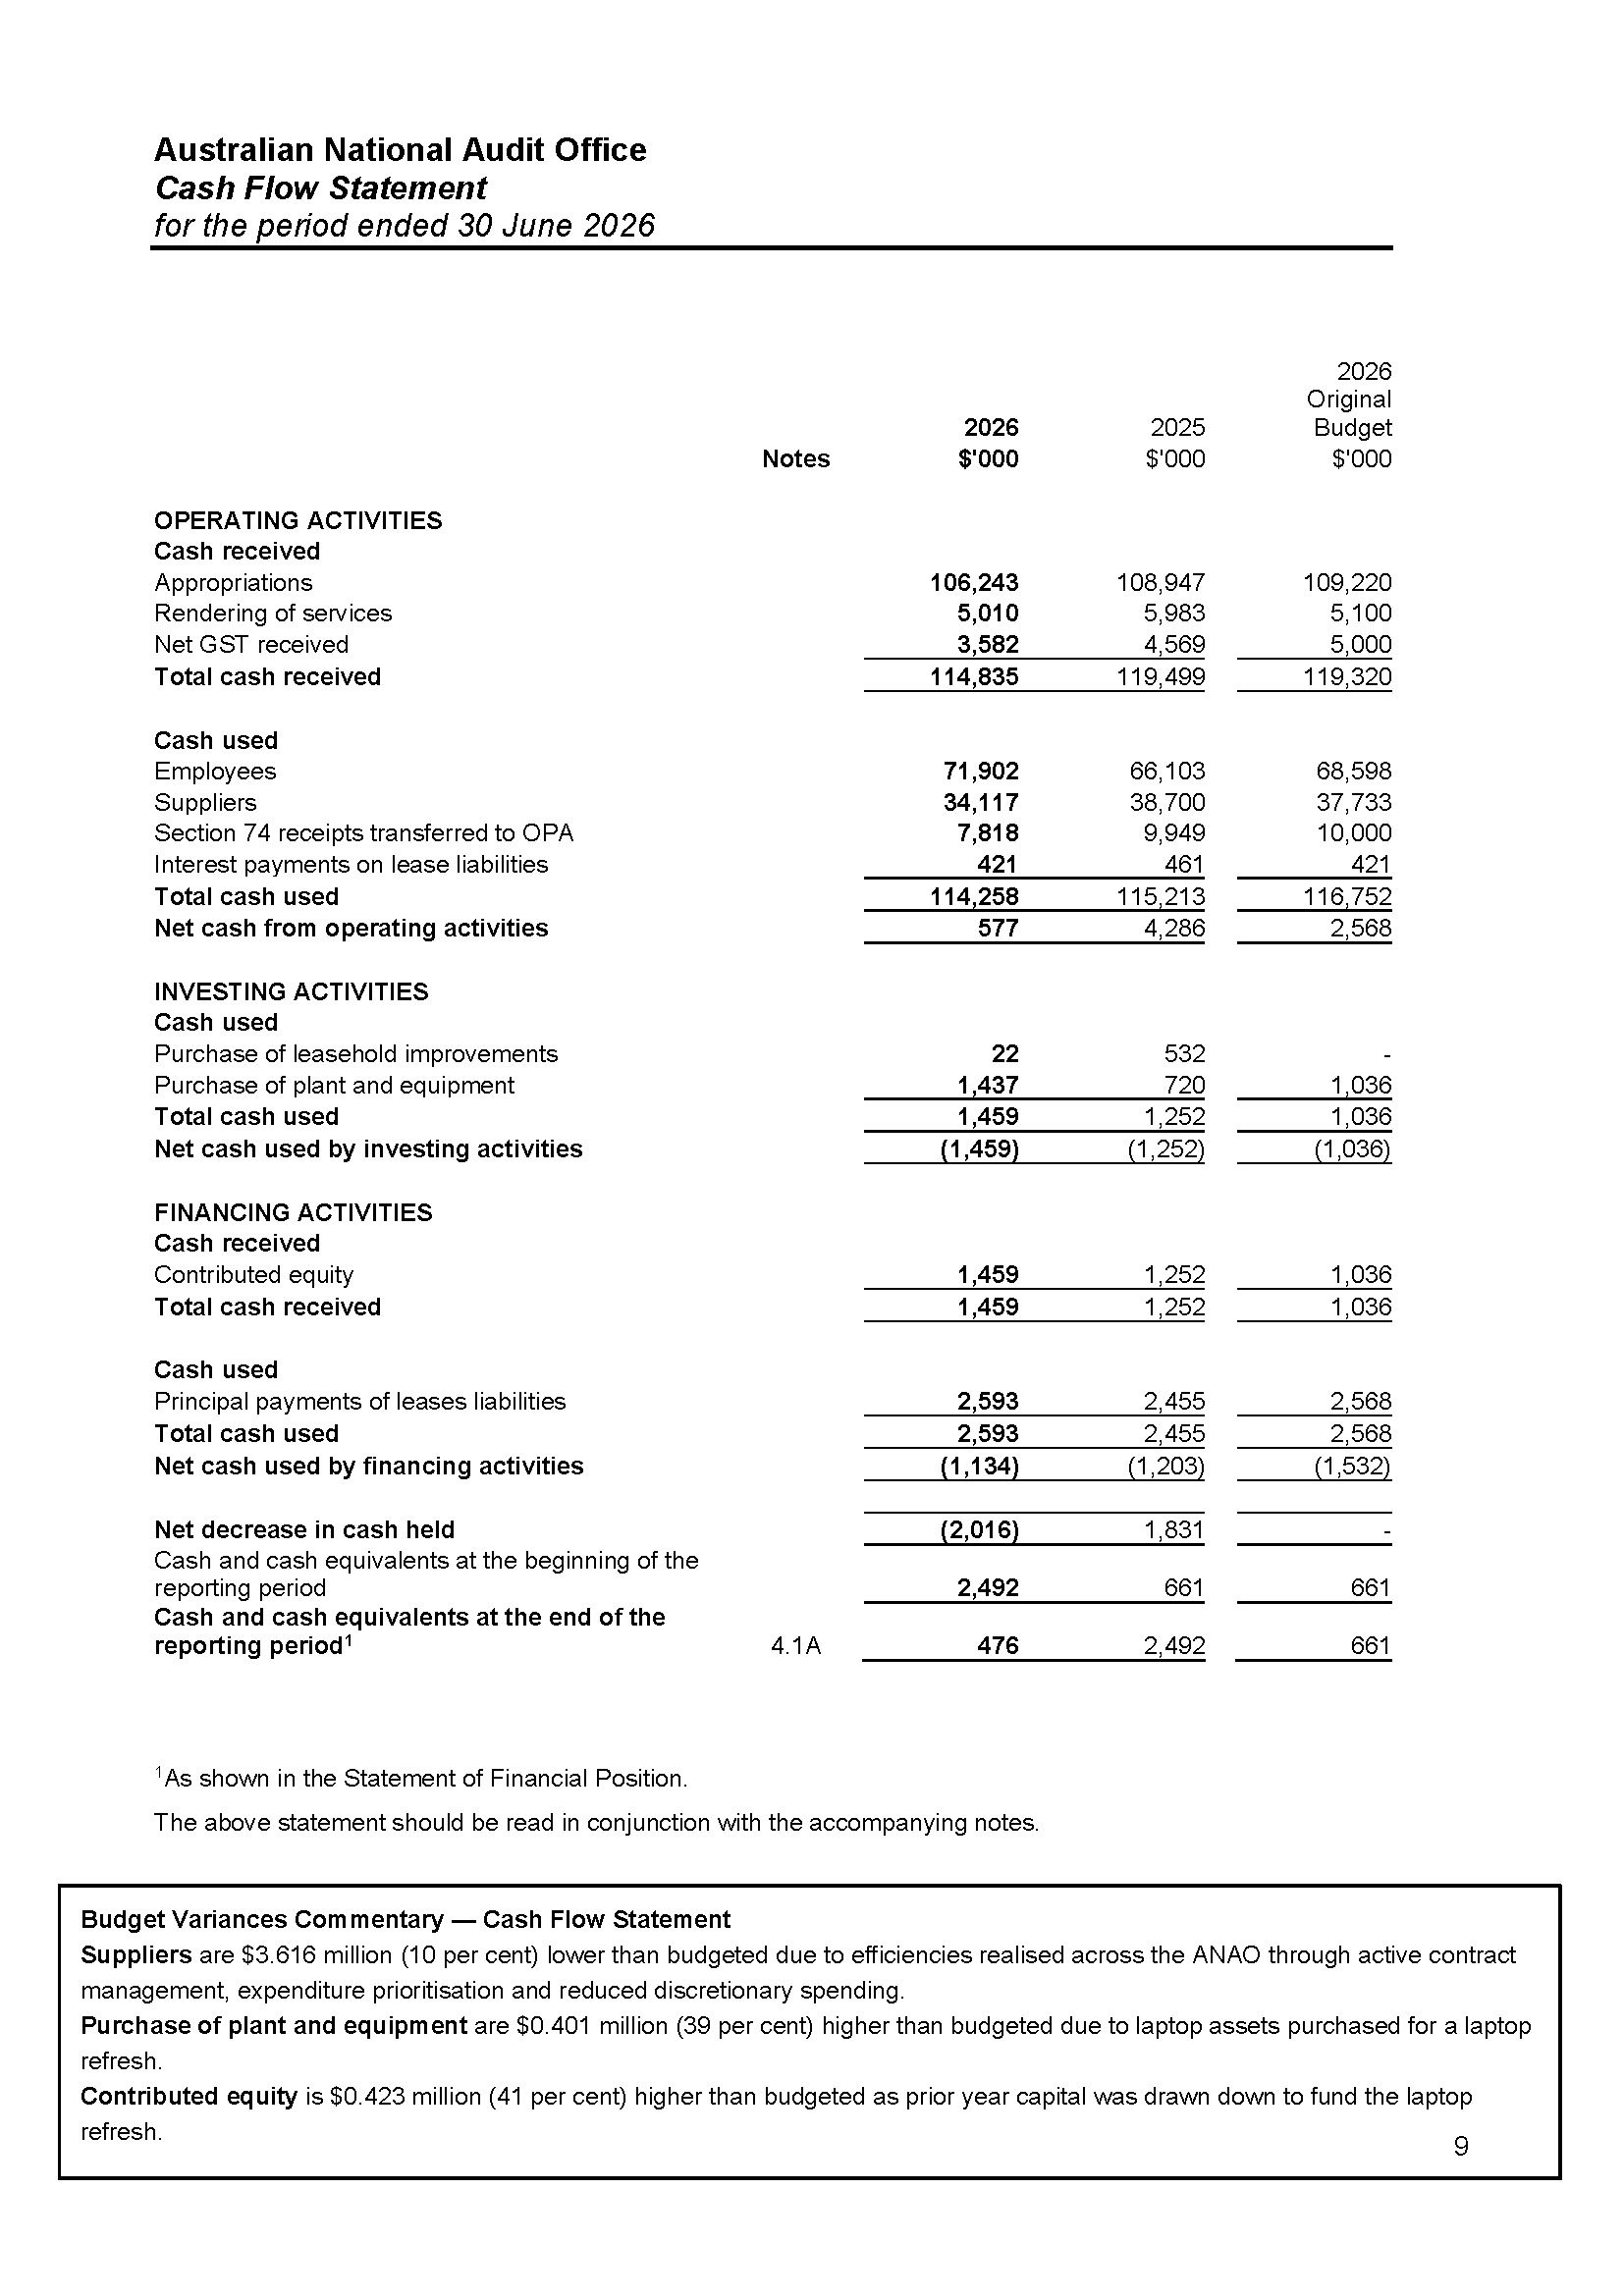
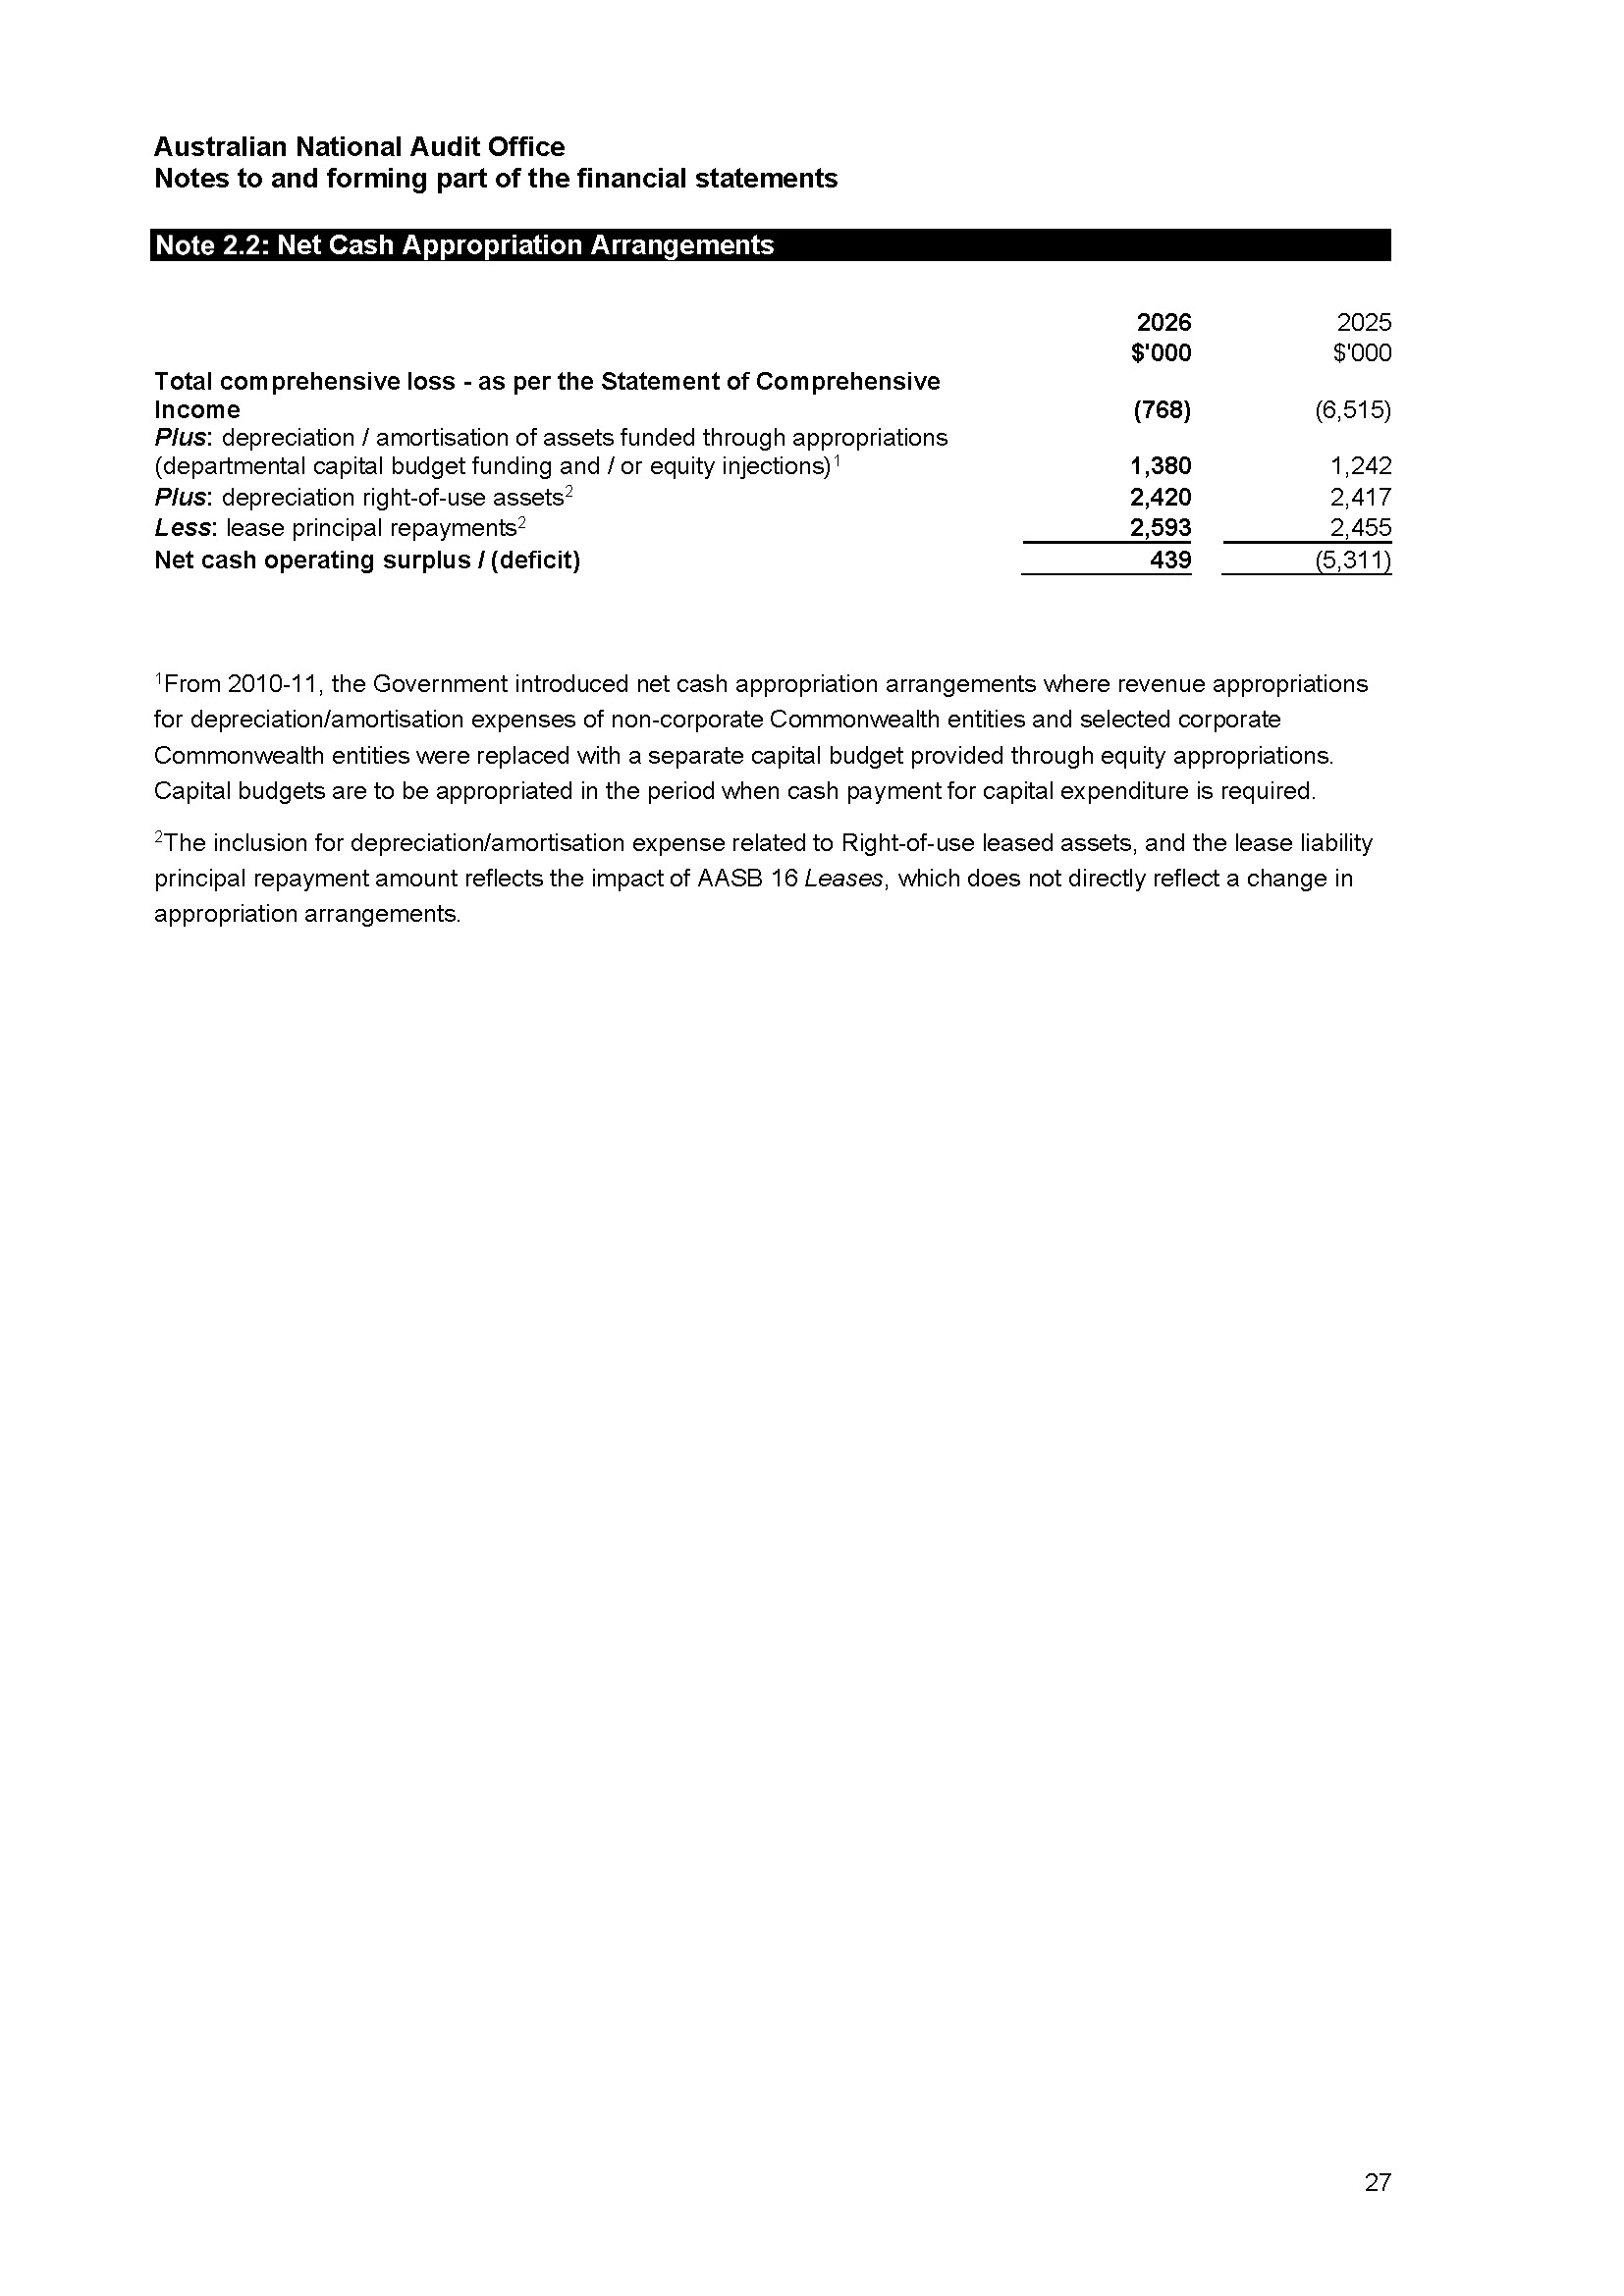
The ANAO reported an operating deficit of $0.768 million in 2025–26, compared to an operating deficit of $6.515 million in 2024–25. Excluding the impact of depreciation and amortisation, and adjusting for lease principal repayments, the ANAO had a cash net operating surplus of $0.439 million.
The ANAO had sought approval from the Finance Minister for a forecast operating loss of $6.5 million to meet cost pressures for the 2025–26 financial year. A range of savings and efficiency measures were implemented across the year that reduced the deficit, relative to that forecast.
Expense impacts
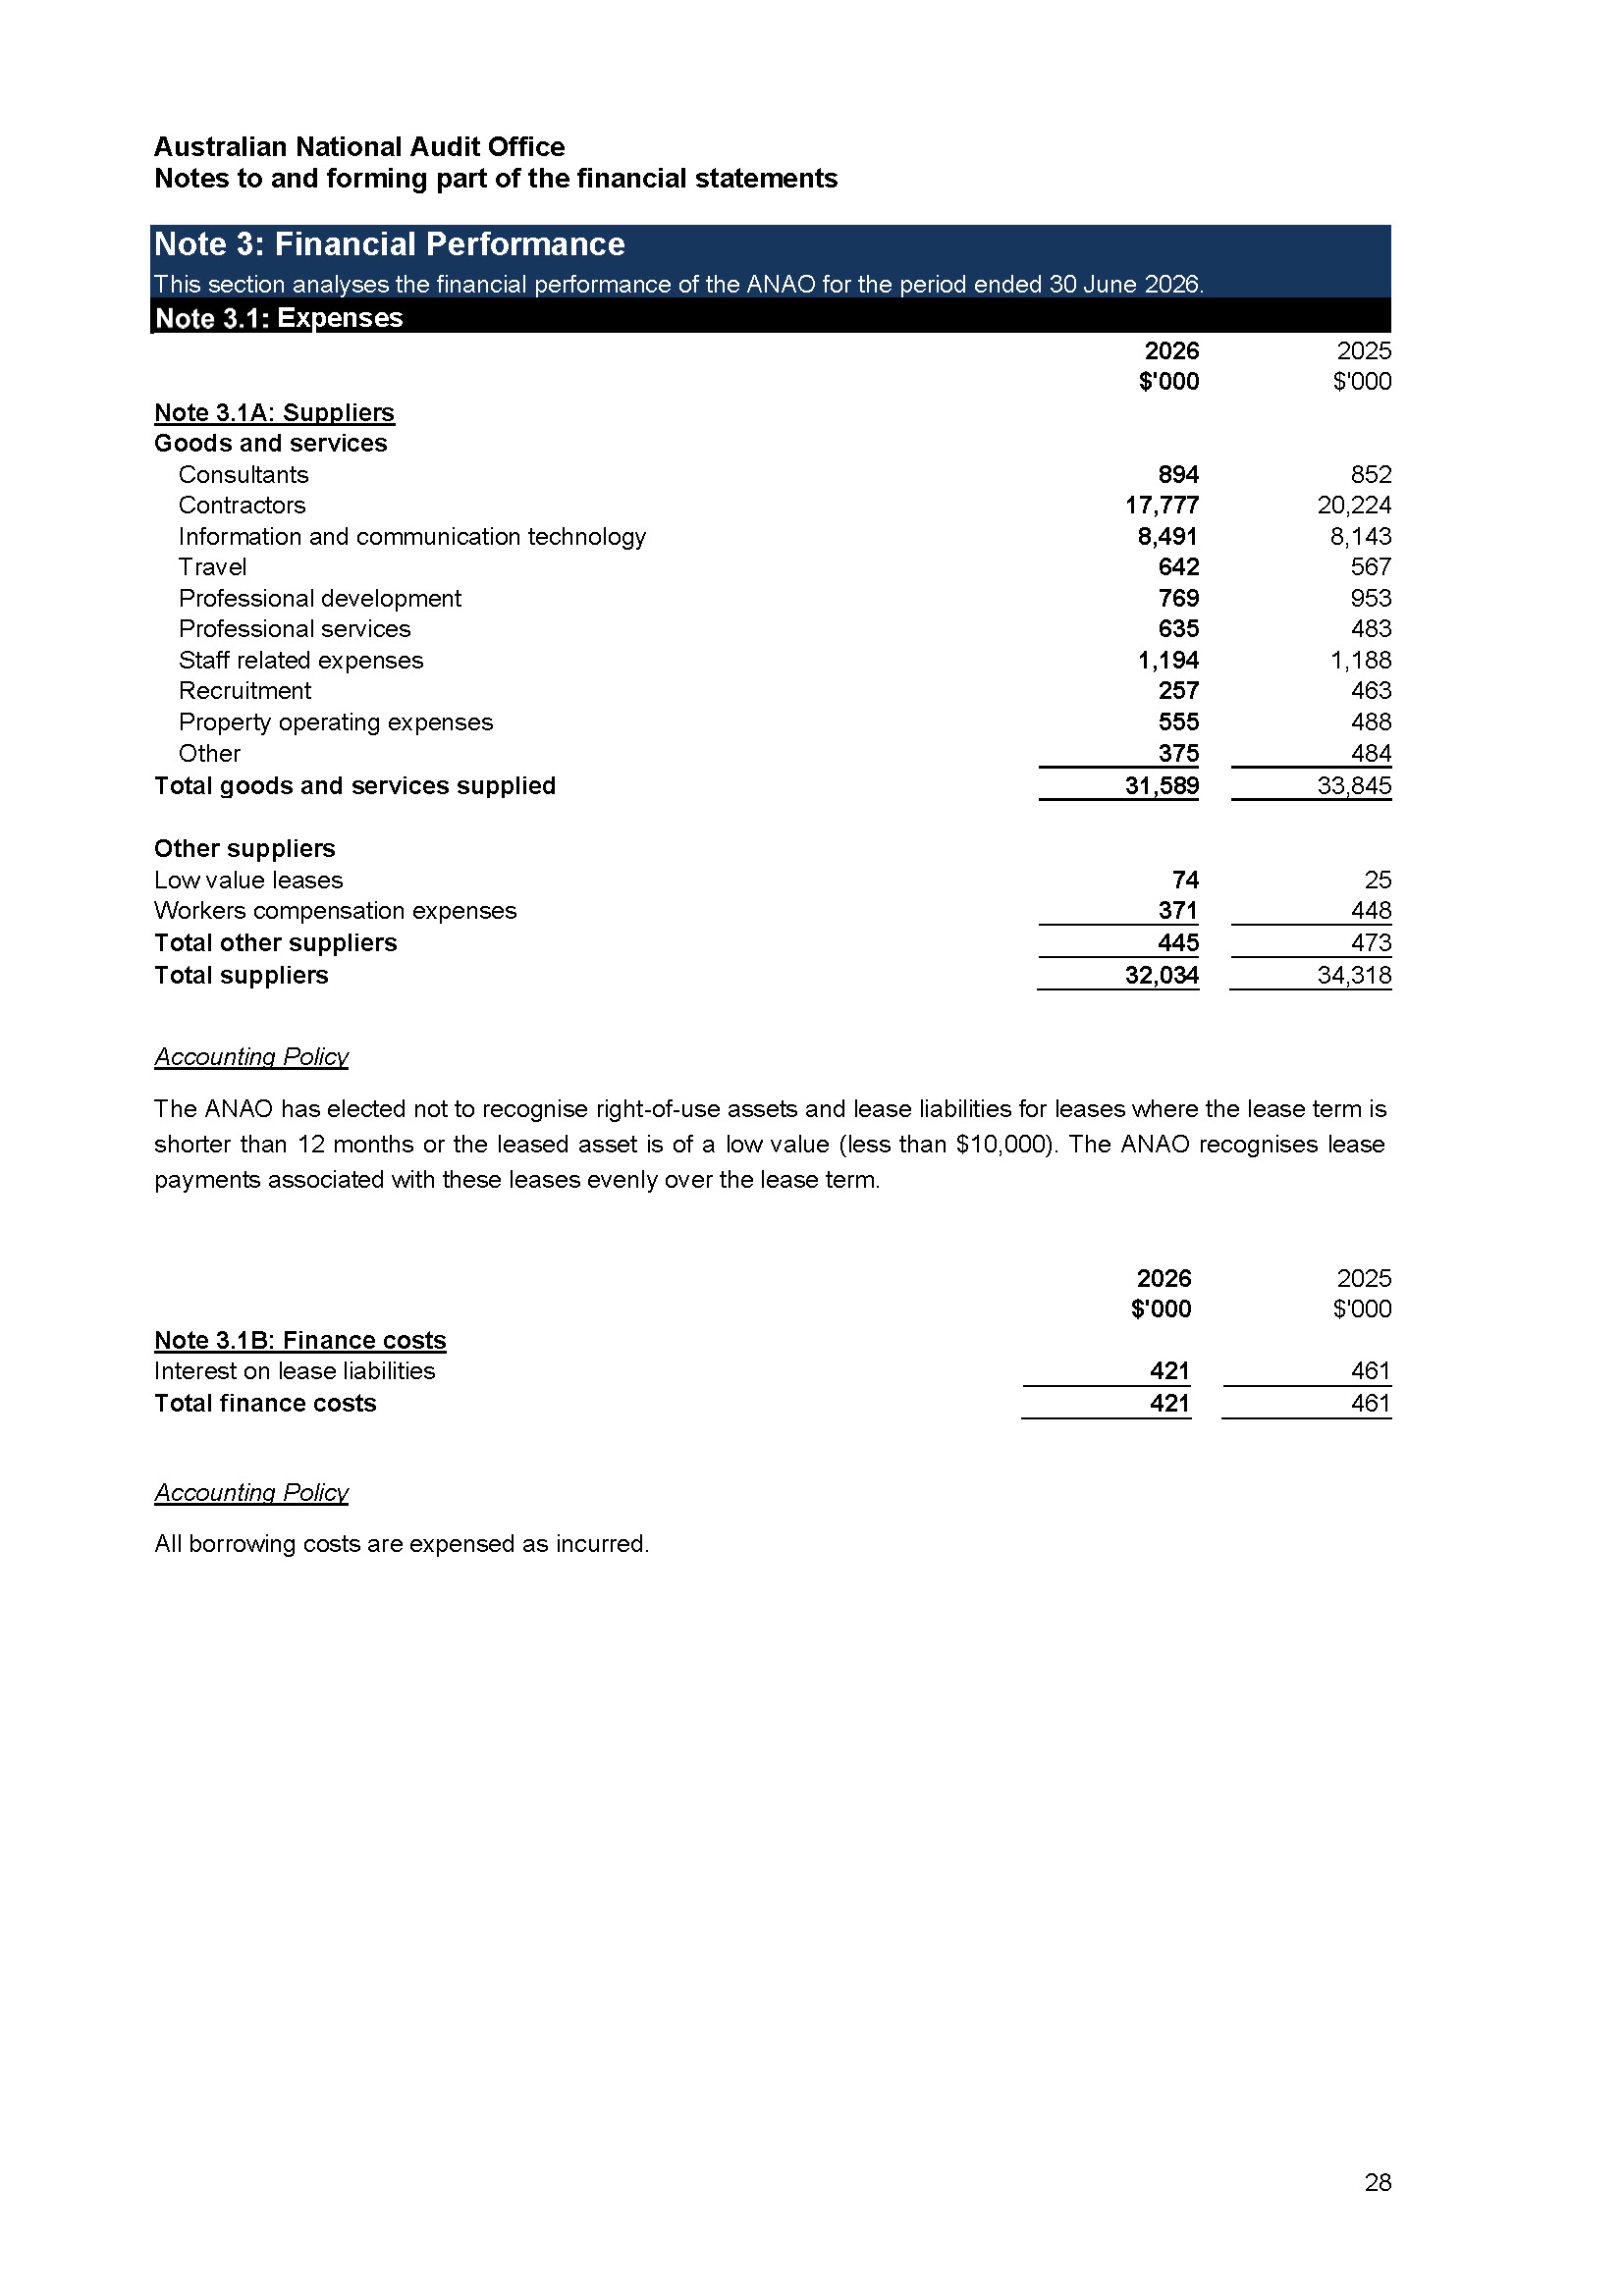
The ANAO spends 67 per cent of its budget on employee-related expenses and 18 per cent on contractors and consultants. The ANAO uses private sector audit firms to undertake audits of entities within and outside of Canberra. These firms assist the ANAO to finalise the audit of all Commonwealth entity financial statements and the annual Australian Government consolidated financial statements in a timely manner and to the quality standards required. All audit opinions and signing responsibilities remain with the Auditor-General, and senior ANAO staff maintain appropriate oversight and quality assurance processes over these audits.
Where required, the ANAO engages contractors and consultants, such as valuers and actuaries, to provide expertise required to complete the audit program. The ANAO outsources the delivery of information technology services to a managed service provider, with total IT costs, including the managed service provider contract, accounting for eight per cent of ANAO expenses.
The ANAO’s total expenses for 2025–26 were $106.3 million, compared to $108.6 million in 2024–25, a decrease of $2.3 million.
Financial position
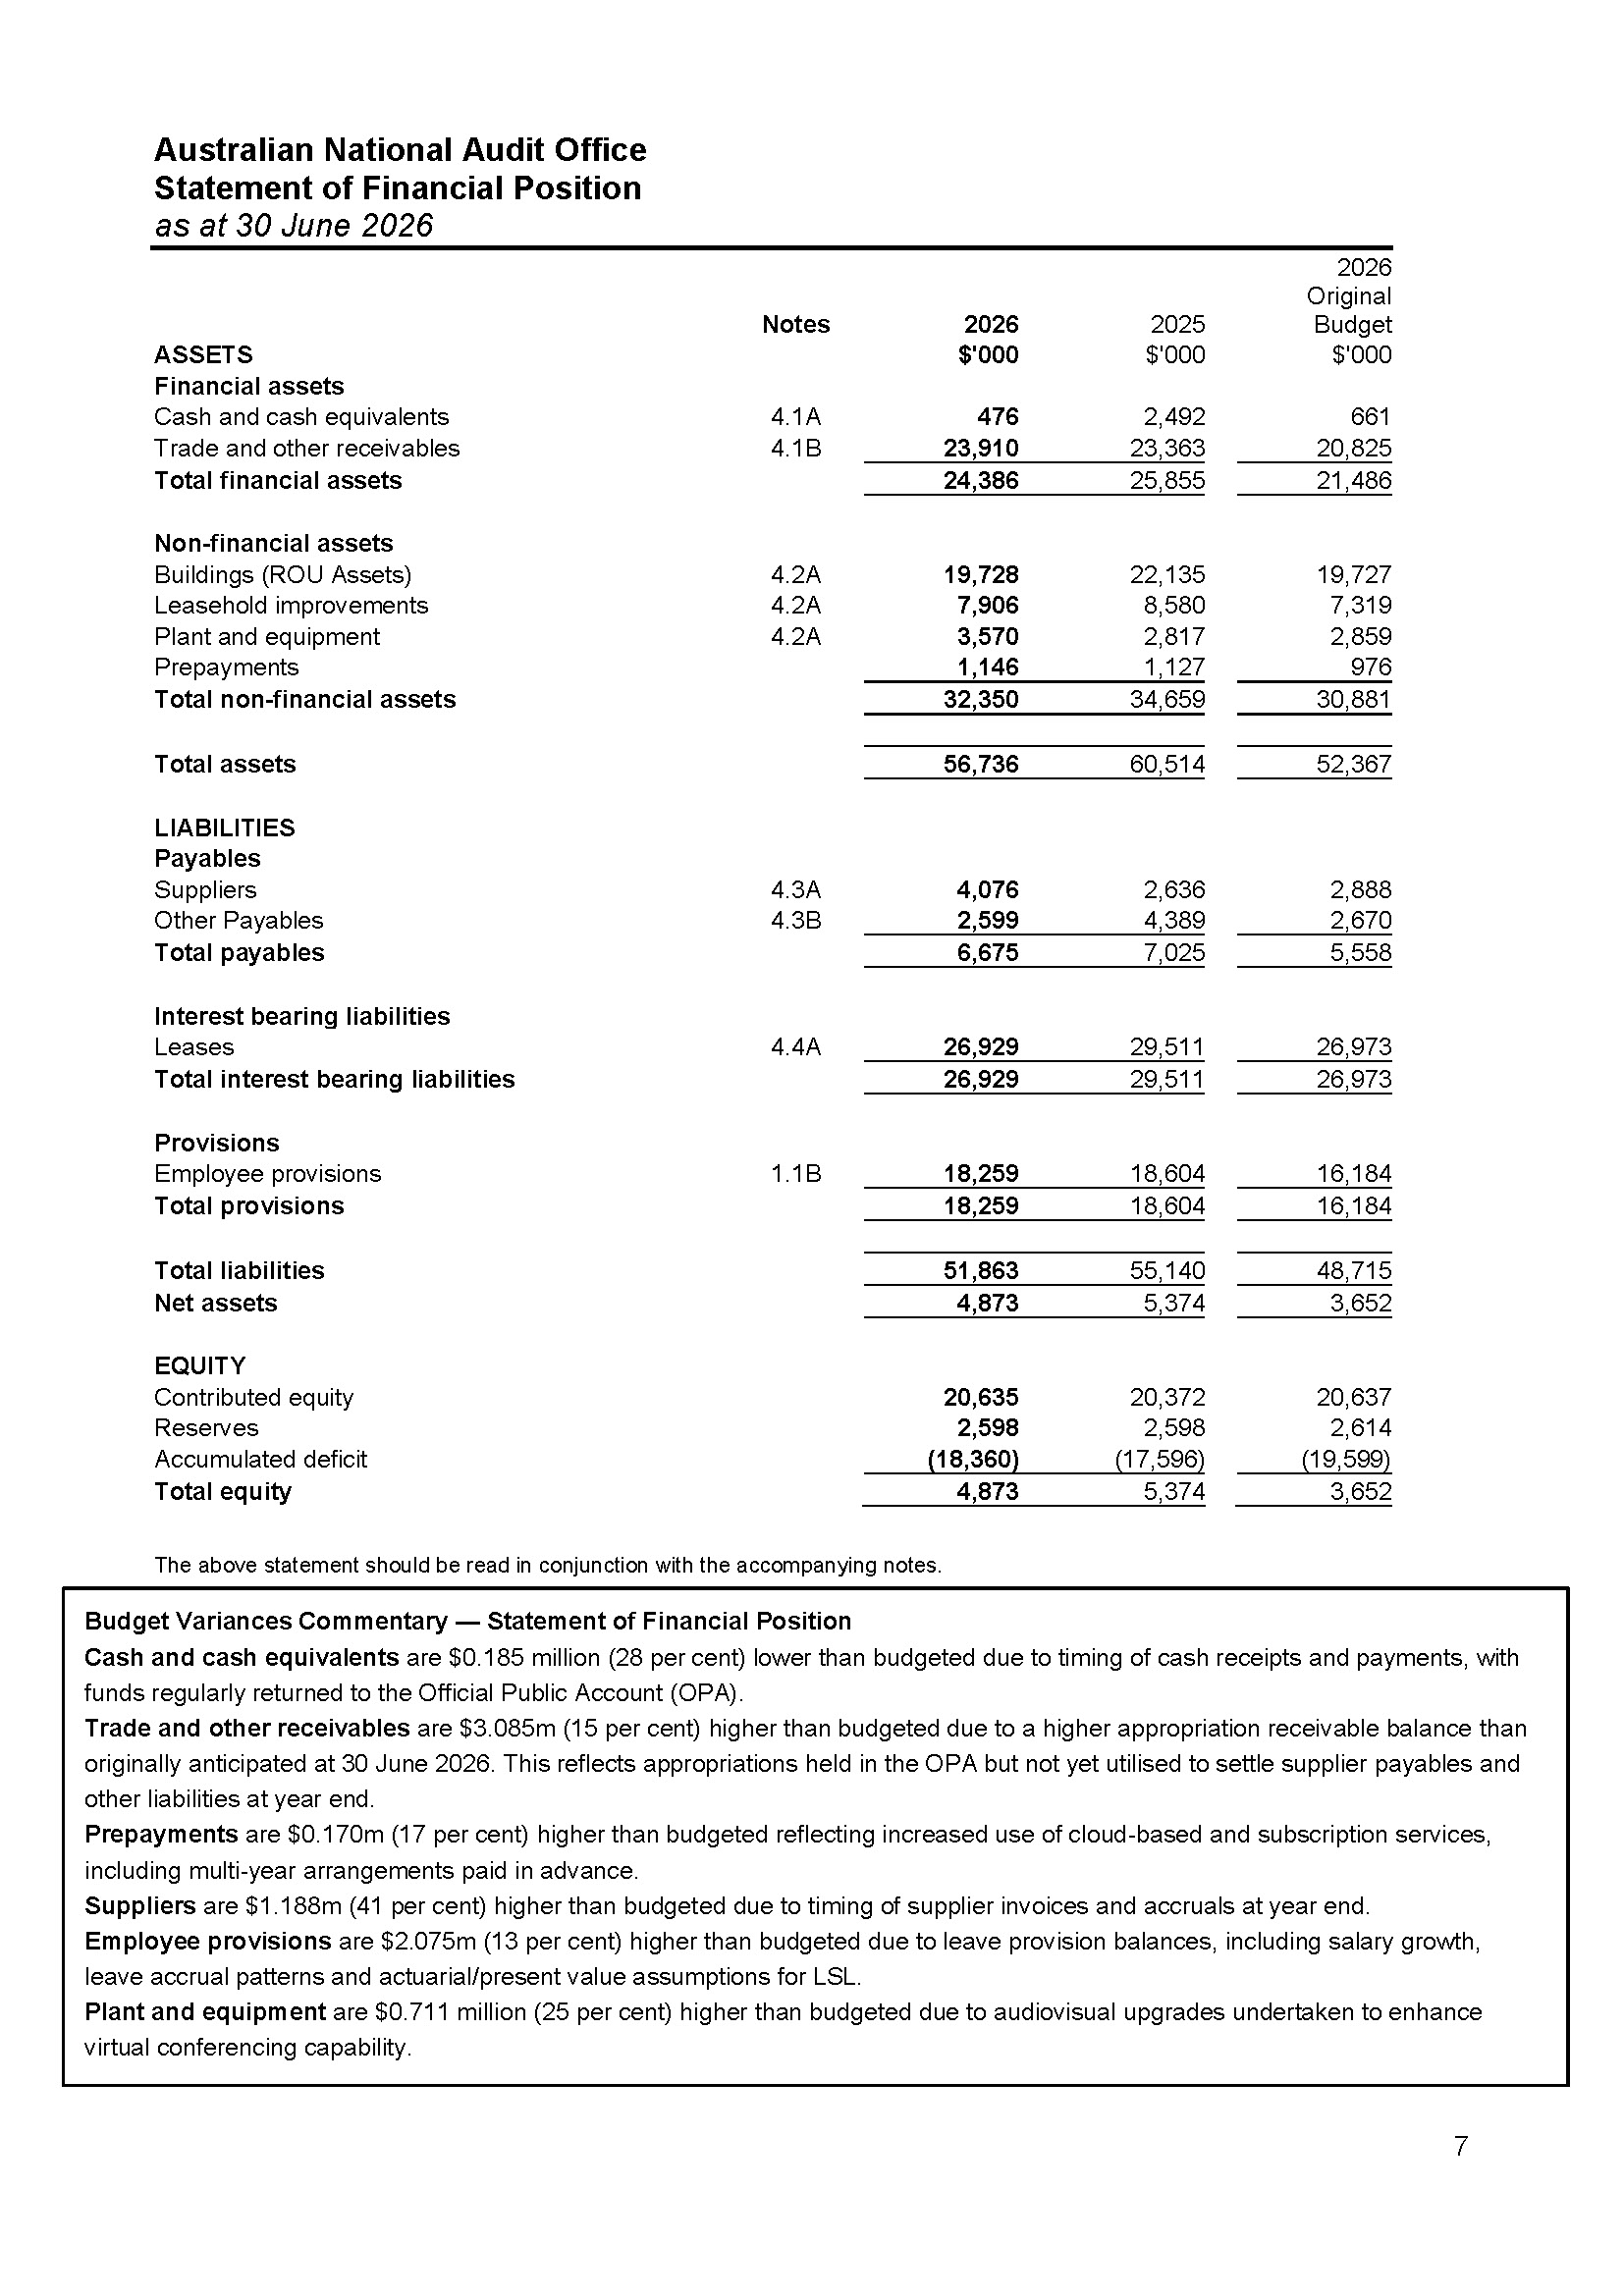
The ANAO’s overall financial position as at 30 June 2026 is shown in Table 4.1: total assets reduced as at 30 June 2026 to $56.736 million; and total liabilities reduced to $51.863 million.
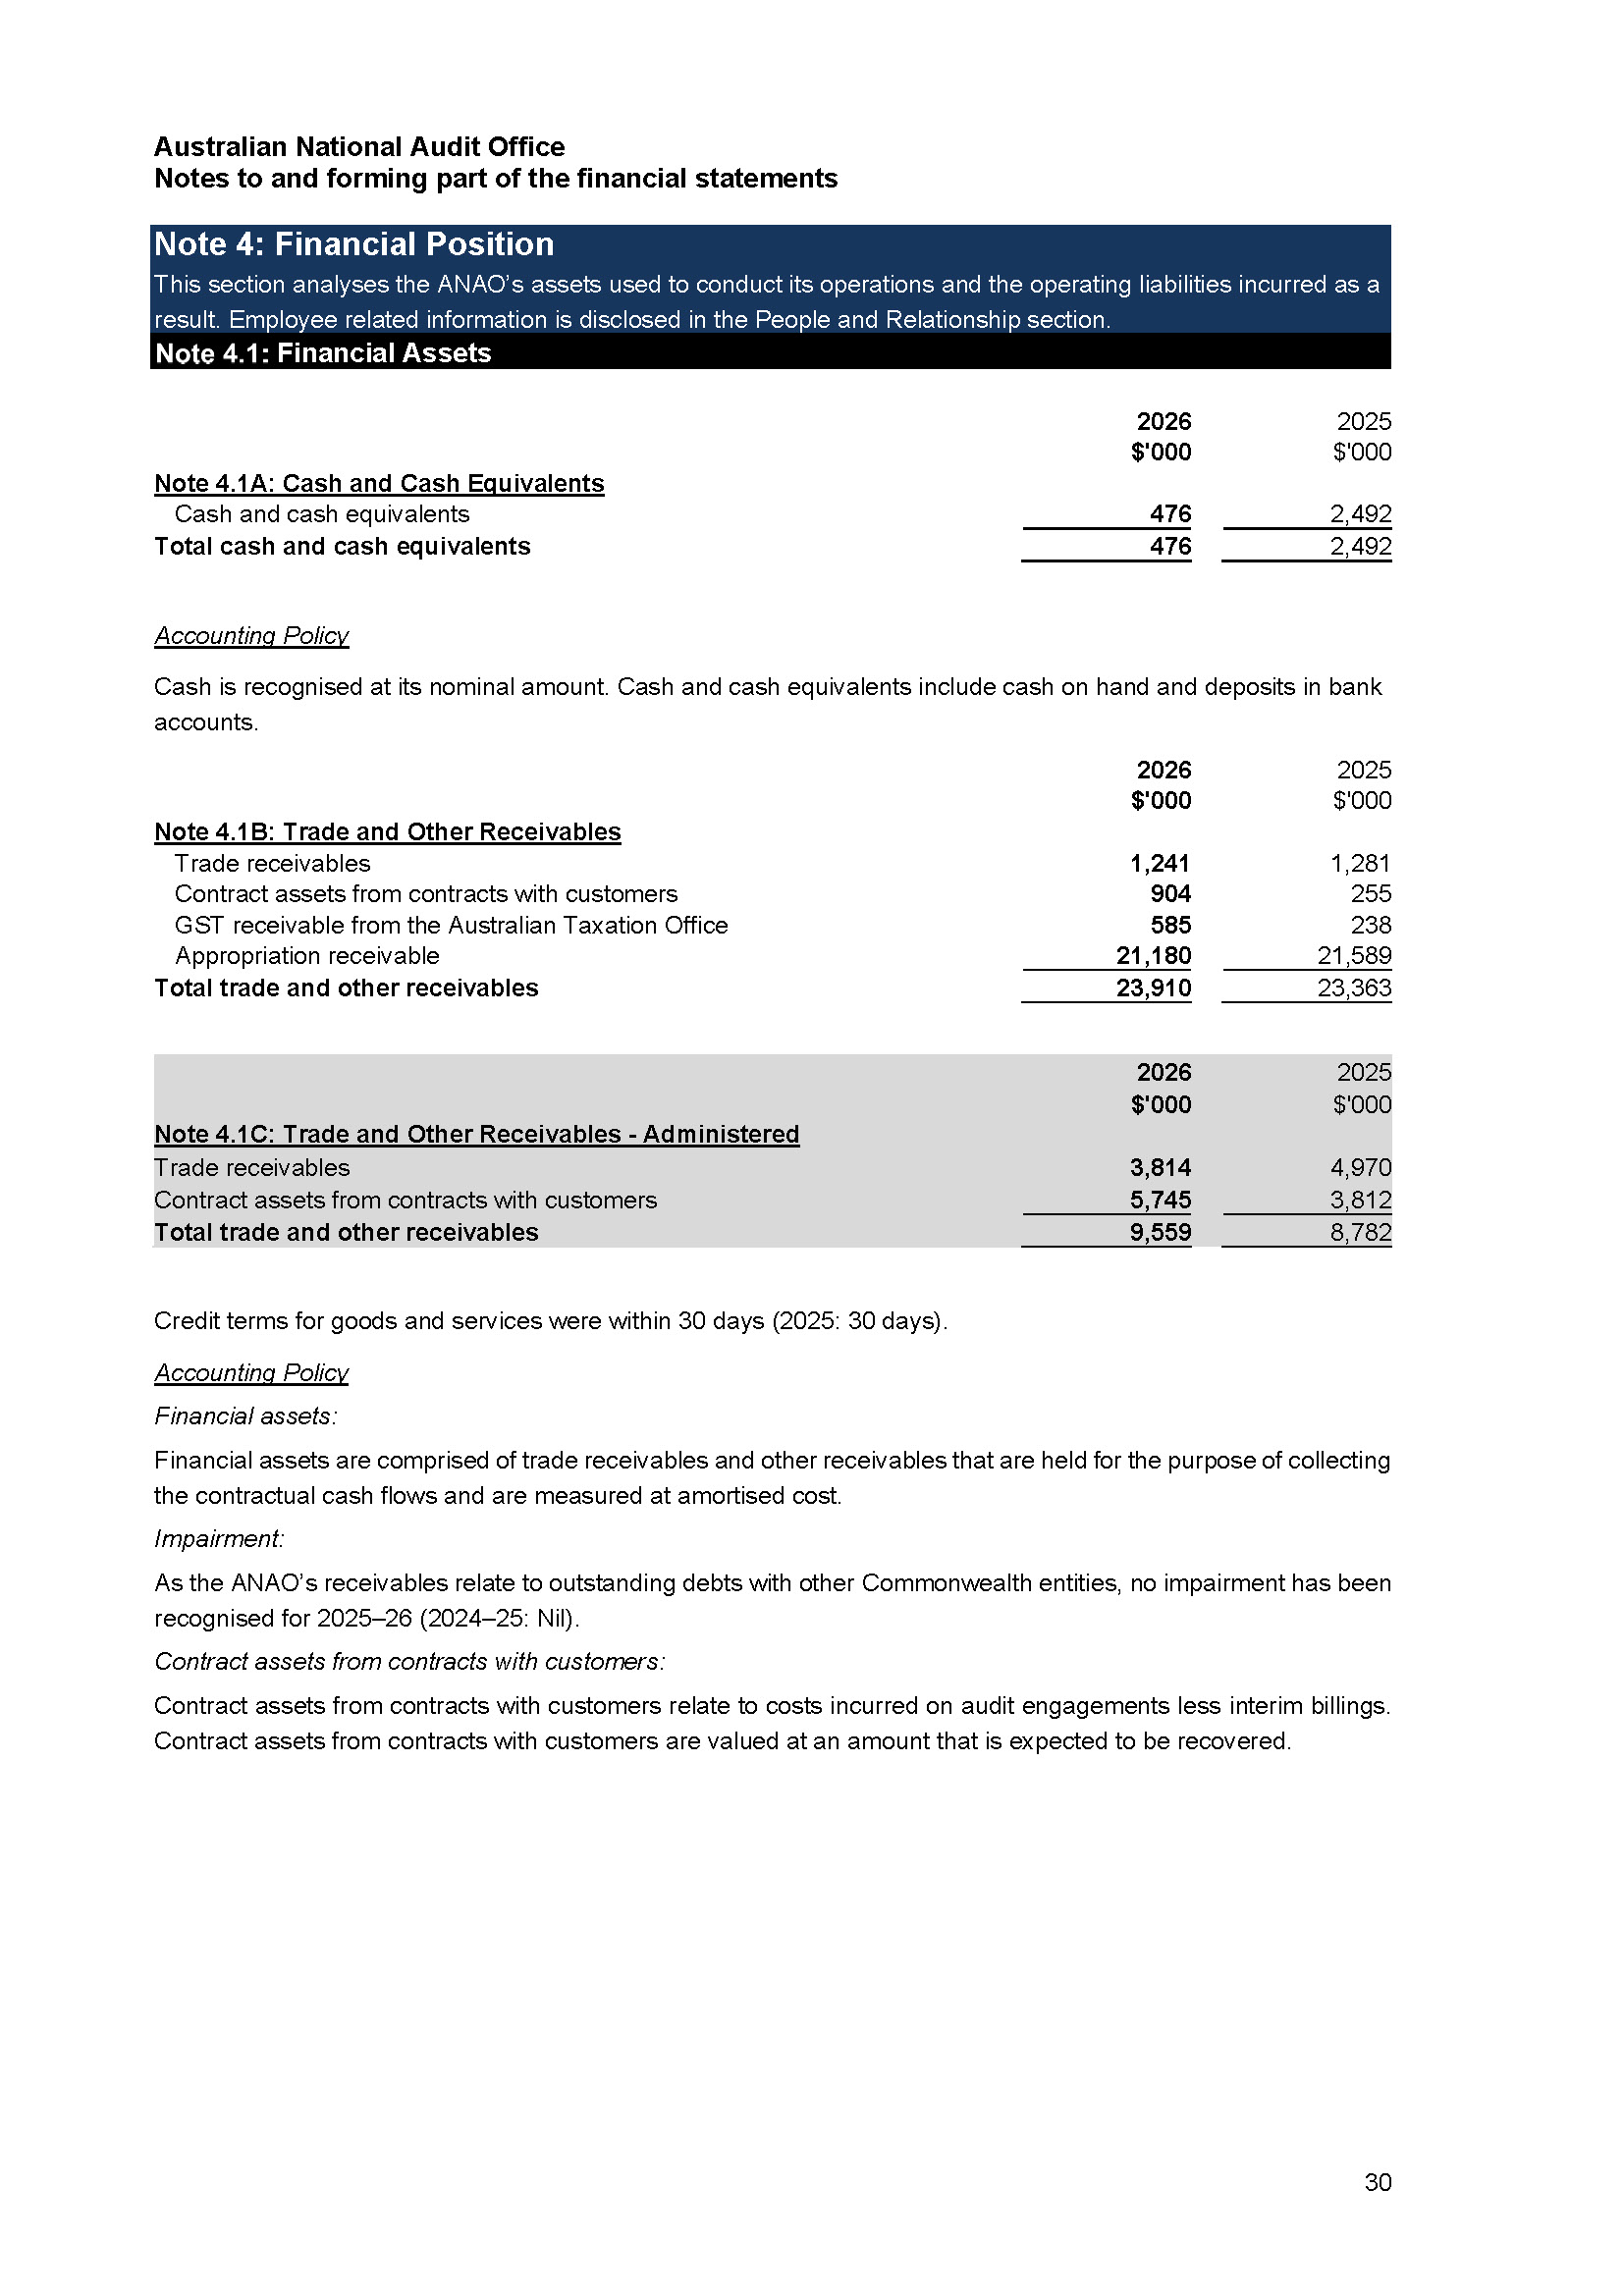
The majority of the ANAO’s assets are financial assets, with the largest balance being appropriation receivable ($21.180 million). The ANAO’s appropriation receivable has decreased by $0.409 million from 2024–25.
The majority of the ANAO’s liabilities are comprised of leases ($26.929 million) and employee provisions ($18.259 million). Lease liabilities reduced by $2.582 million during 2025–26, and employee provisions reduced by $0.345 million.
The ANAO continues to retain sufficient cash and appropriation receivables to fund its liabilities and commitments as and when they fall due.
Table 4.1: Summary of financial performance, 2024–25 and 2025–26
|
|
2025–26 ($’000) |
2024–25 ($’000) |
Variance ($’000) |
Variance (%) |
|
Statement of comprehensive income |
||||
|
Total own-source revenue |
6,308 |
5,212 |
1,096 |
21.03 |
|
Total revenue from government |
99,209 |
96,905 |
2,304 |
2.38 |
|
Total expenses |
106,285 |
108,632 |
-2,347 |
-2.16 |
|
Net surplus(/deficit) |
-768 |
-6,515 |
5,747 |
88.21 |
|
Statement of financial position |
||||
|
Total assets |
56,736 |
60,514 |
-3,778 |
-6.24 |
|
Total liabilities |
51,863 |
55,140 |
-3,277 |
-5.94 |
|
Net assets |
4,873 |
5,374 |
-501 |
-9.32 |
|
Equity |
4,873 |
5,374 |
-501 |
-9.32 |
Note: The ANAO’s net cash operating result was a surplus of $0.439 million in 2025–26, excluding depreciation and amortisation and adjustments for leases.
Revenue impacts
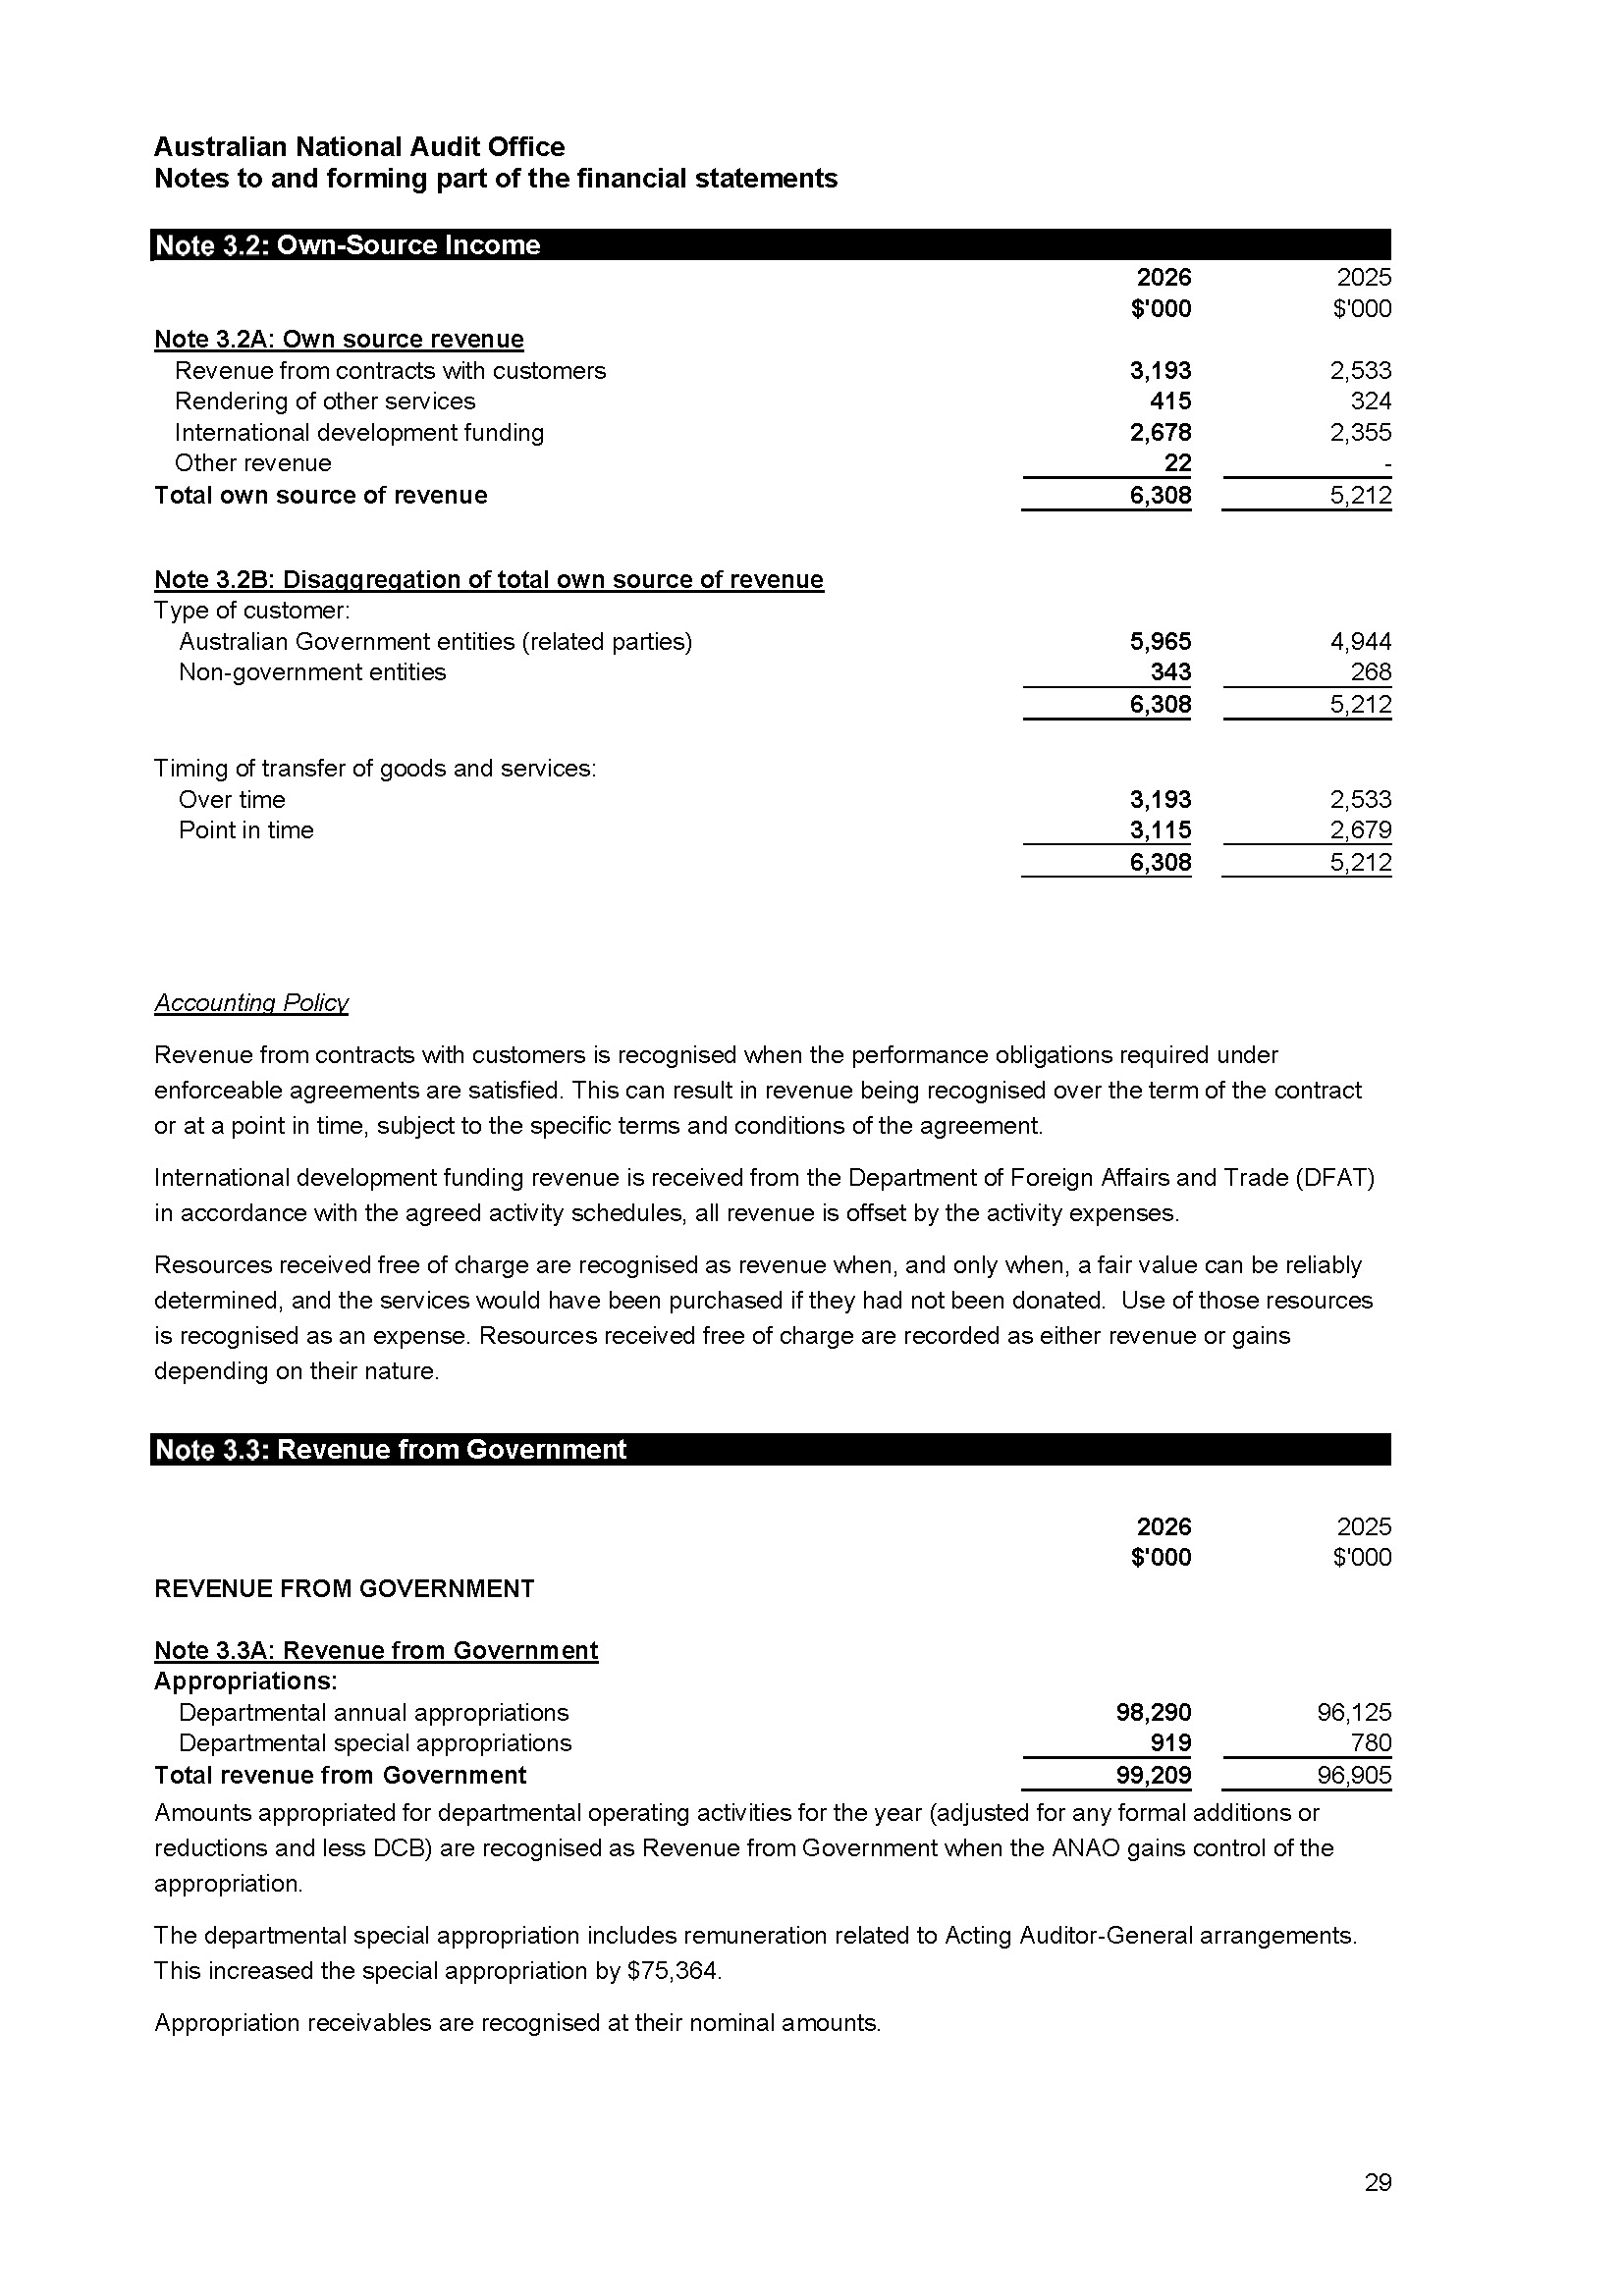
Government revenue from departmental and special appropriations was $99.209 million in 2025–26, an increase of $2.304 million from 2024–25. Departmental annual appropriation was $98.290 million and departmental special appropriation was $0.919 million.
Entity resource statement
The entity resource statement provides additional information about the various funding sources that the ANAO may draw upon during the year. Appendix D details the resources available to the ANAO during 2025–26 and sets out the ANAO’s summary of total expenses for Outcome 1.
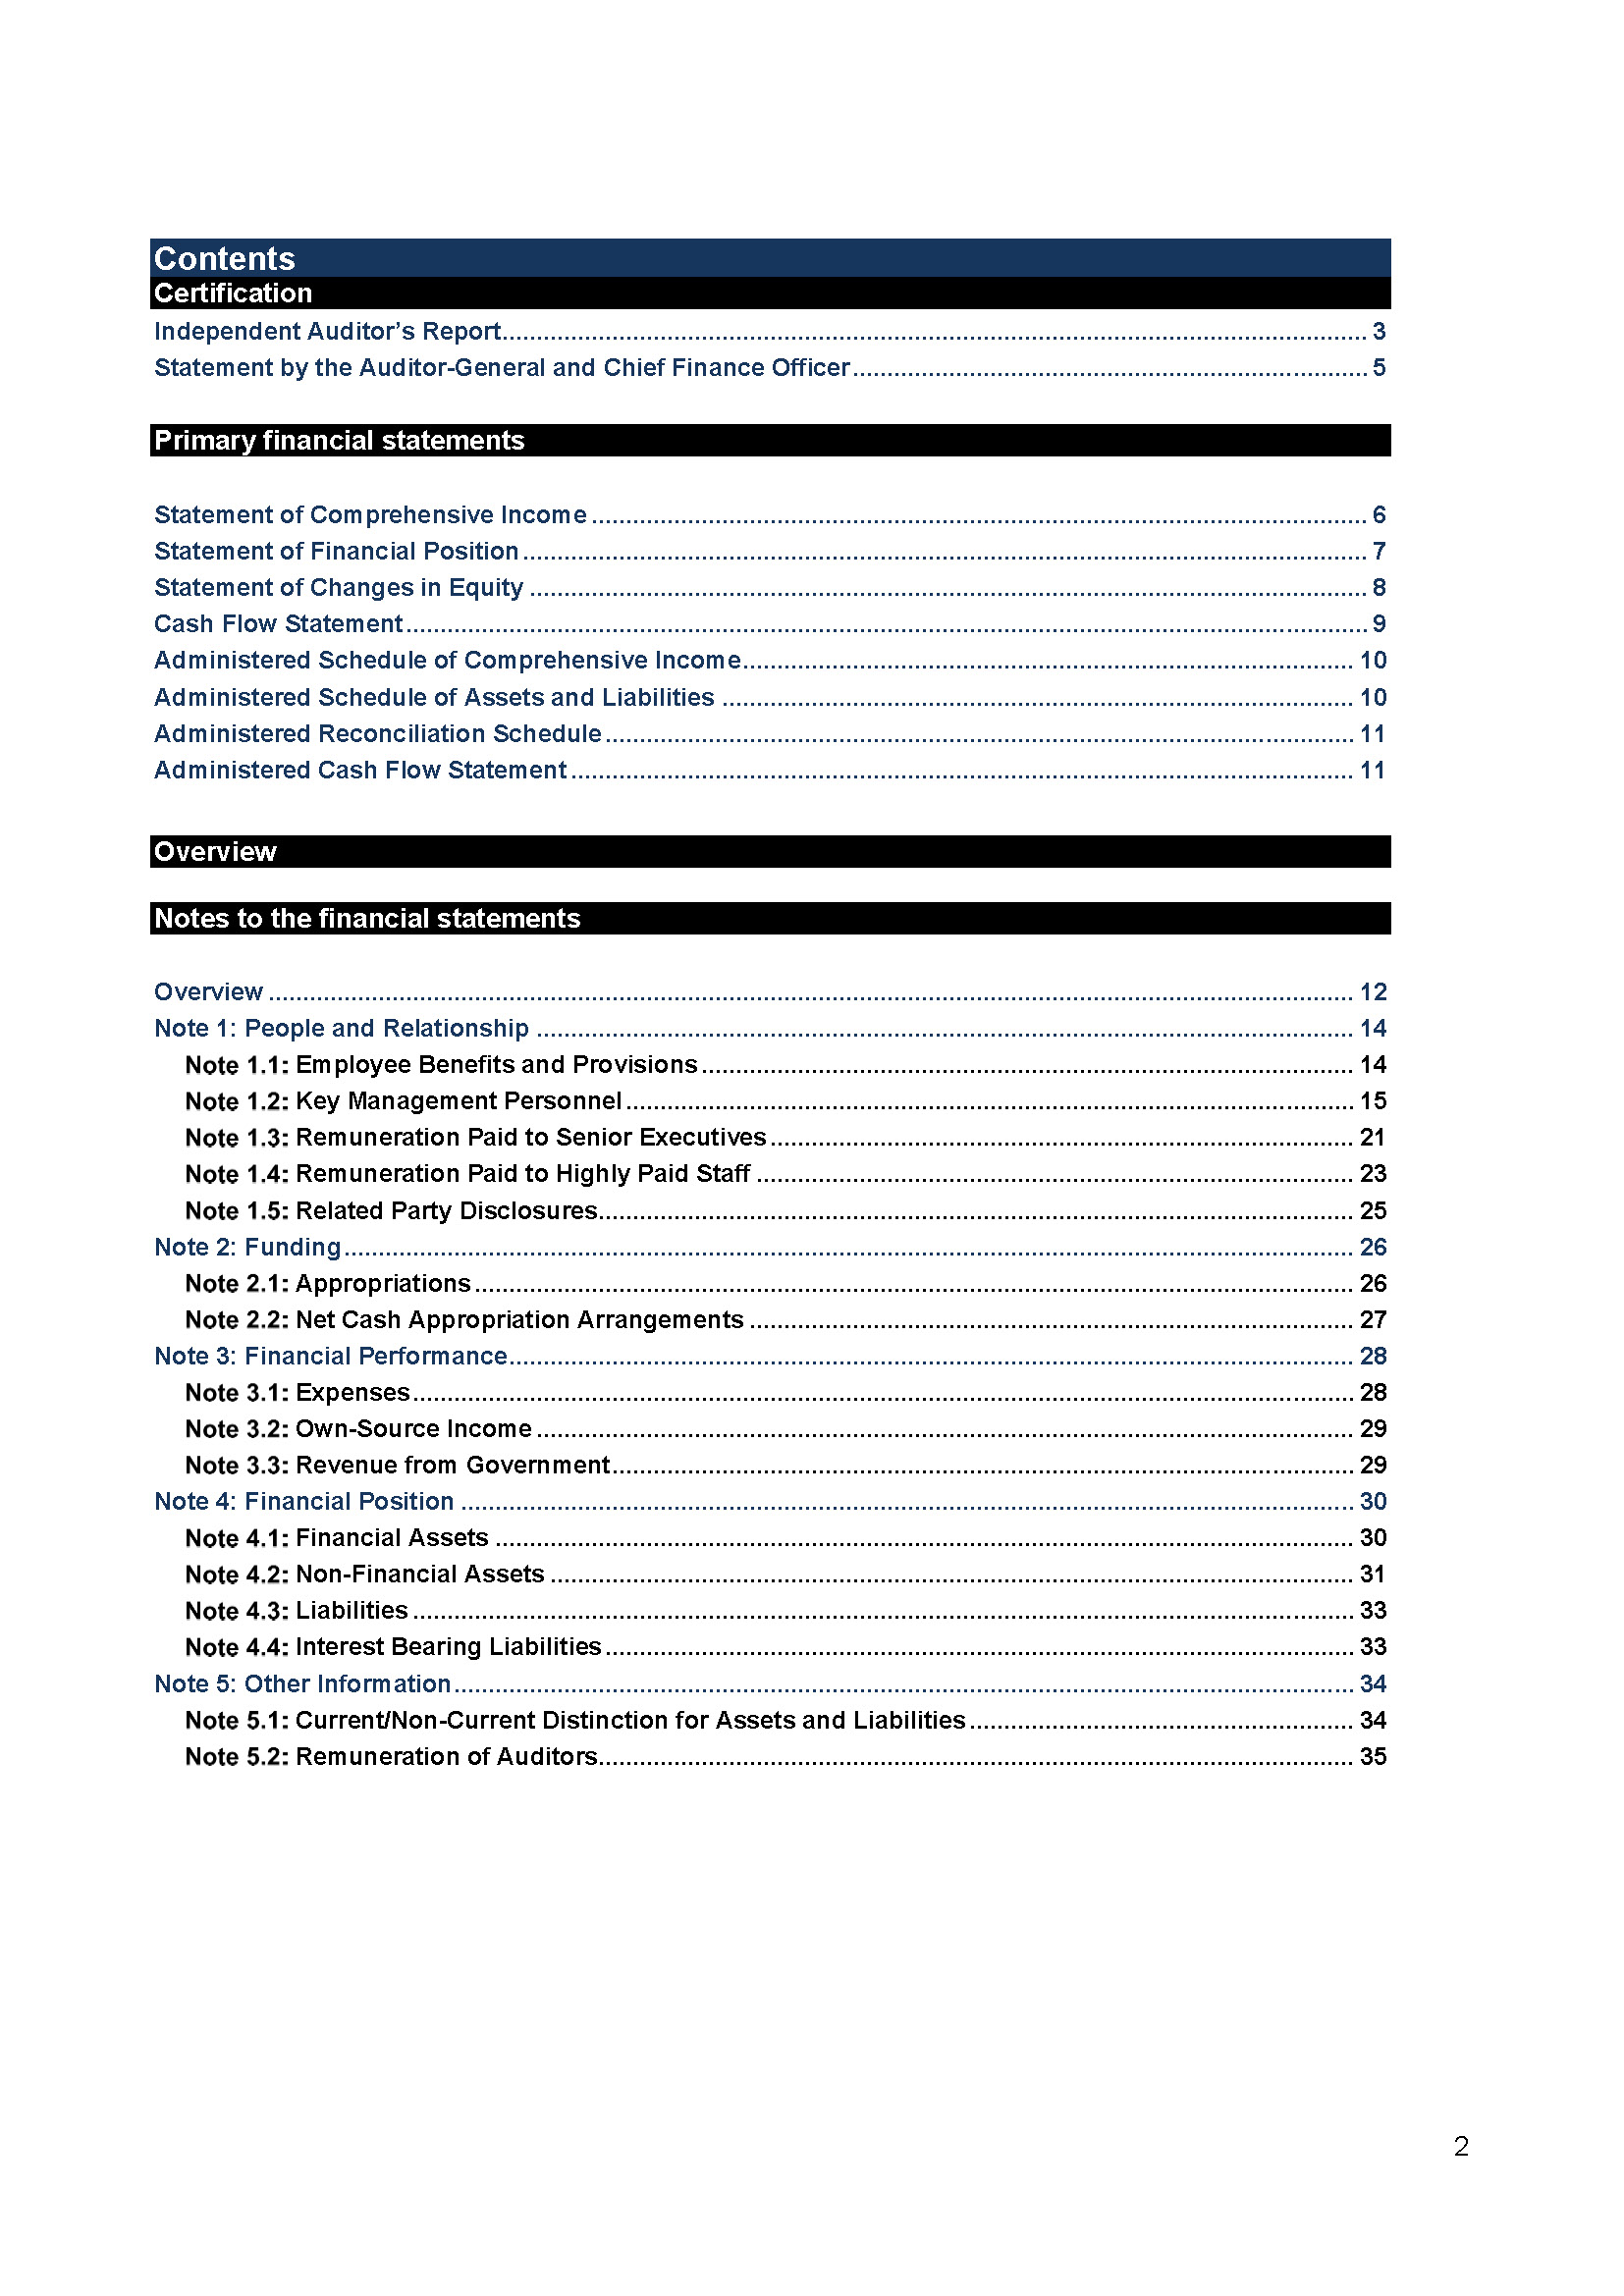
Financial statements
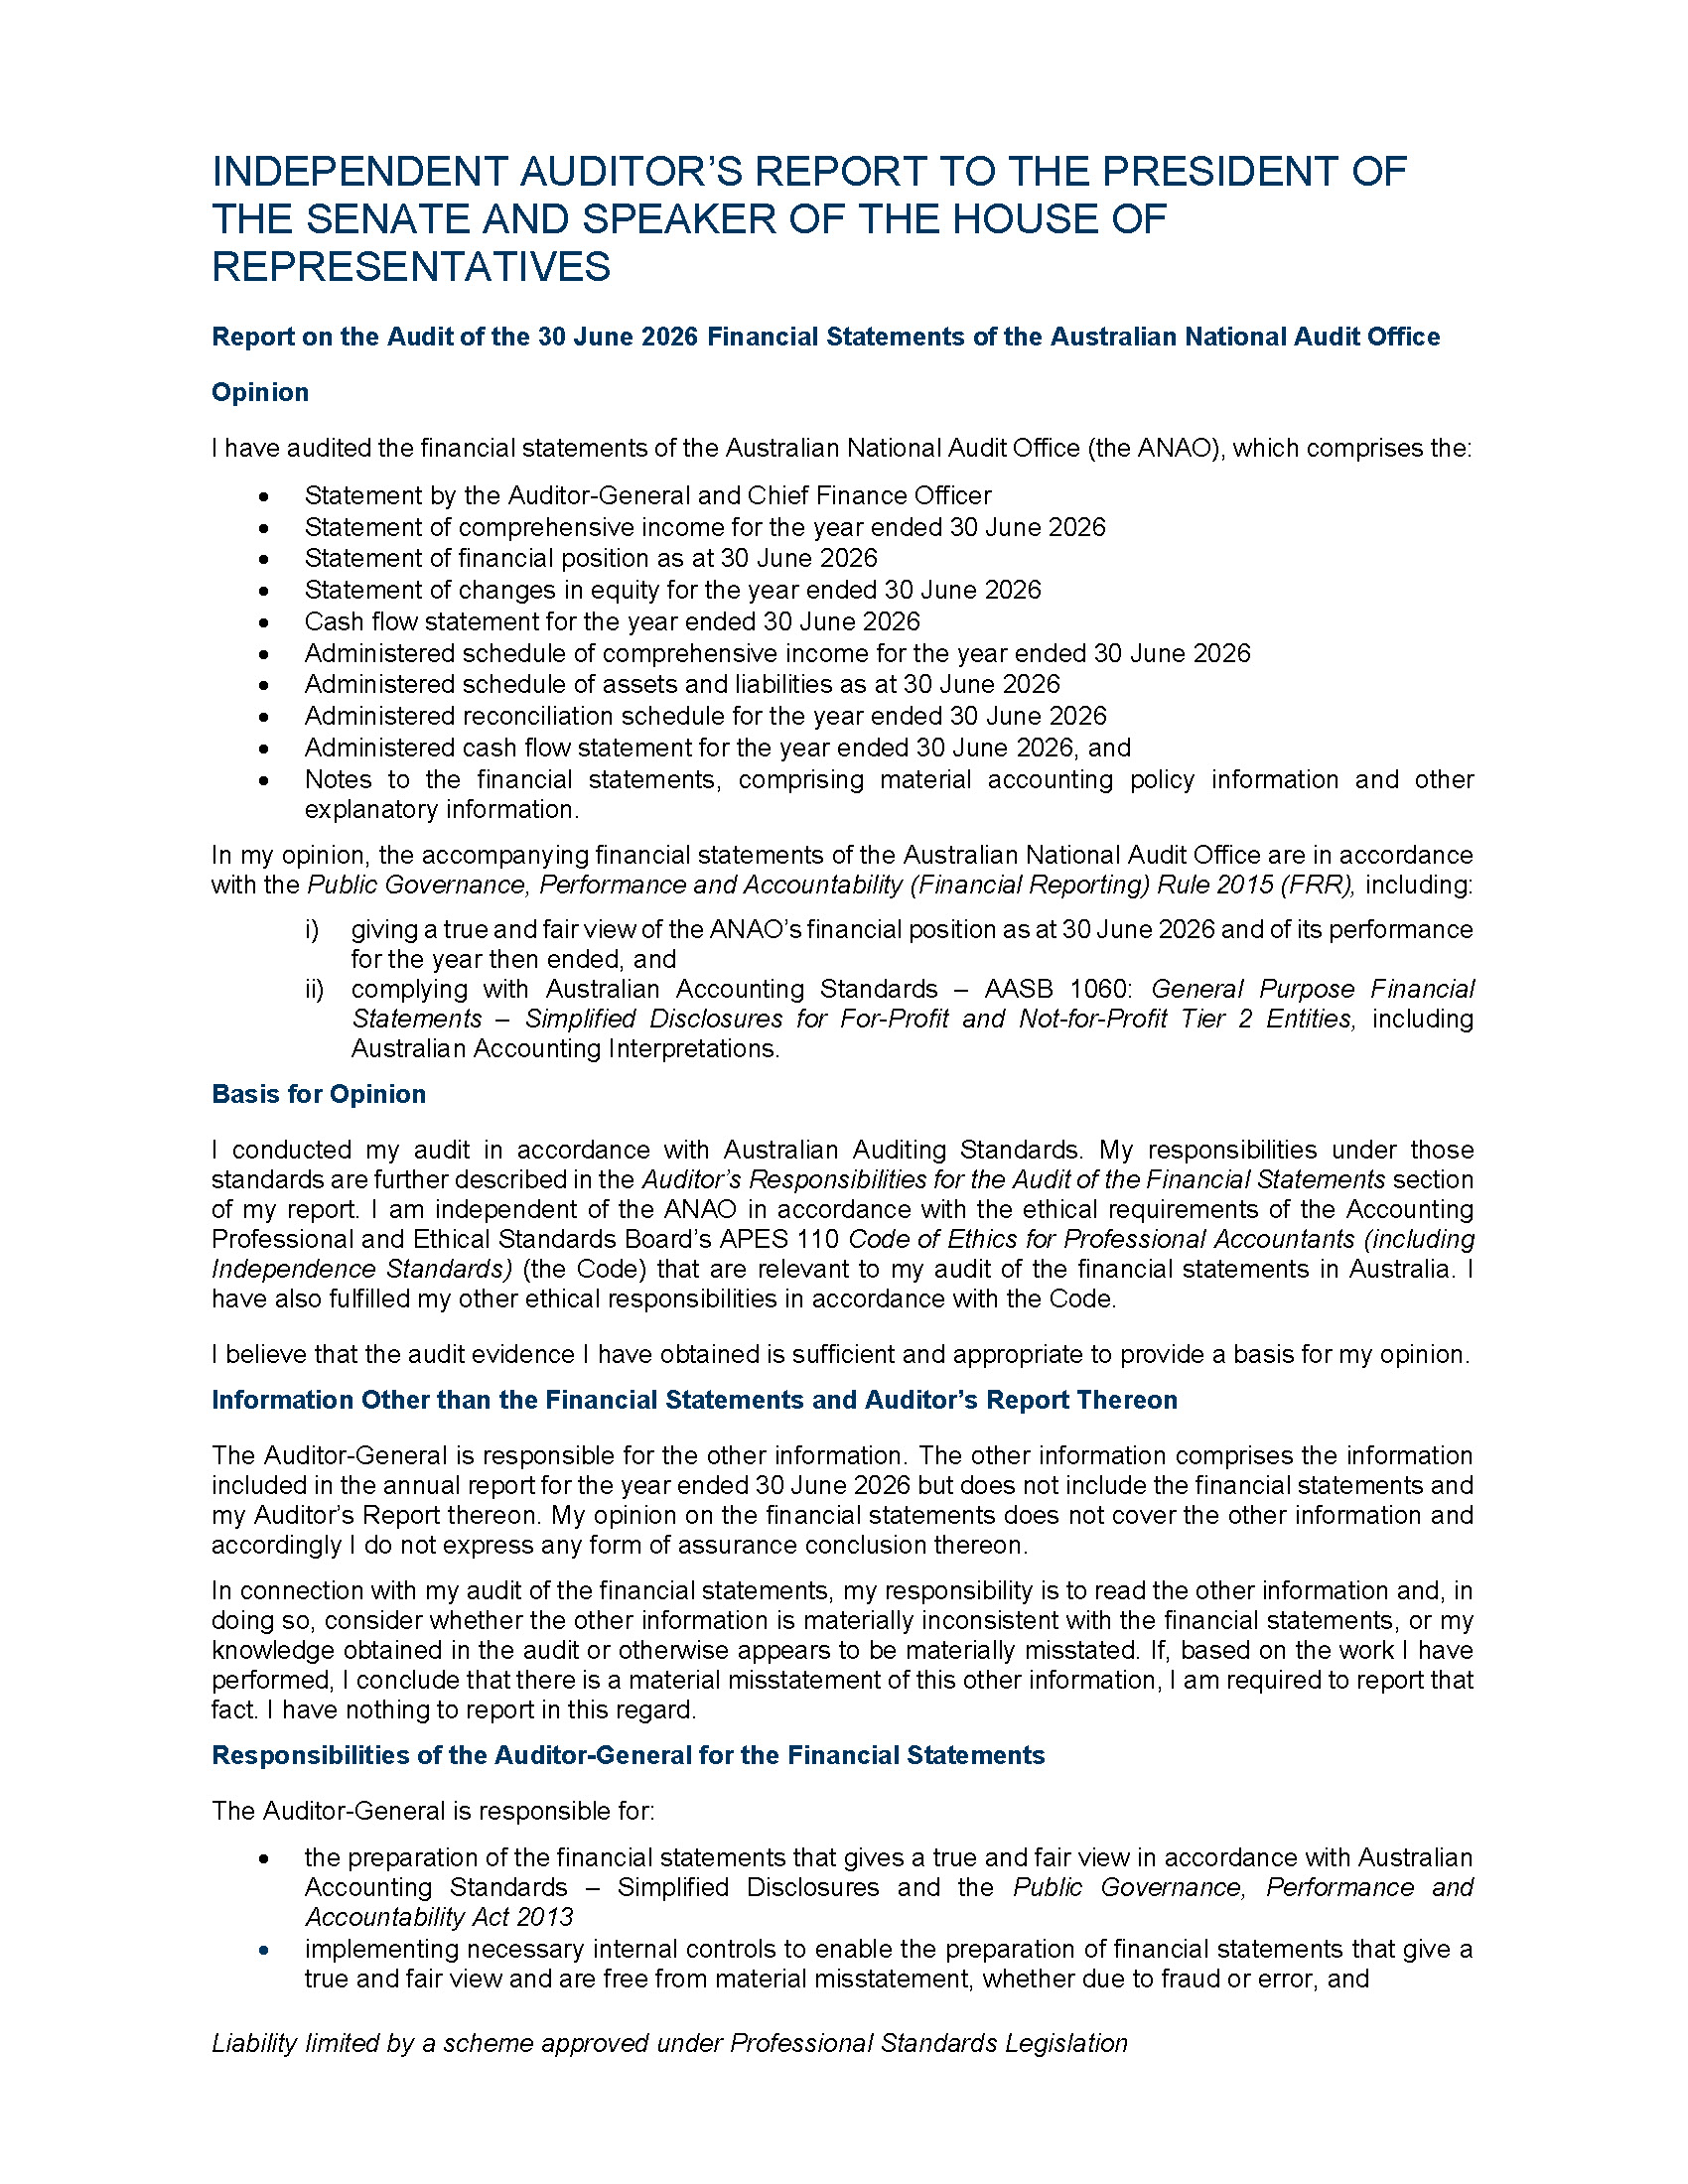
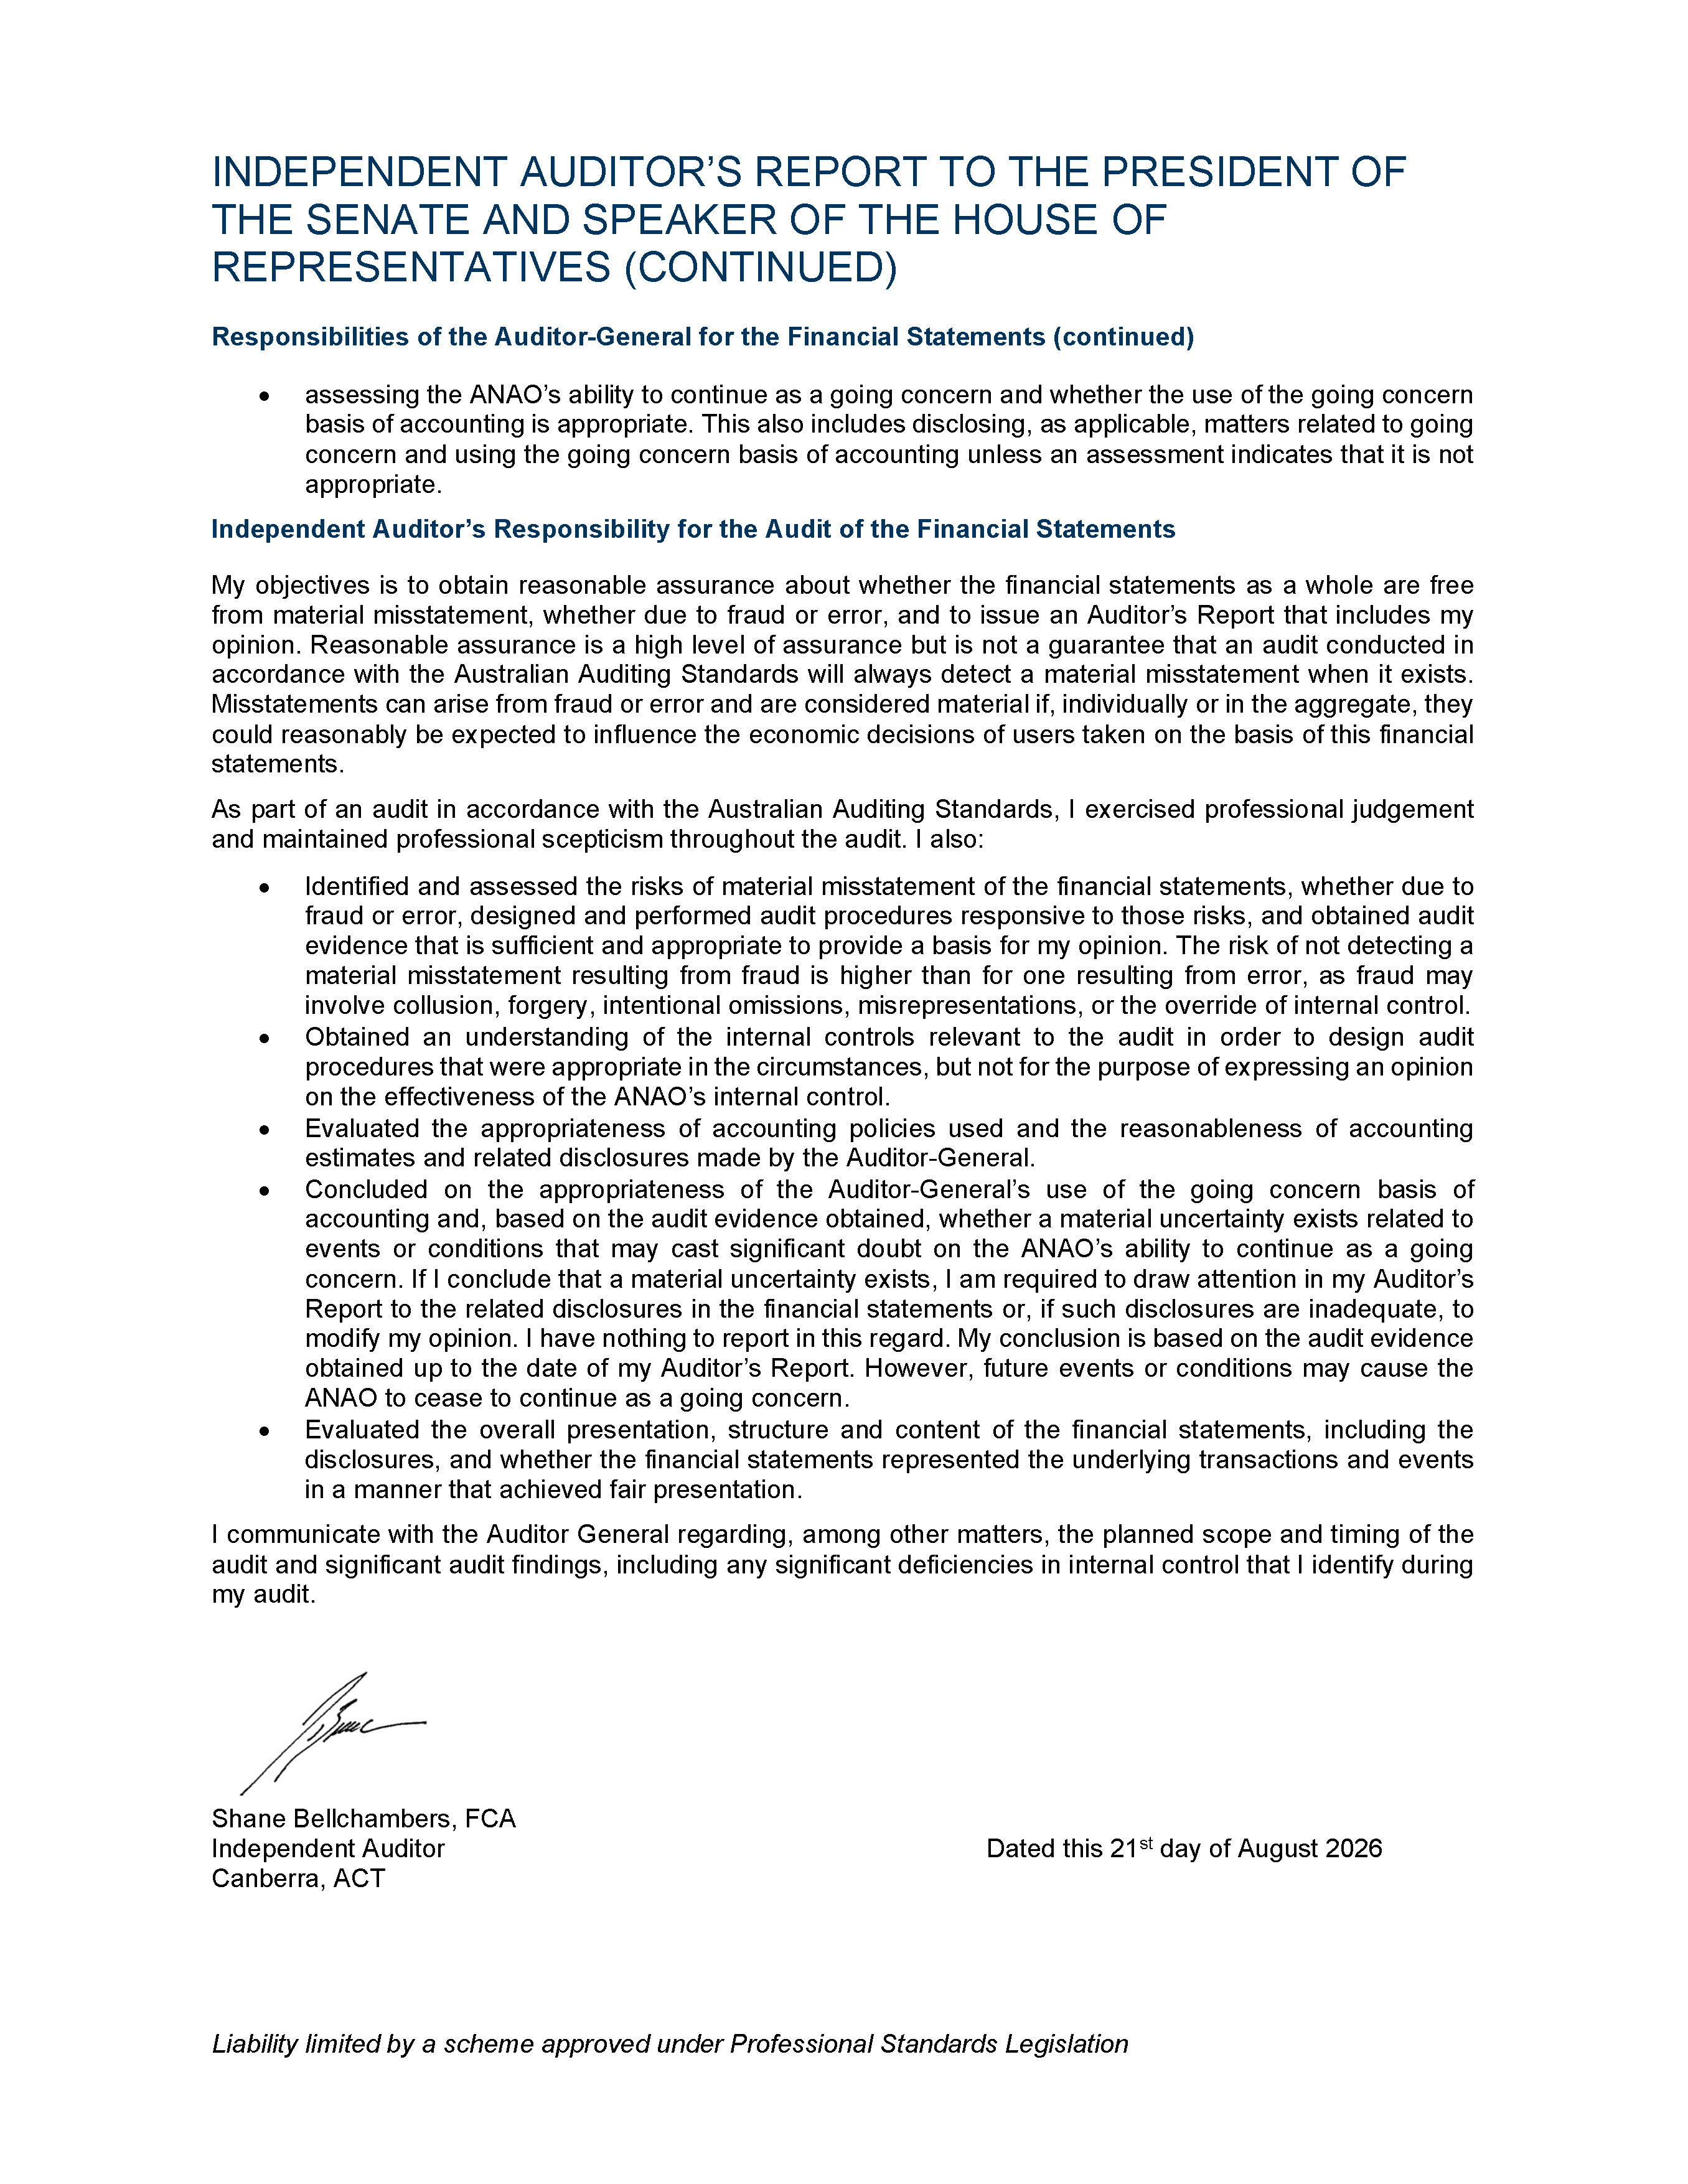
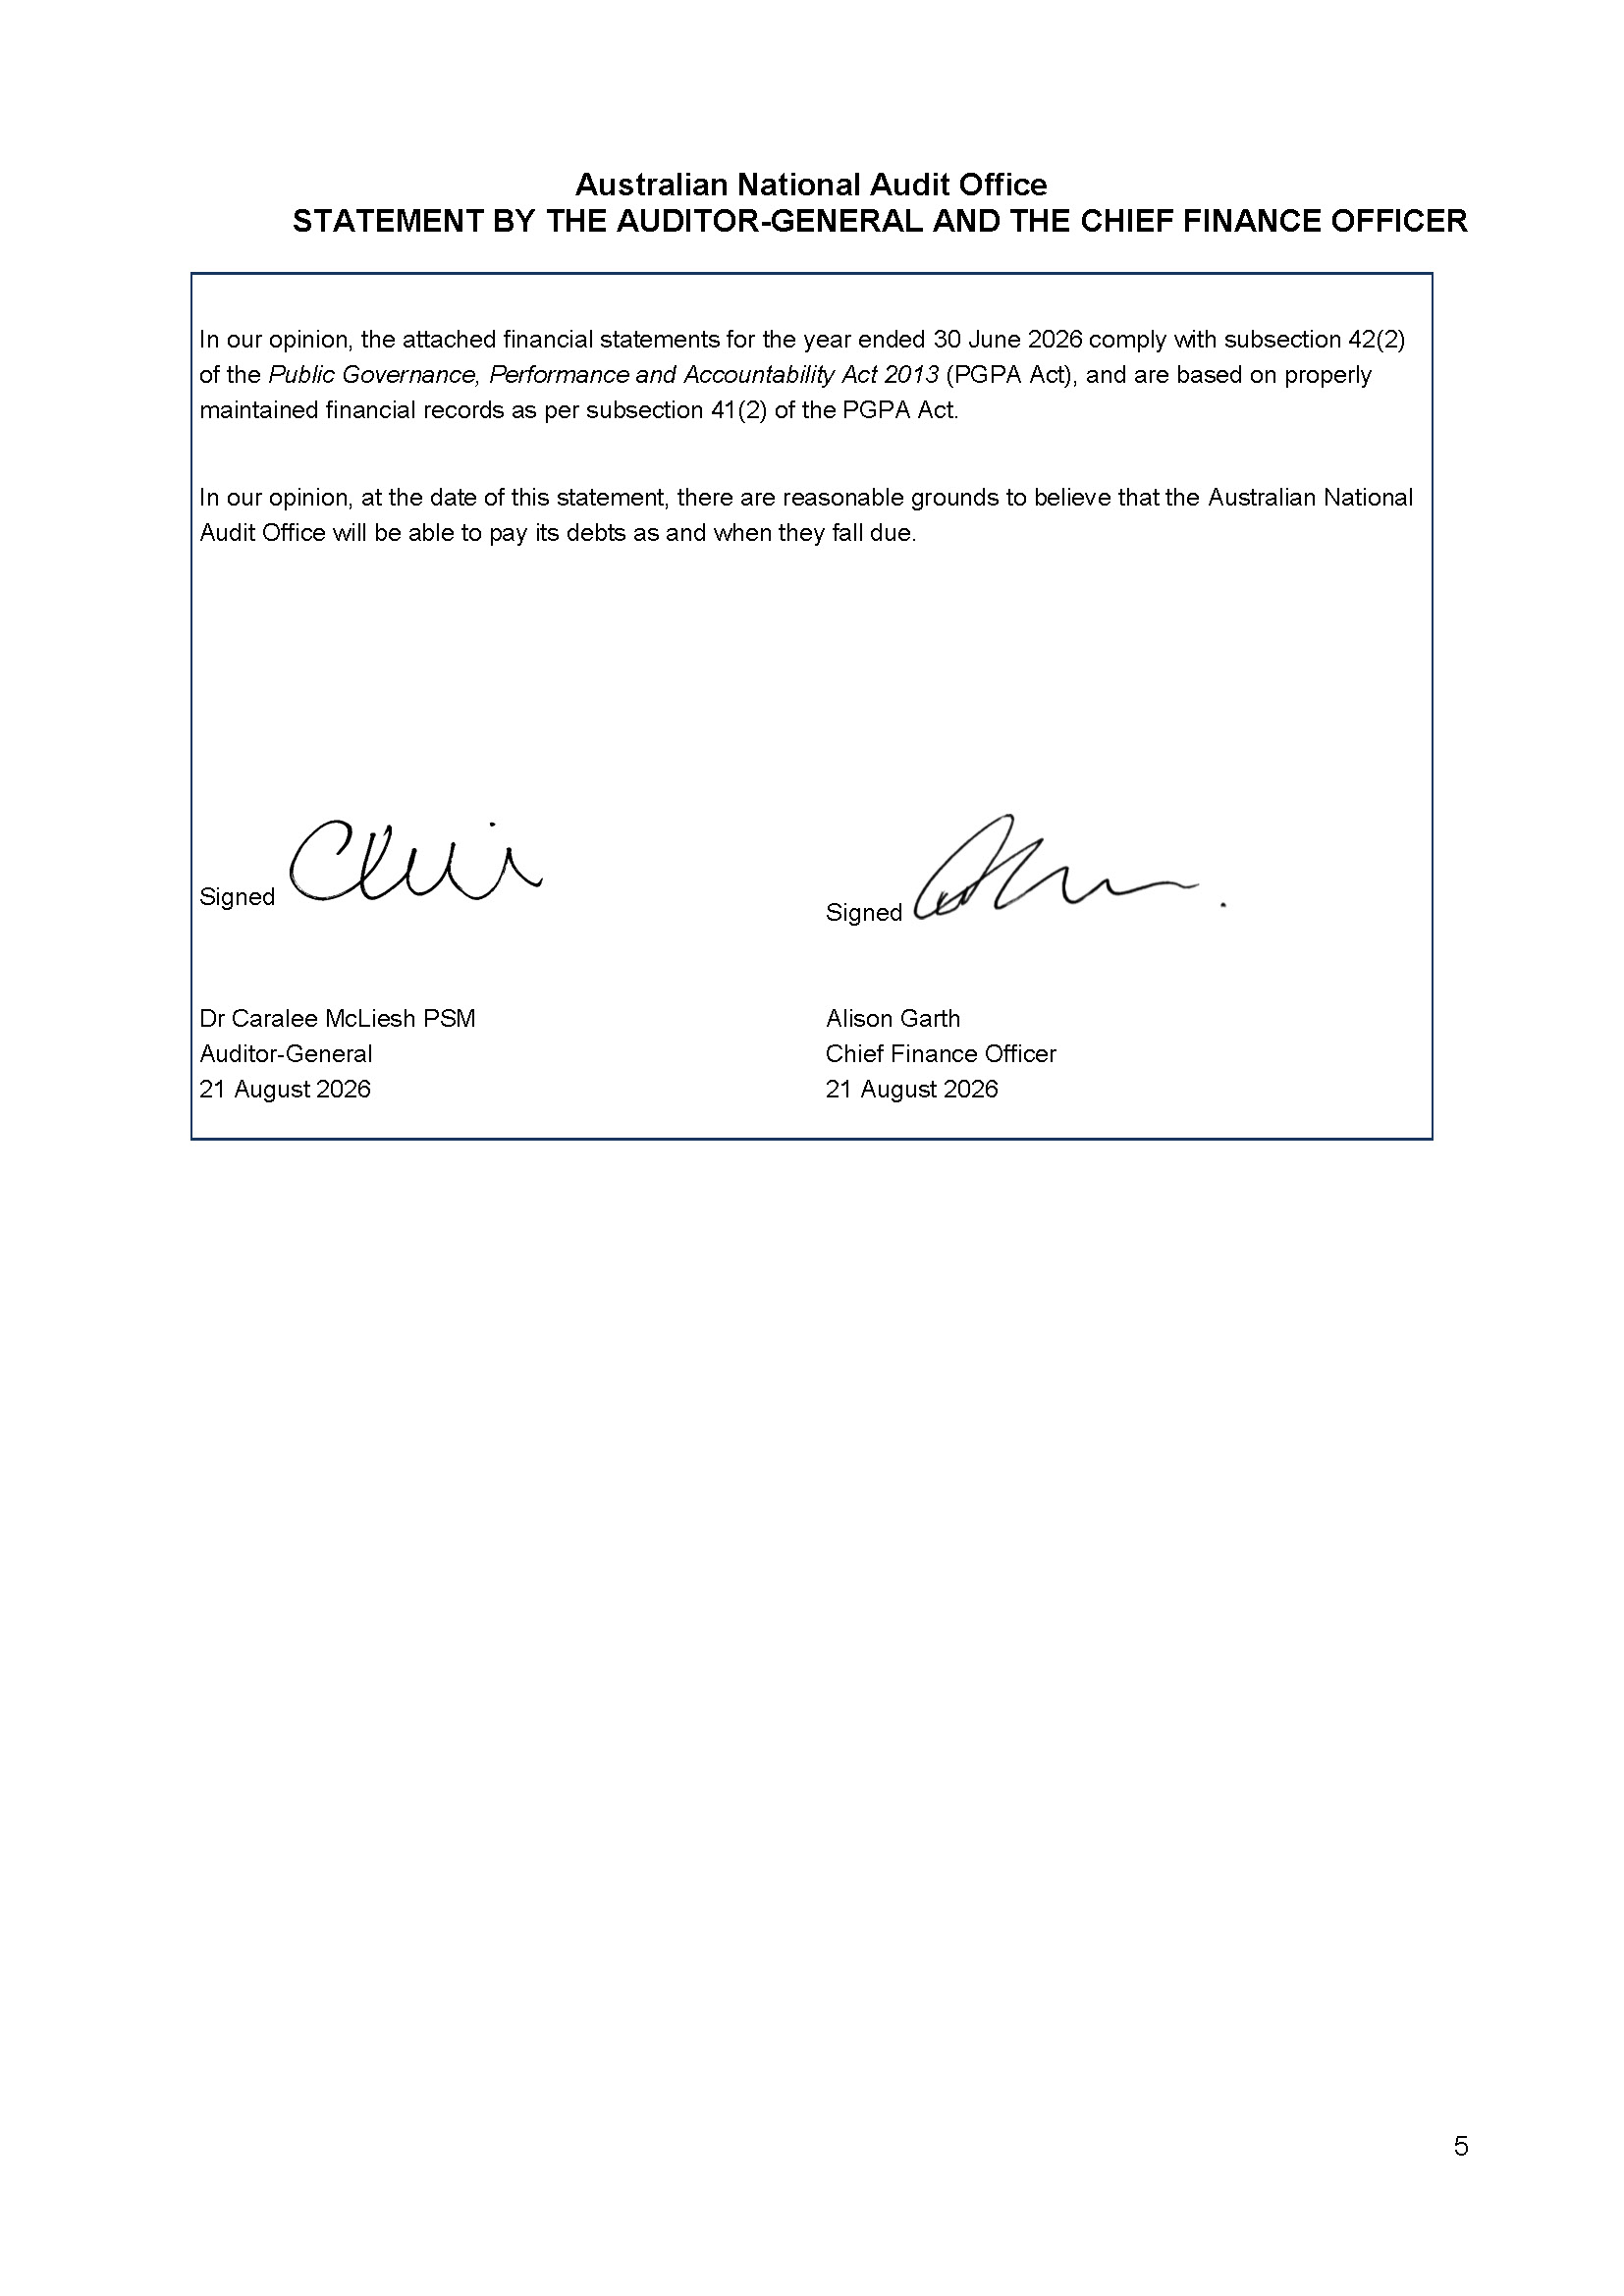
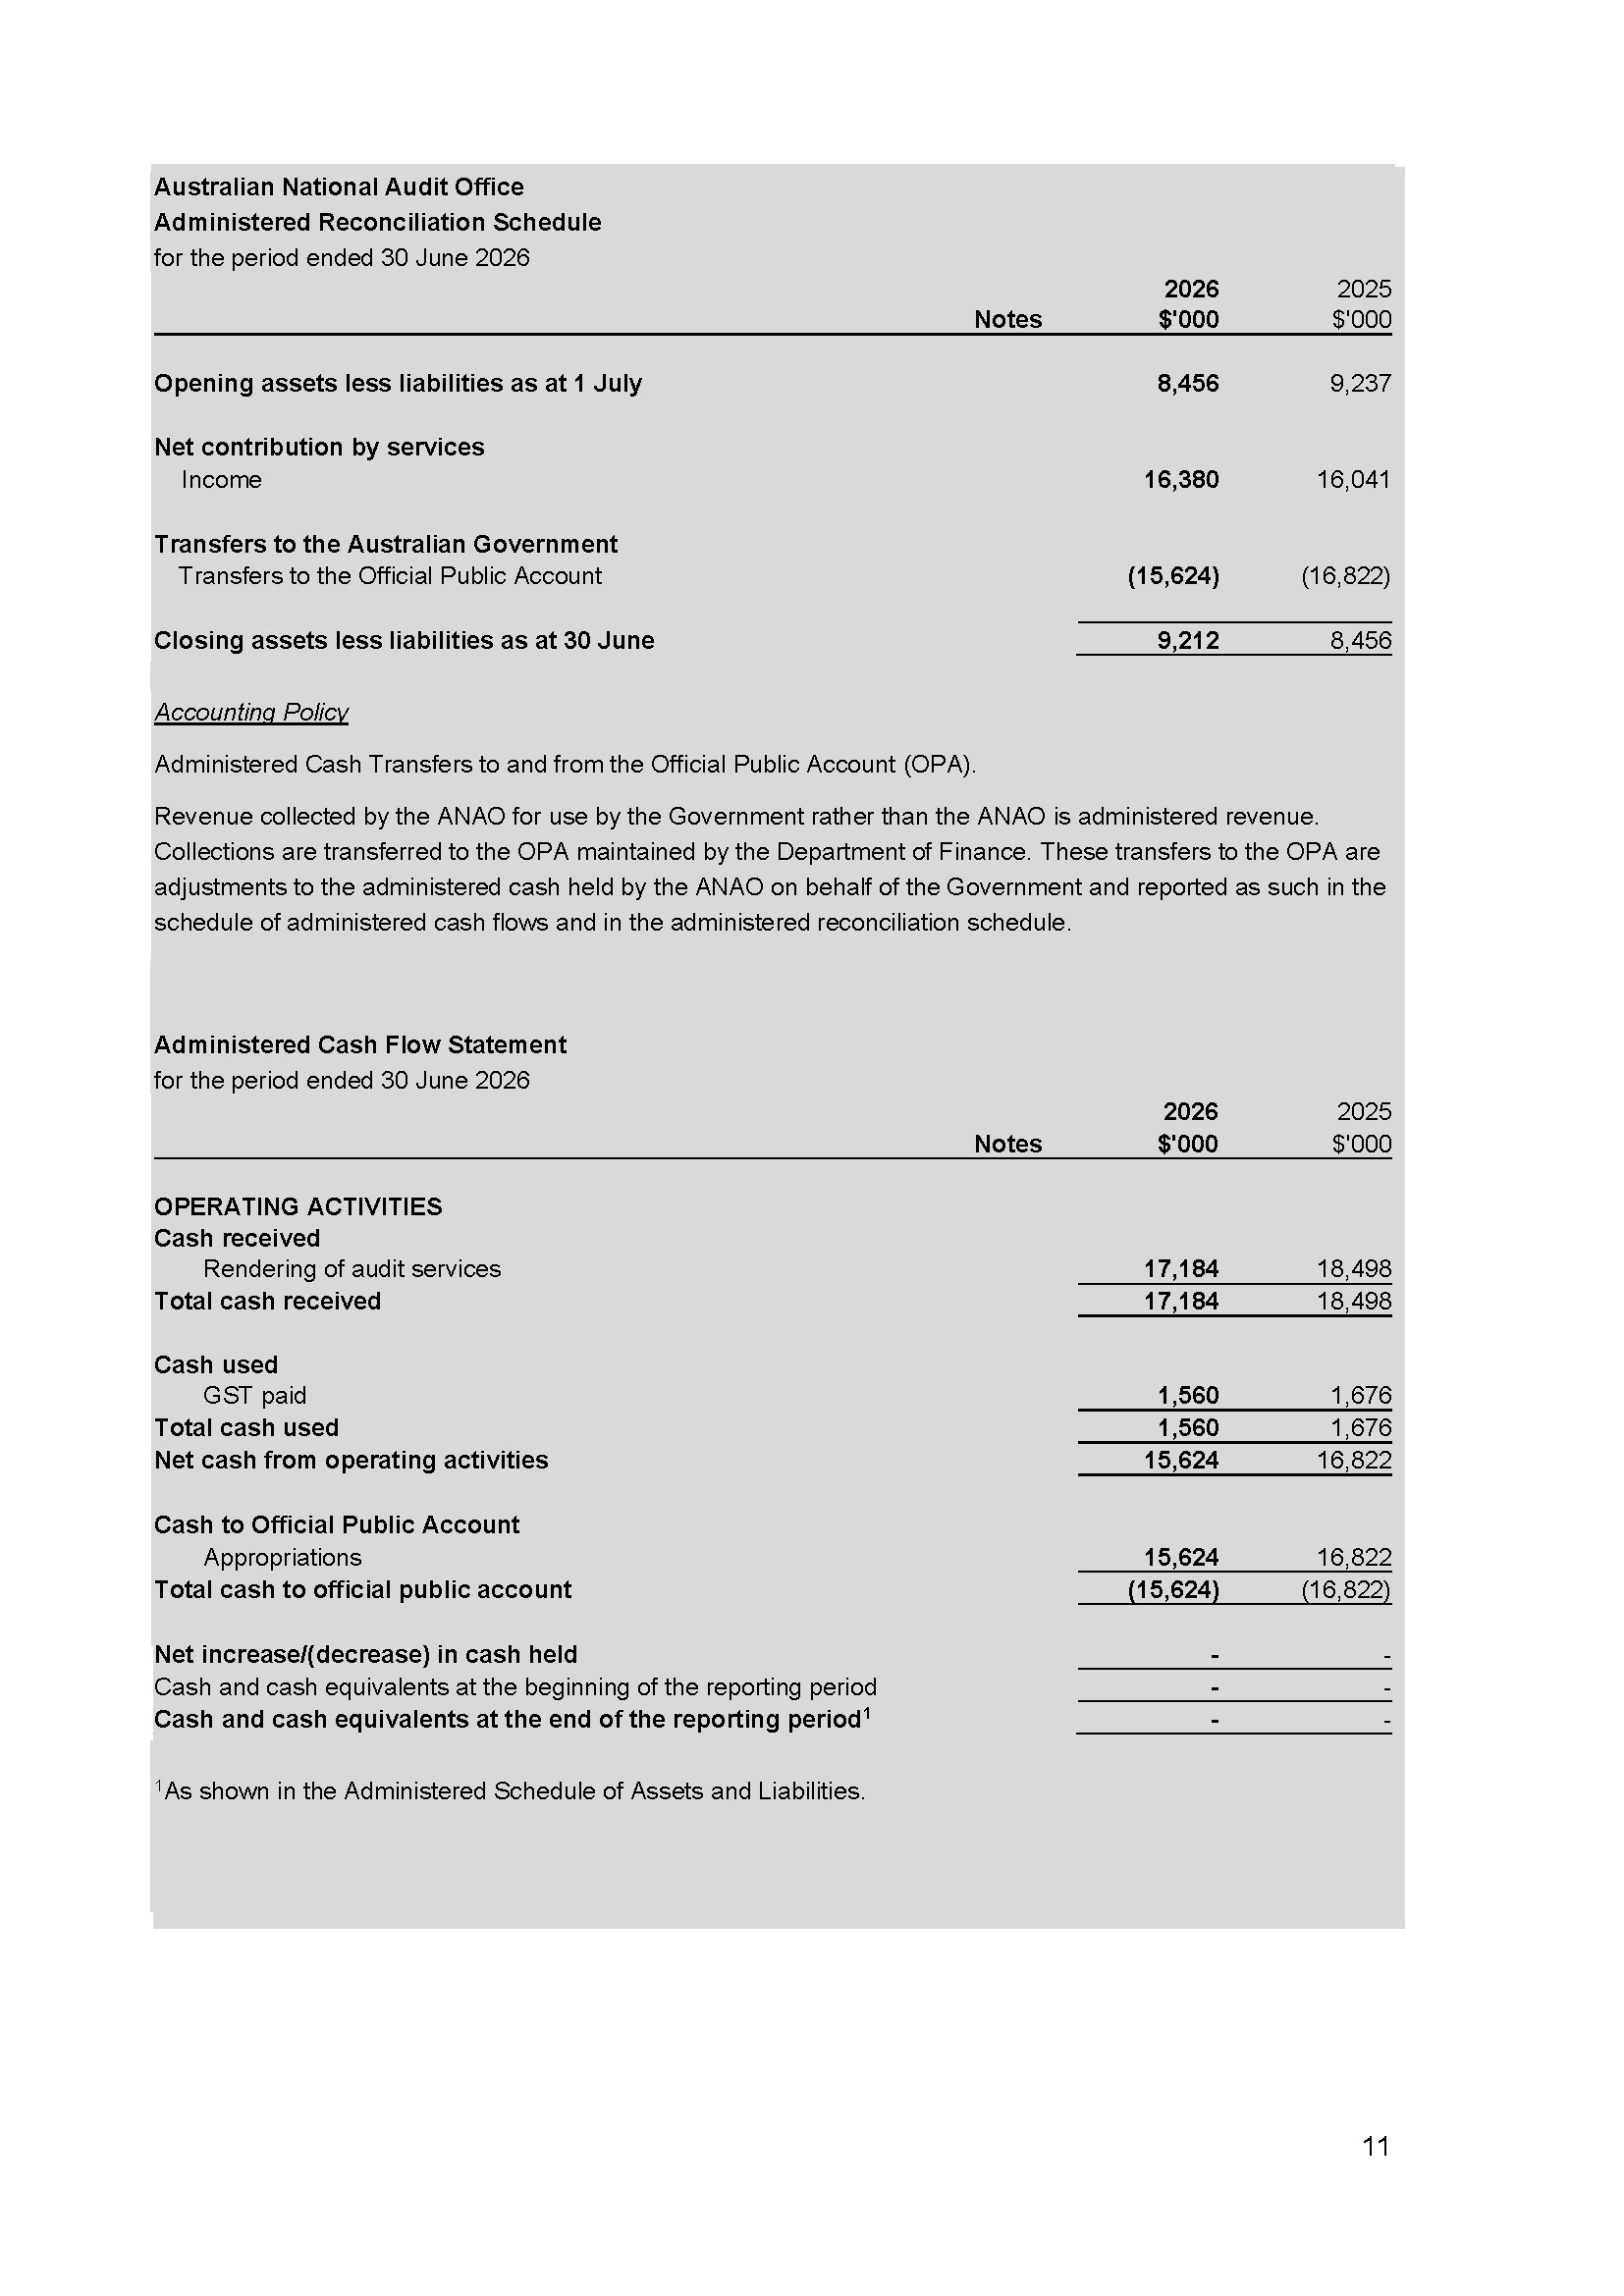
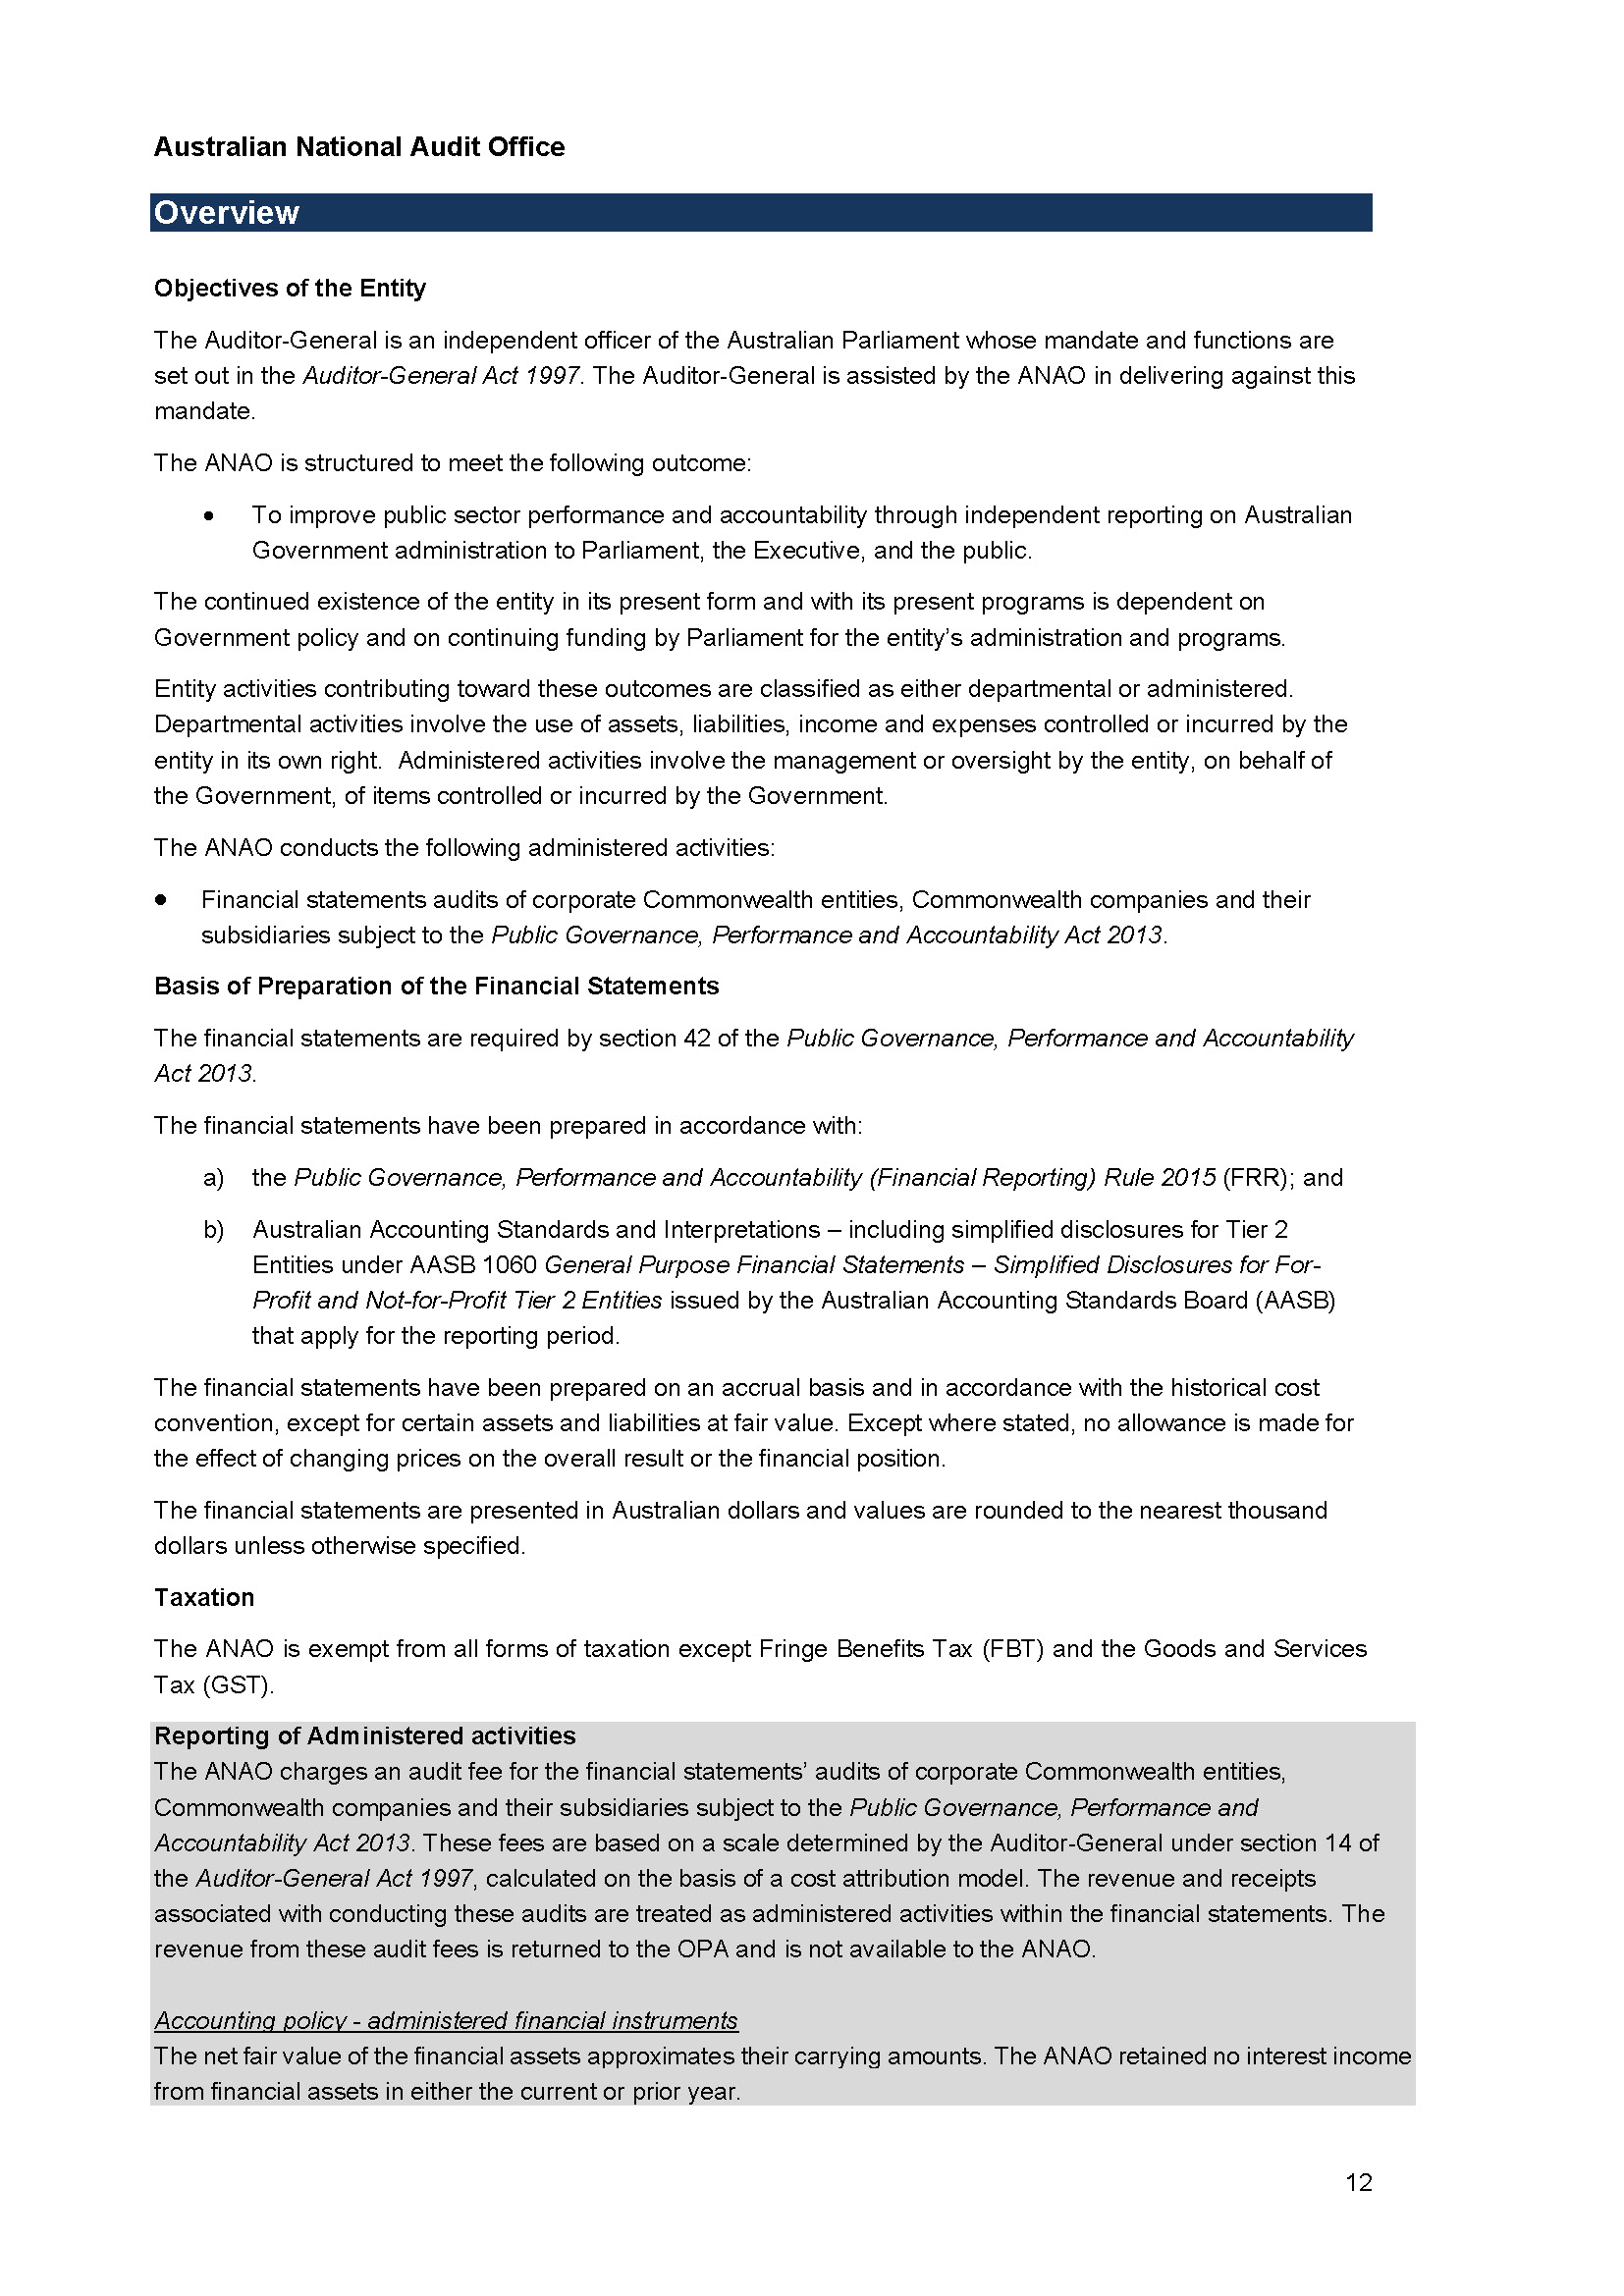
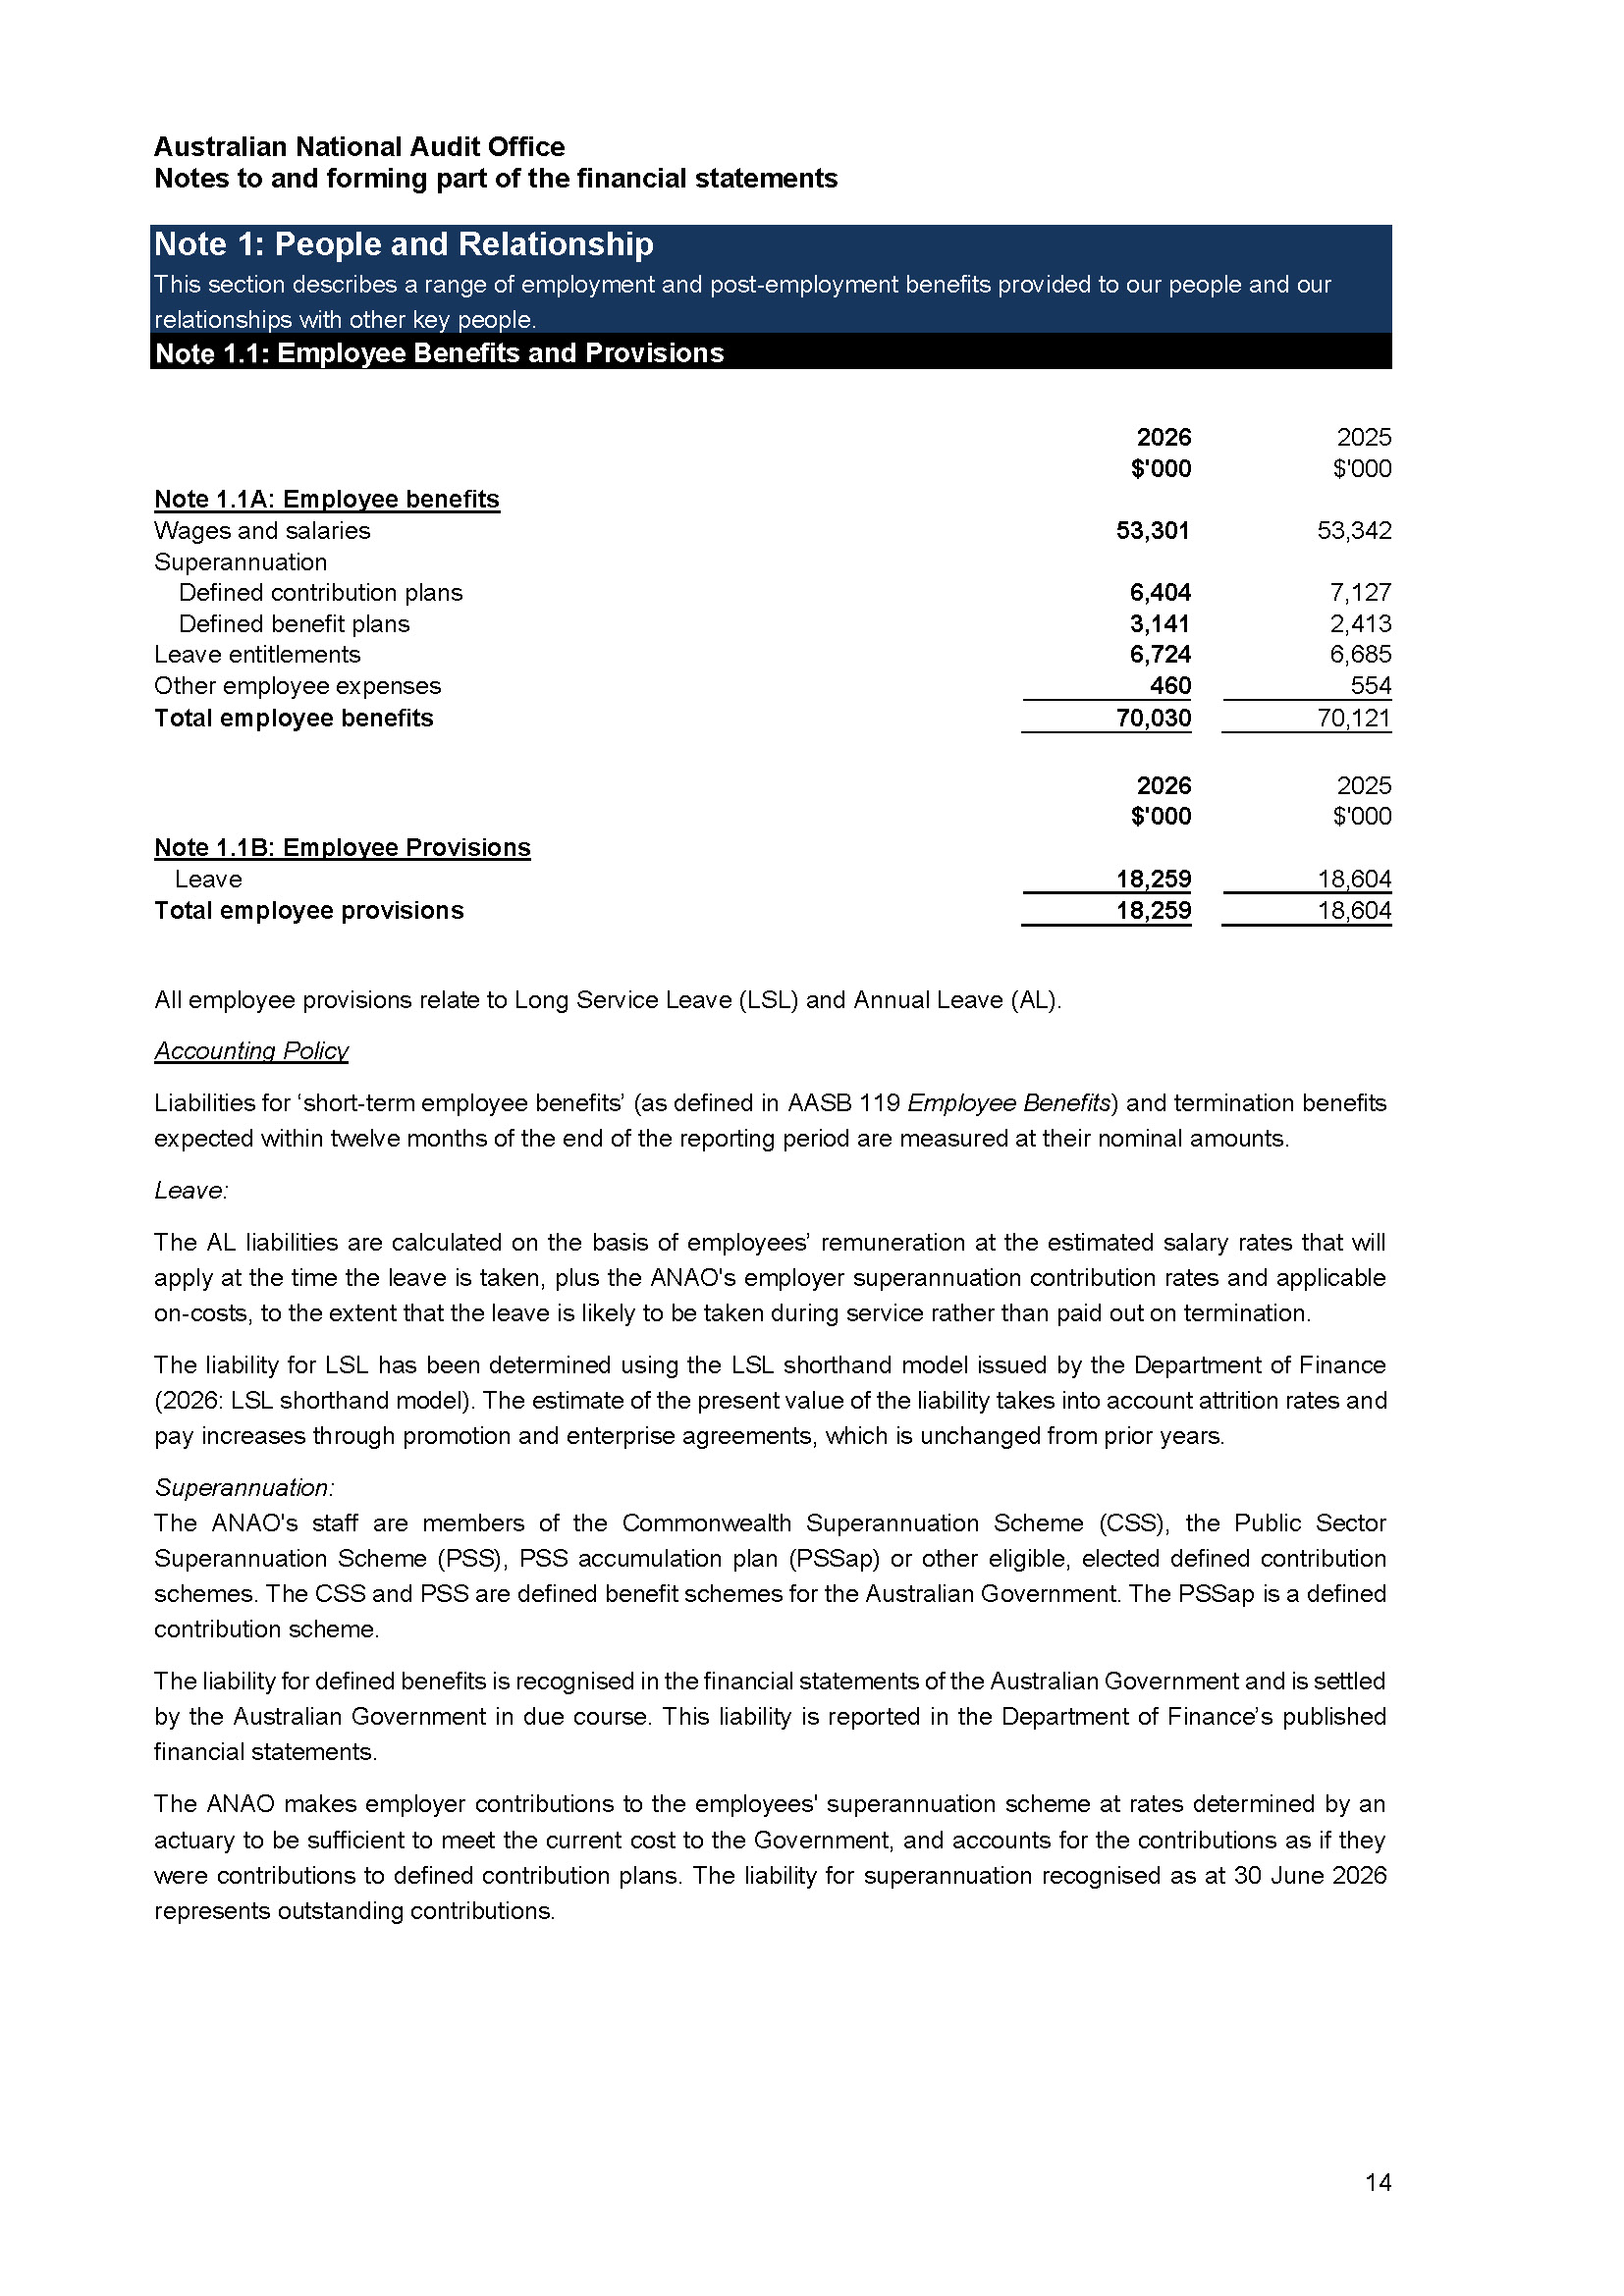
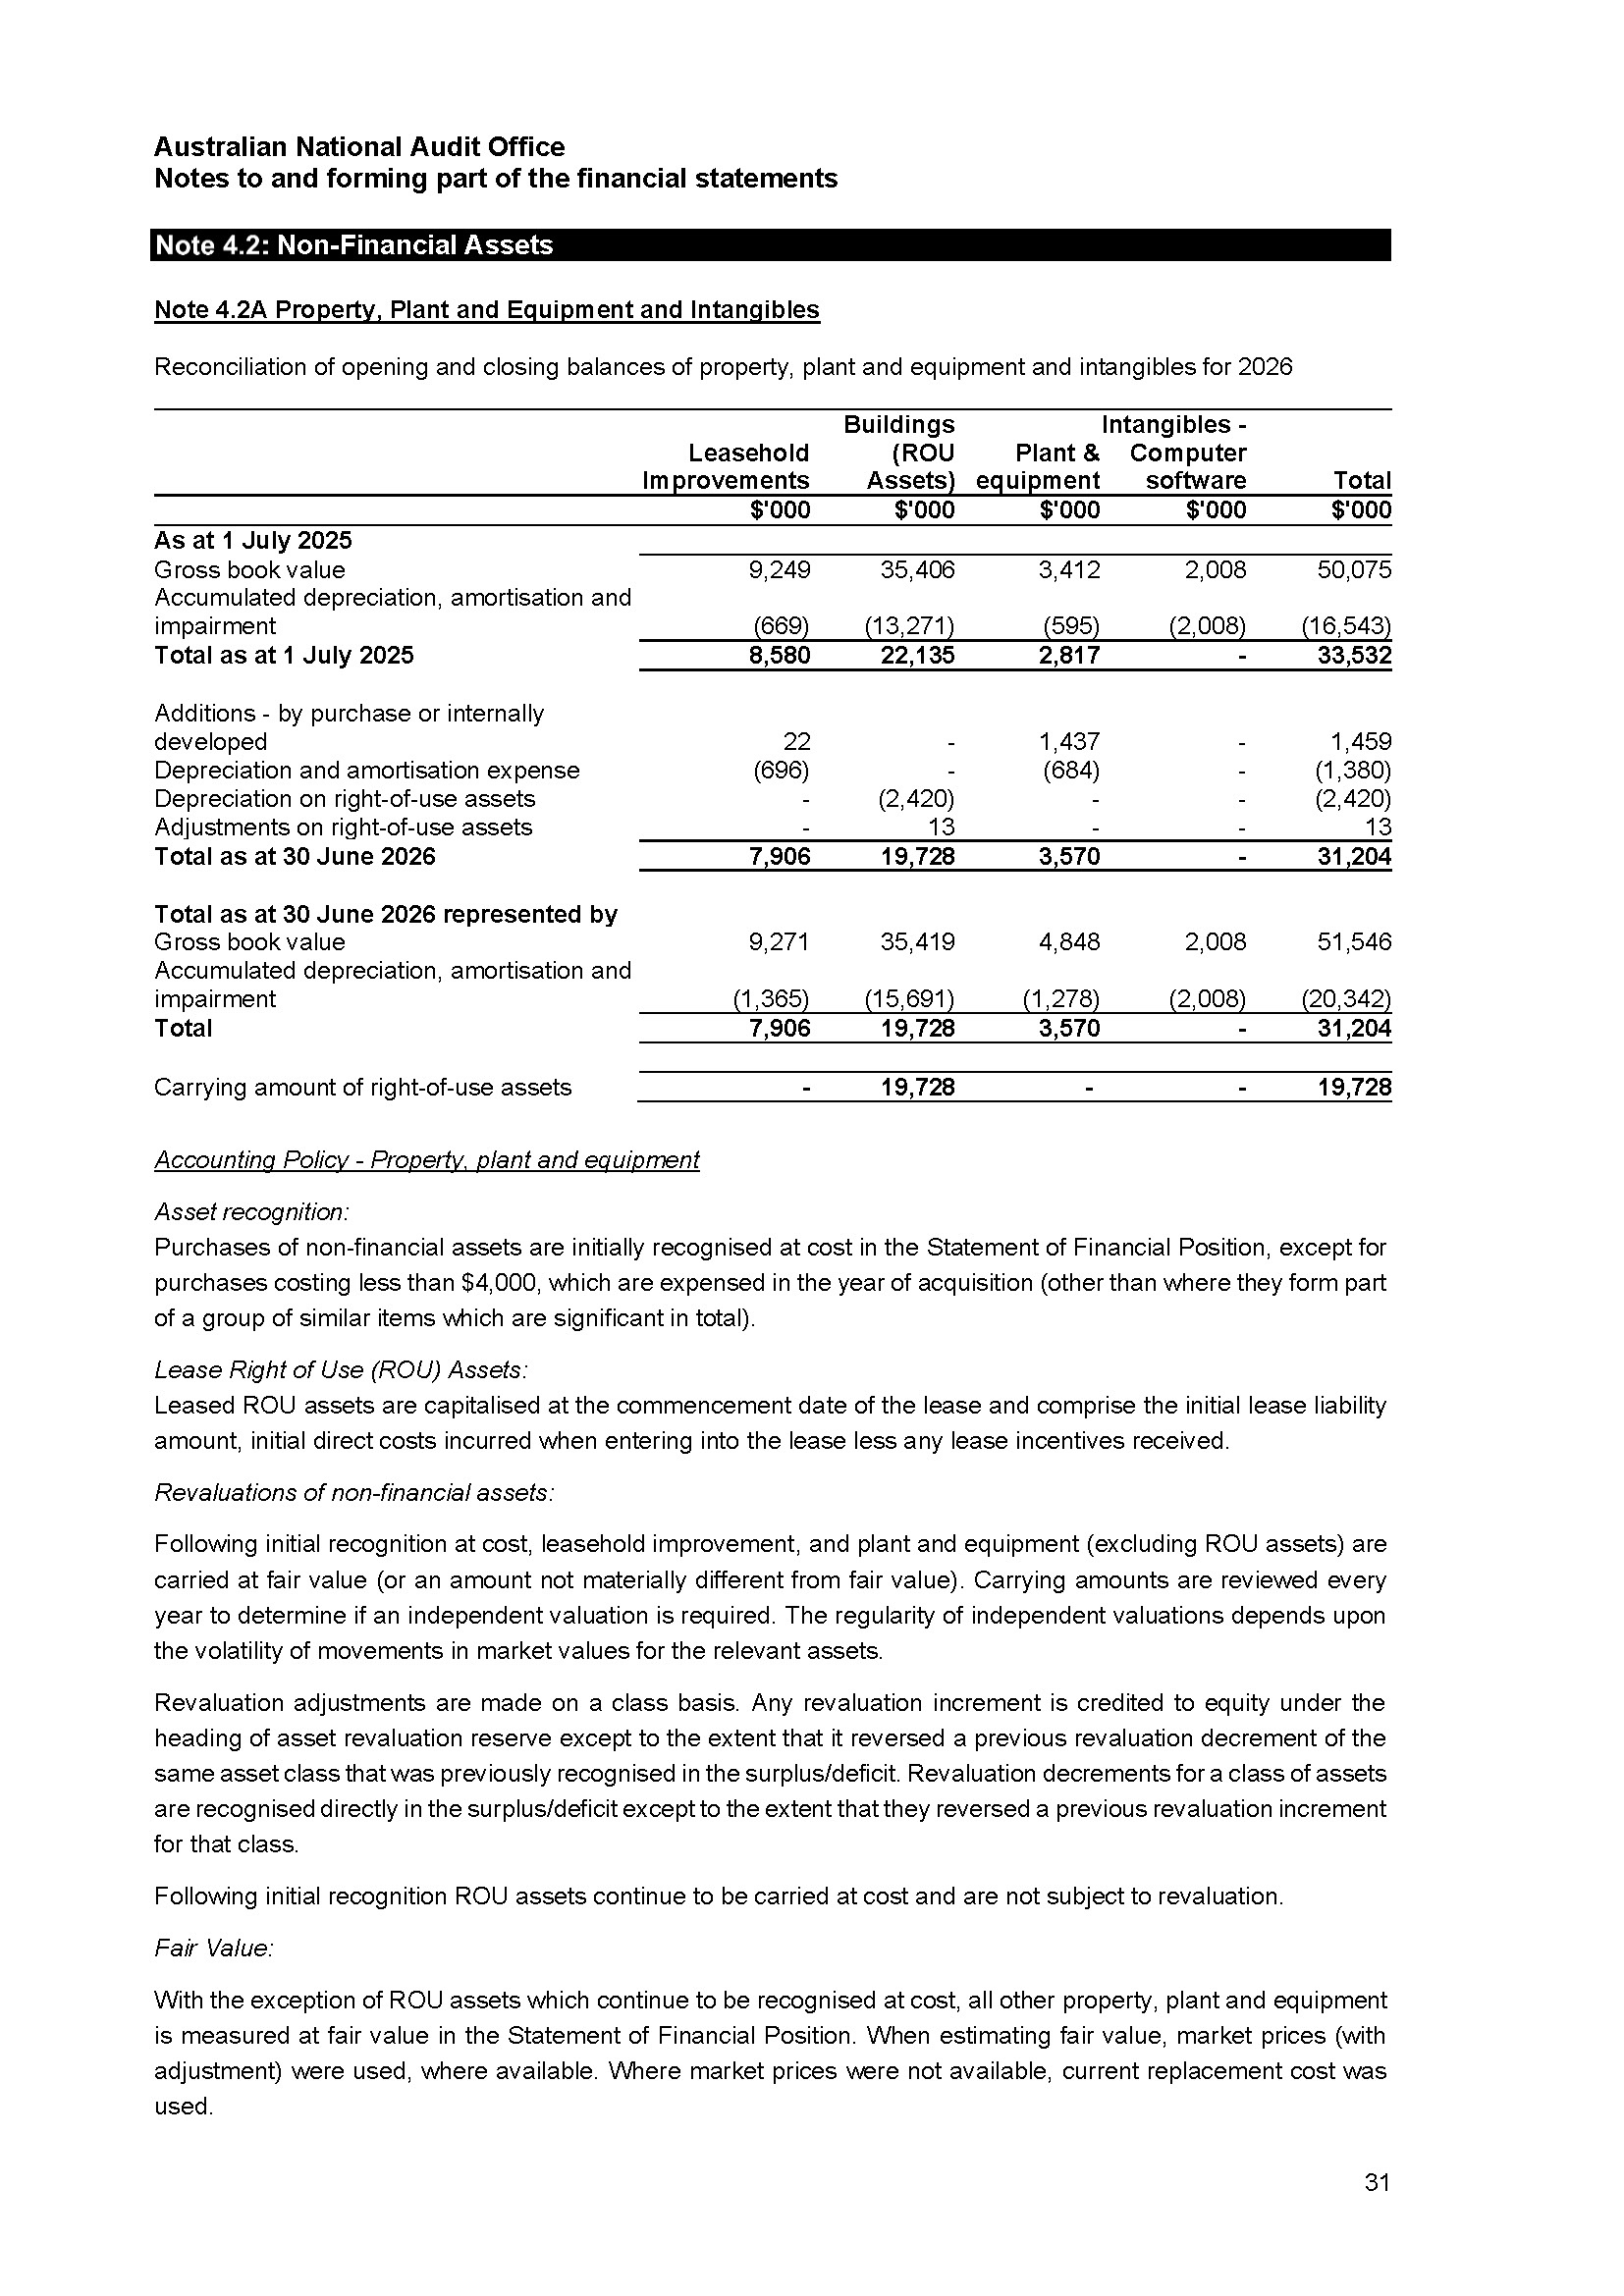
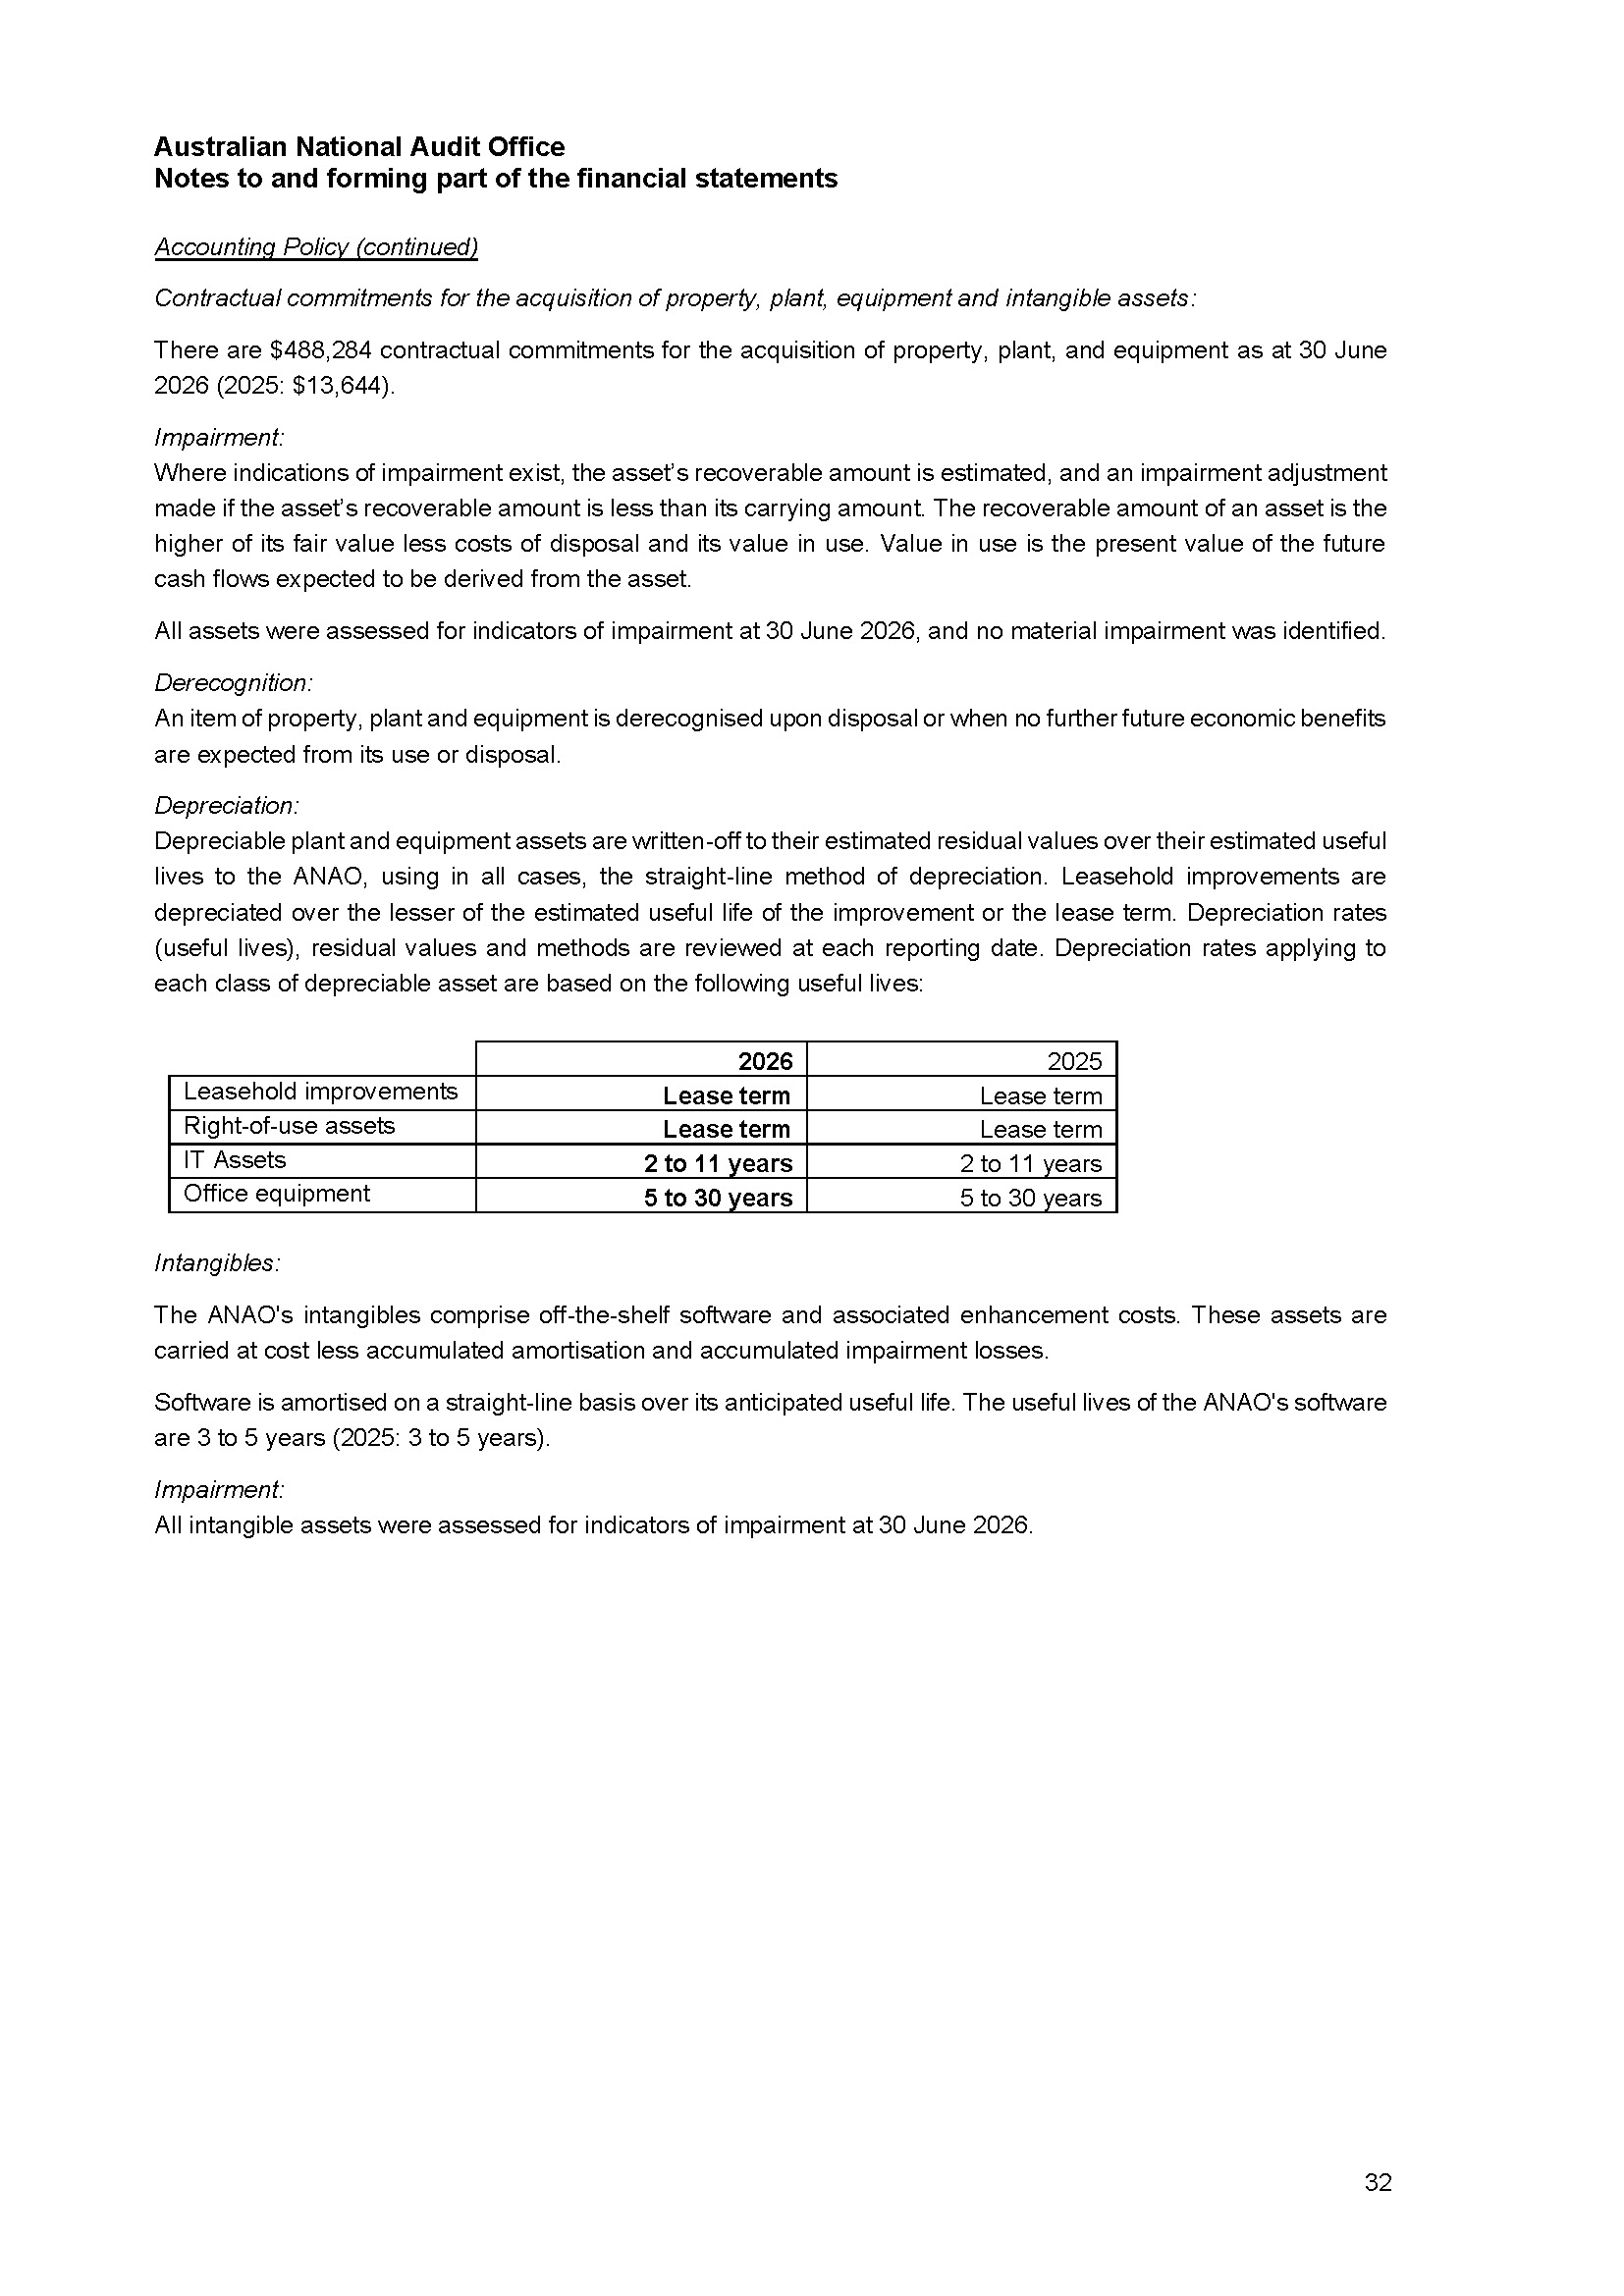
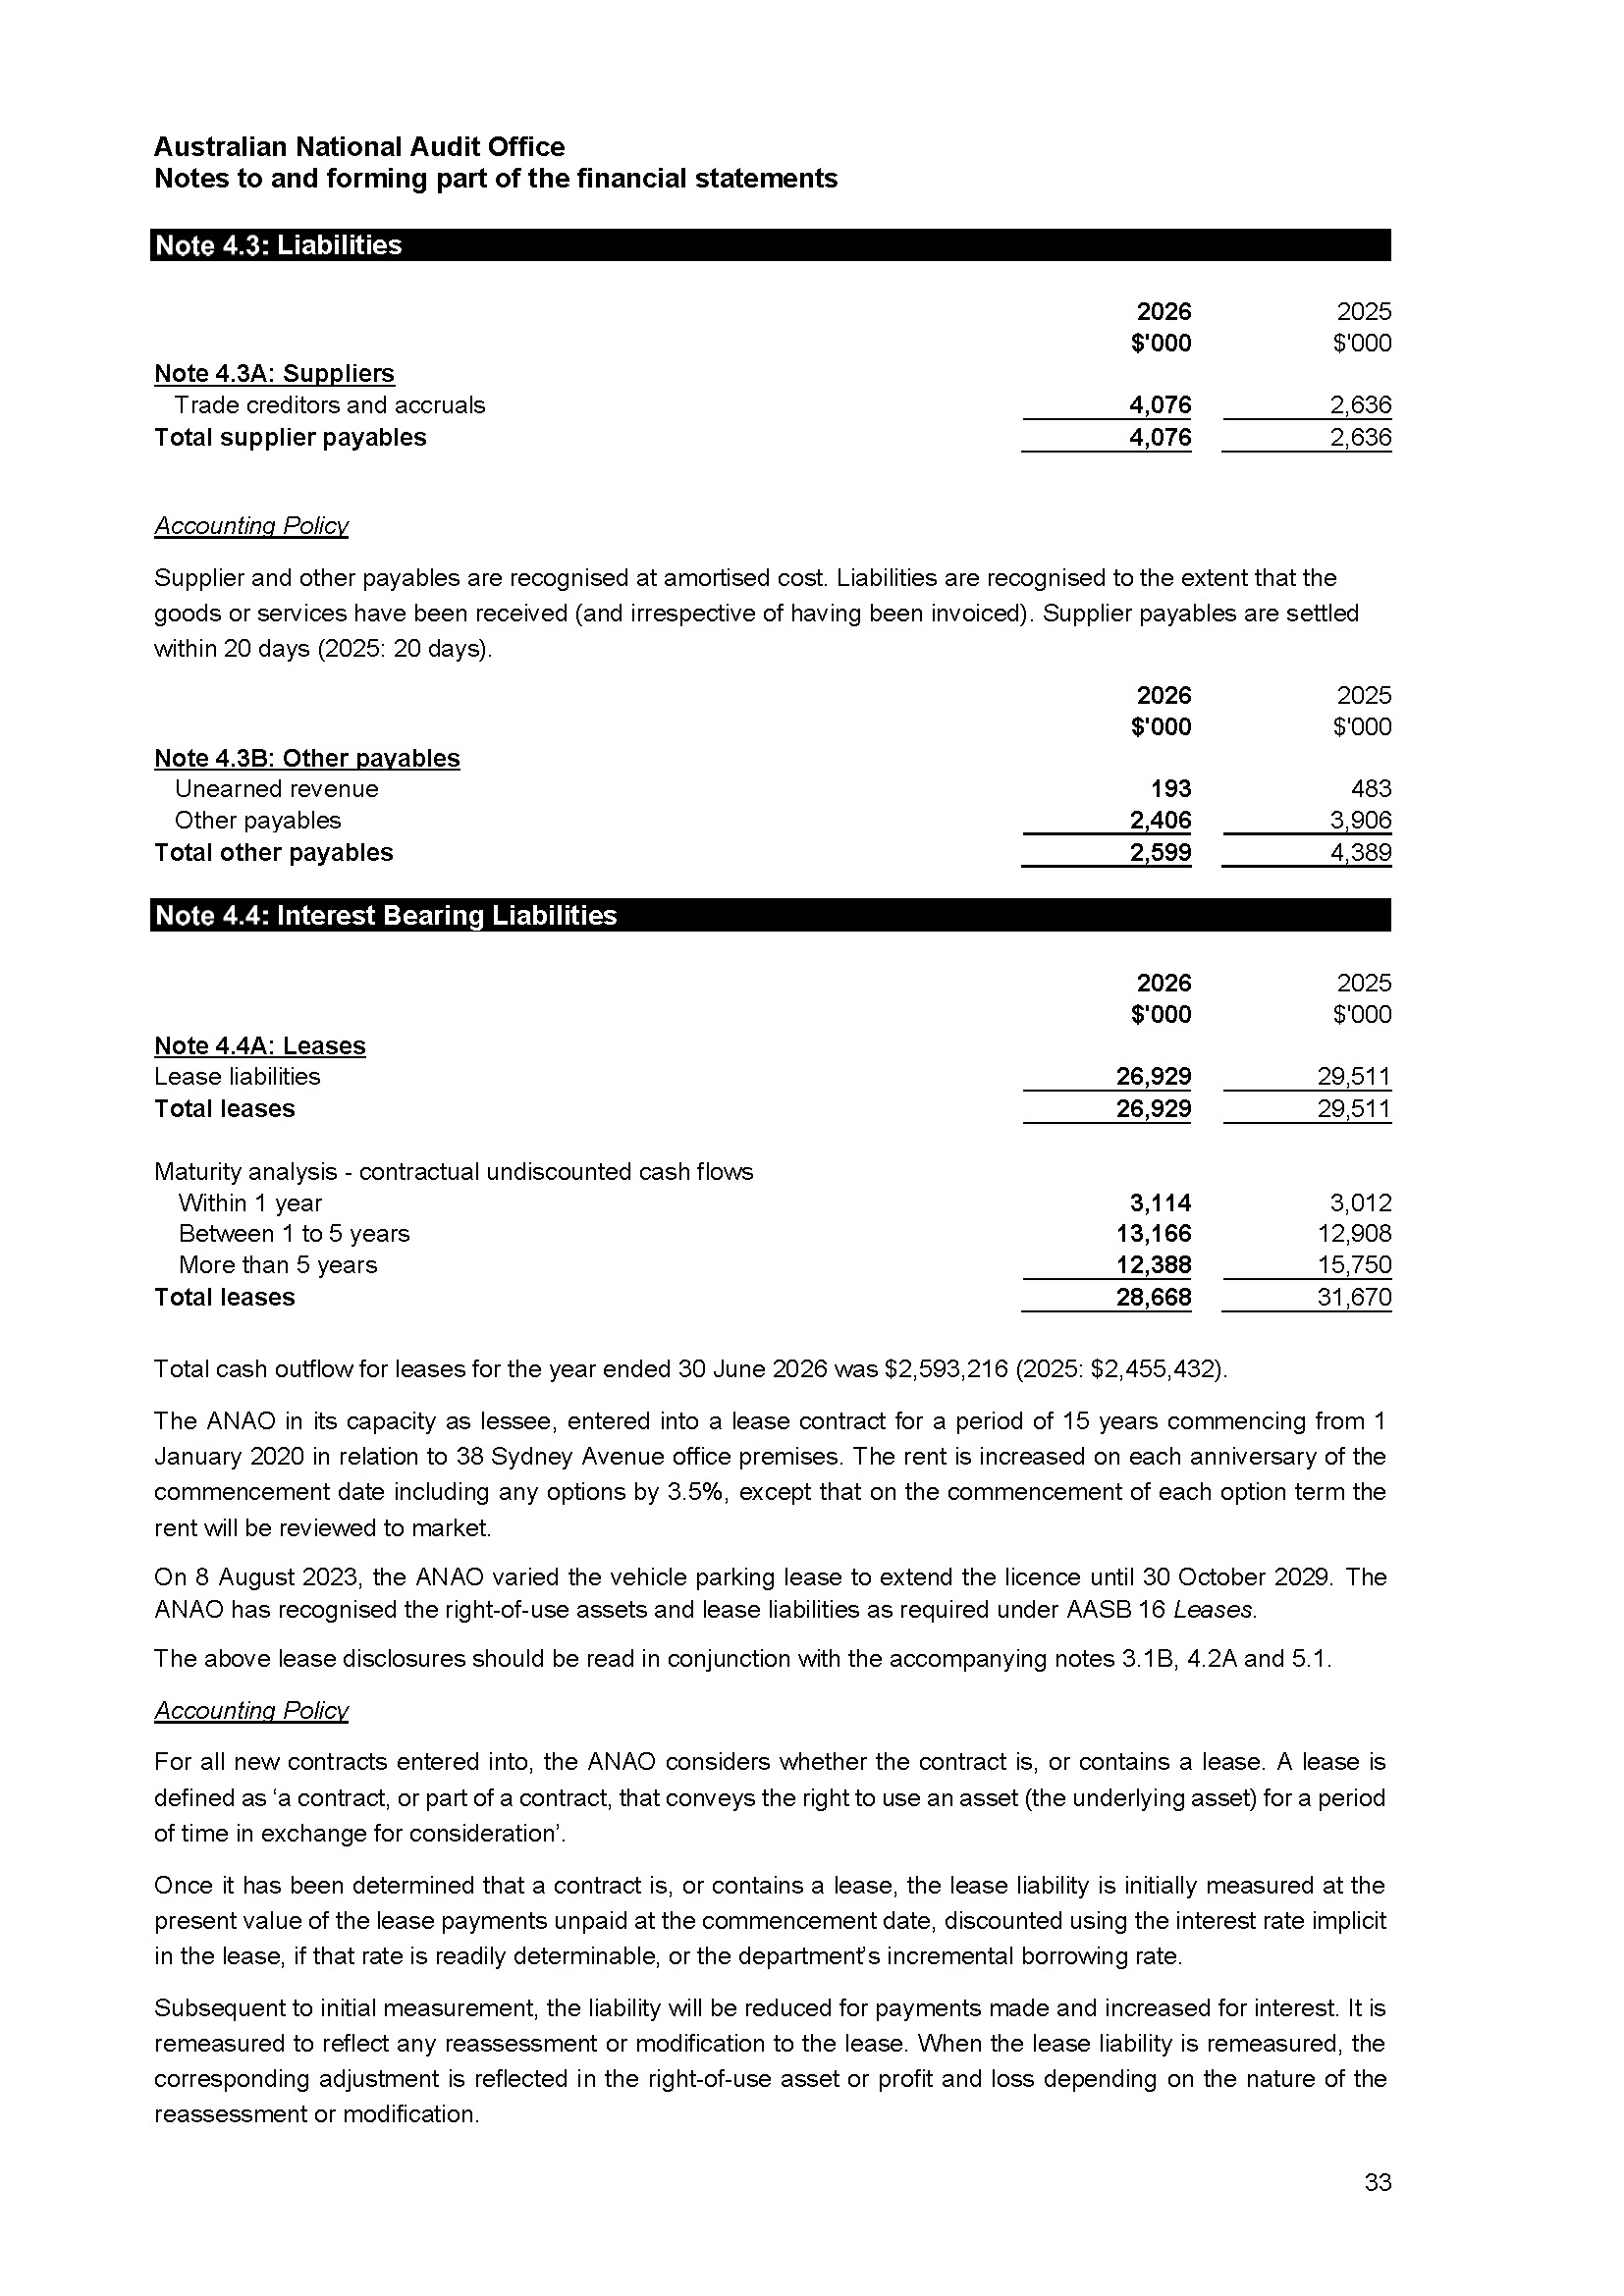
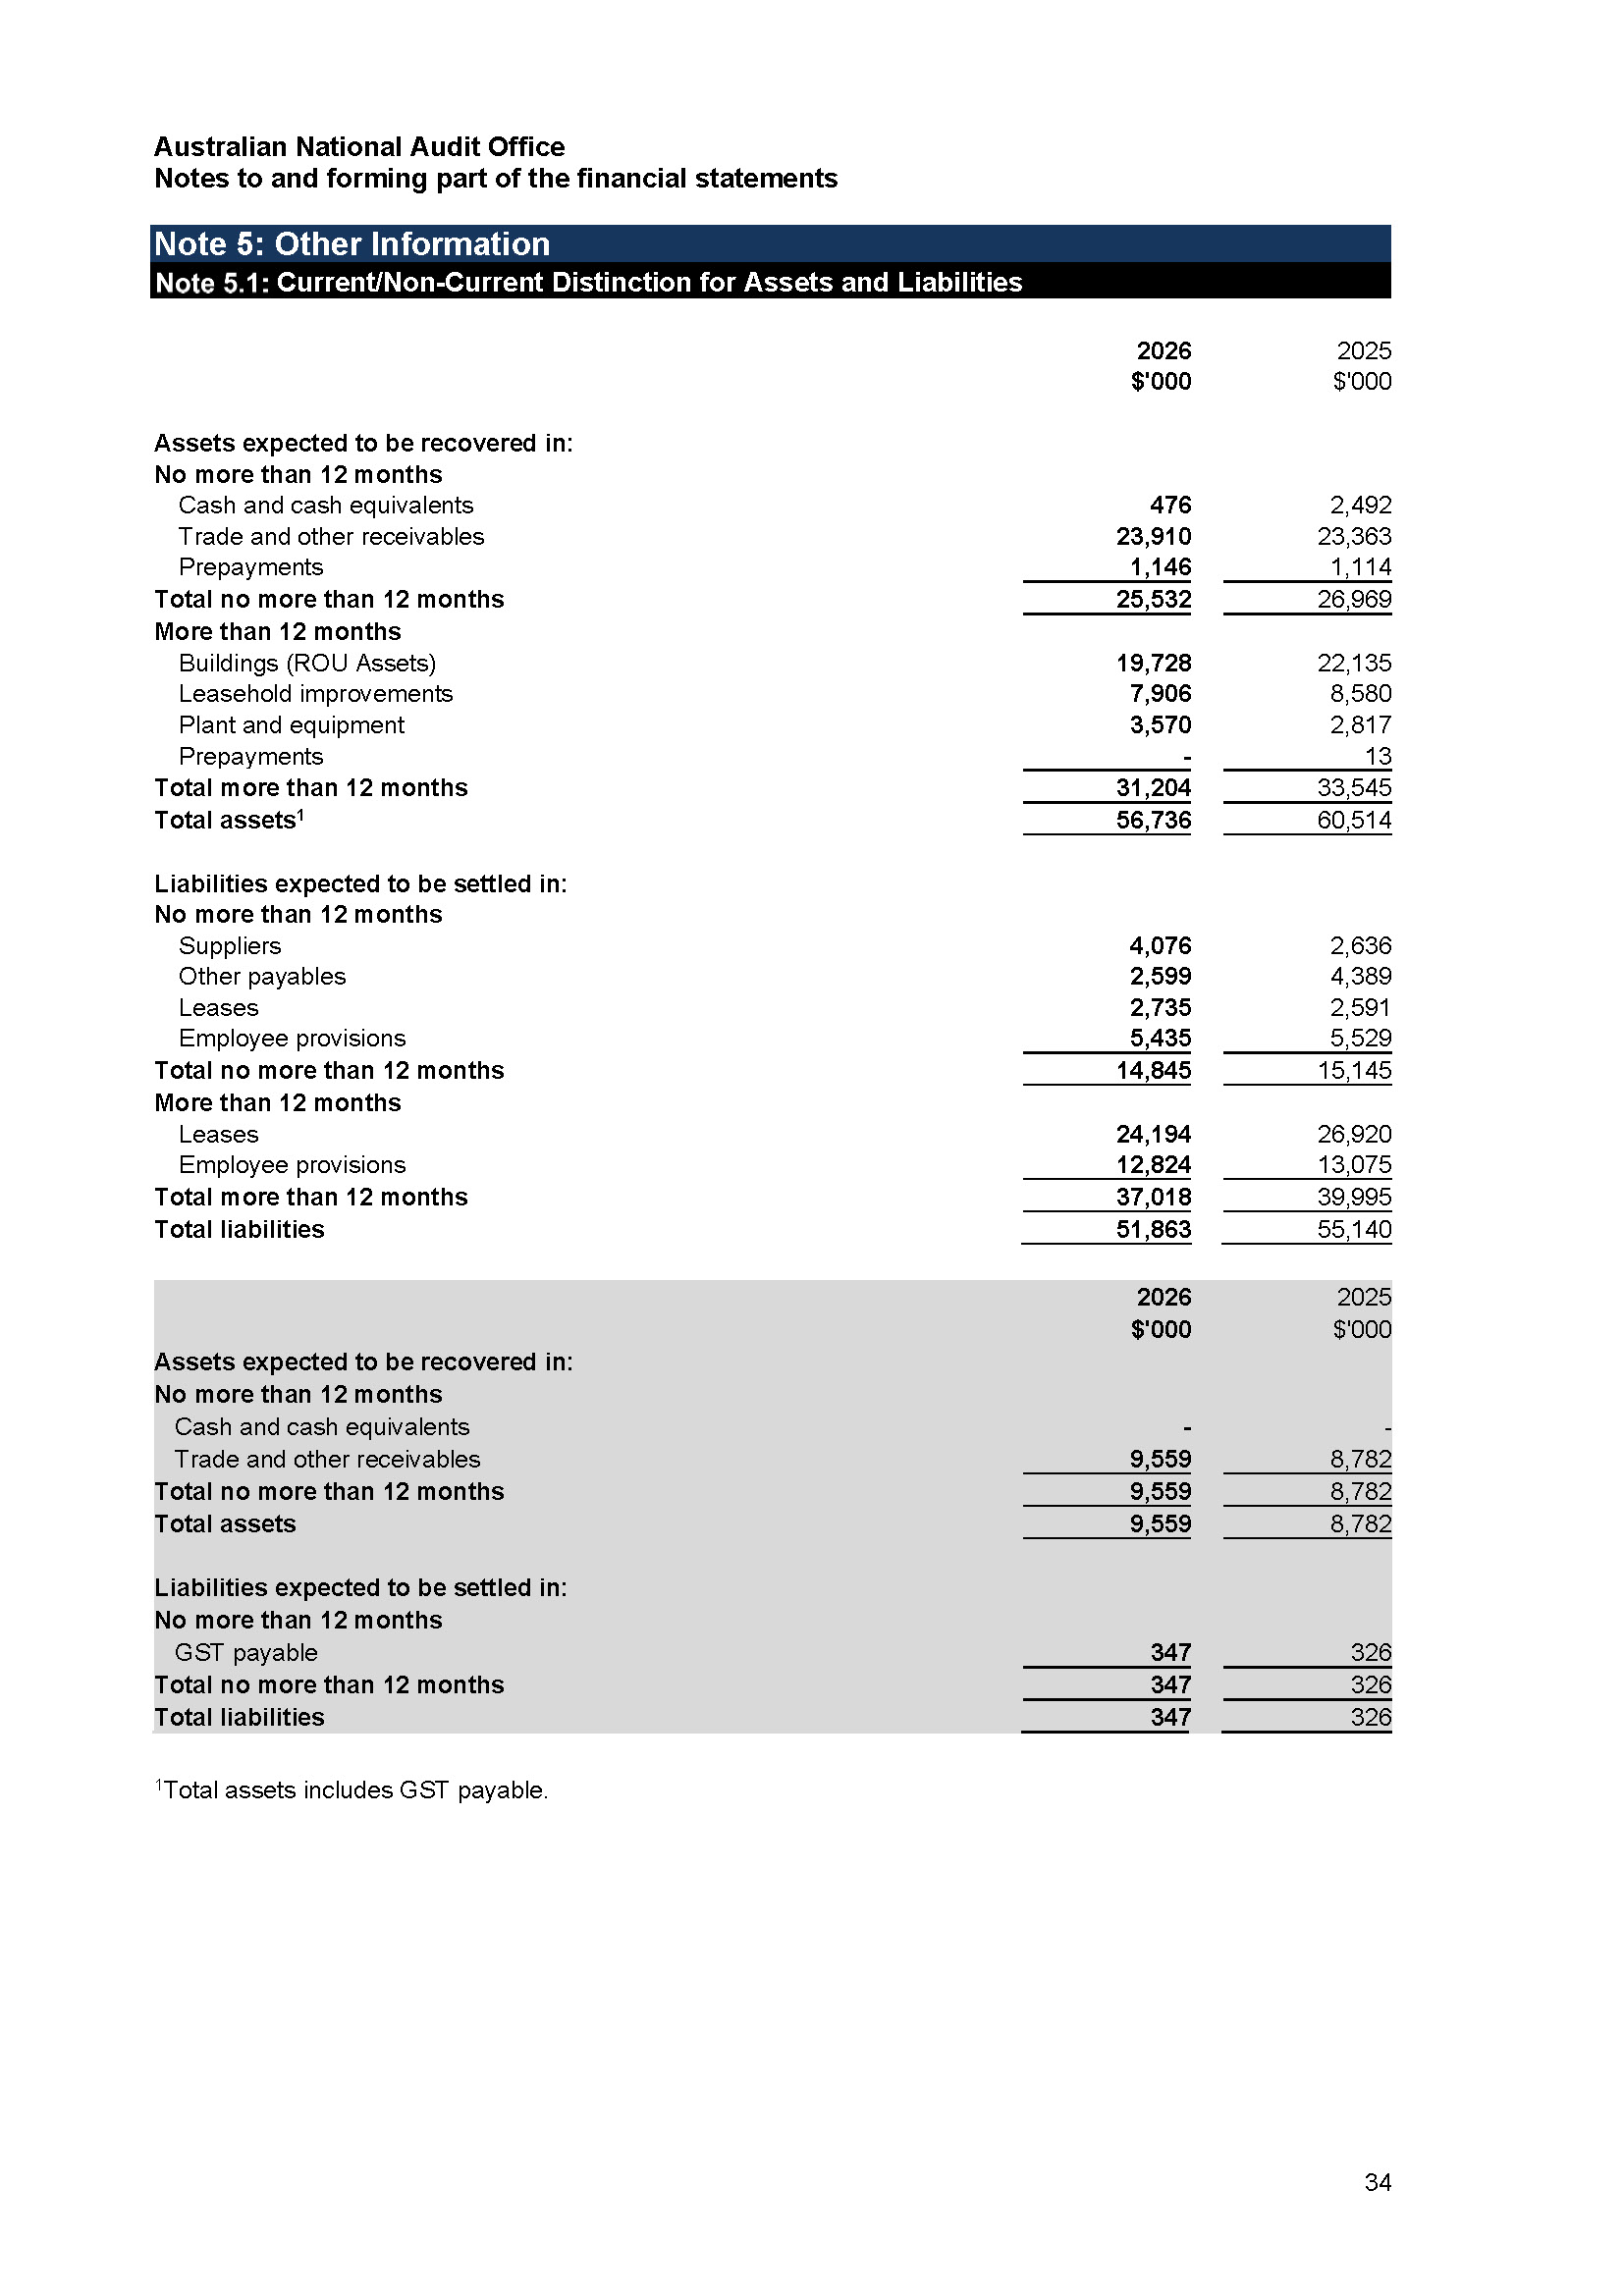
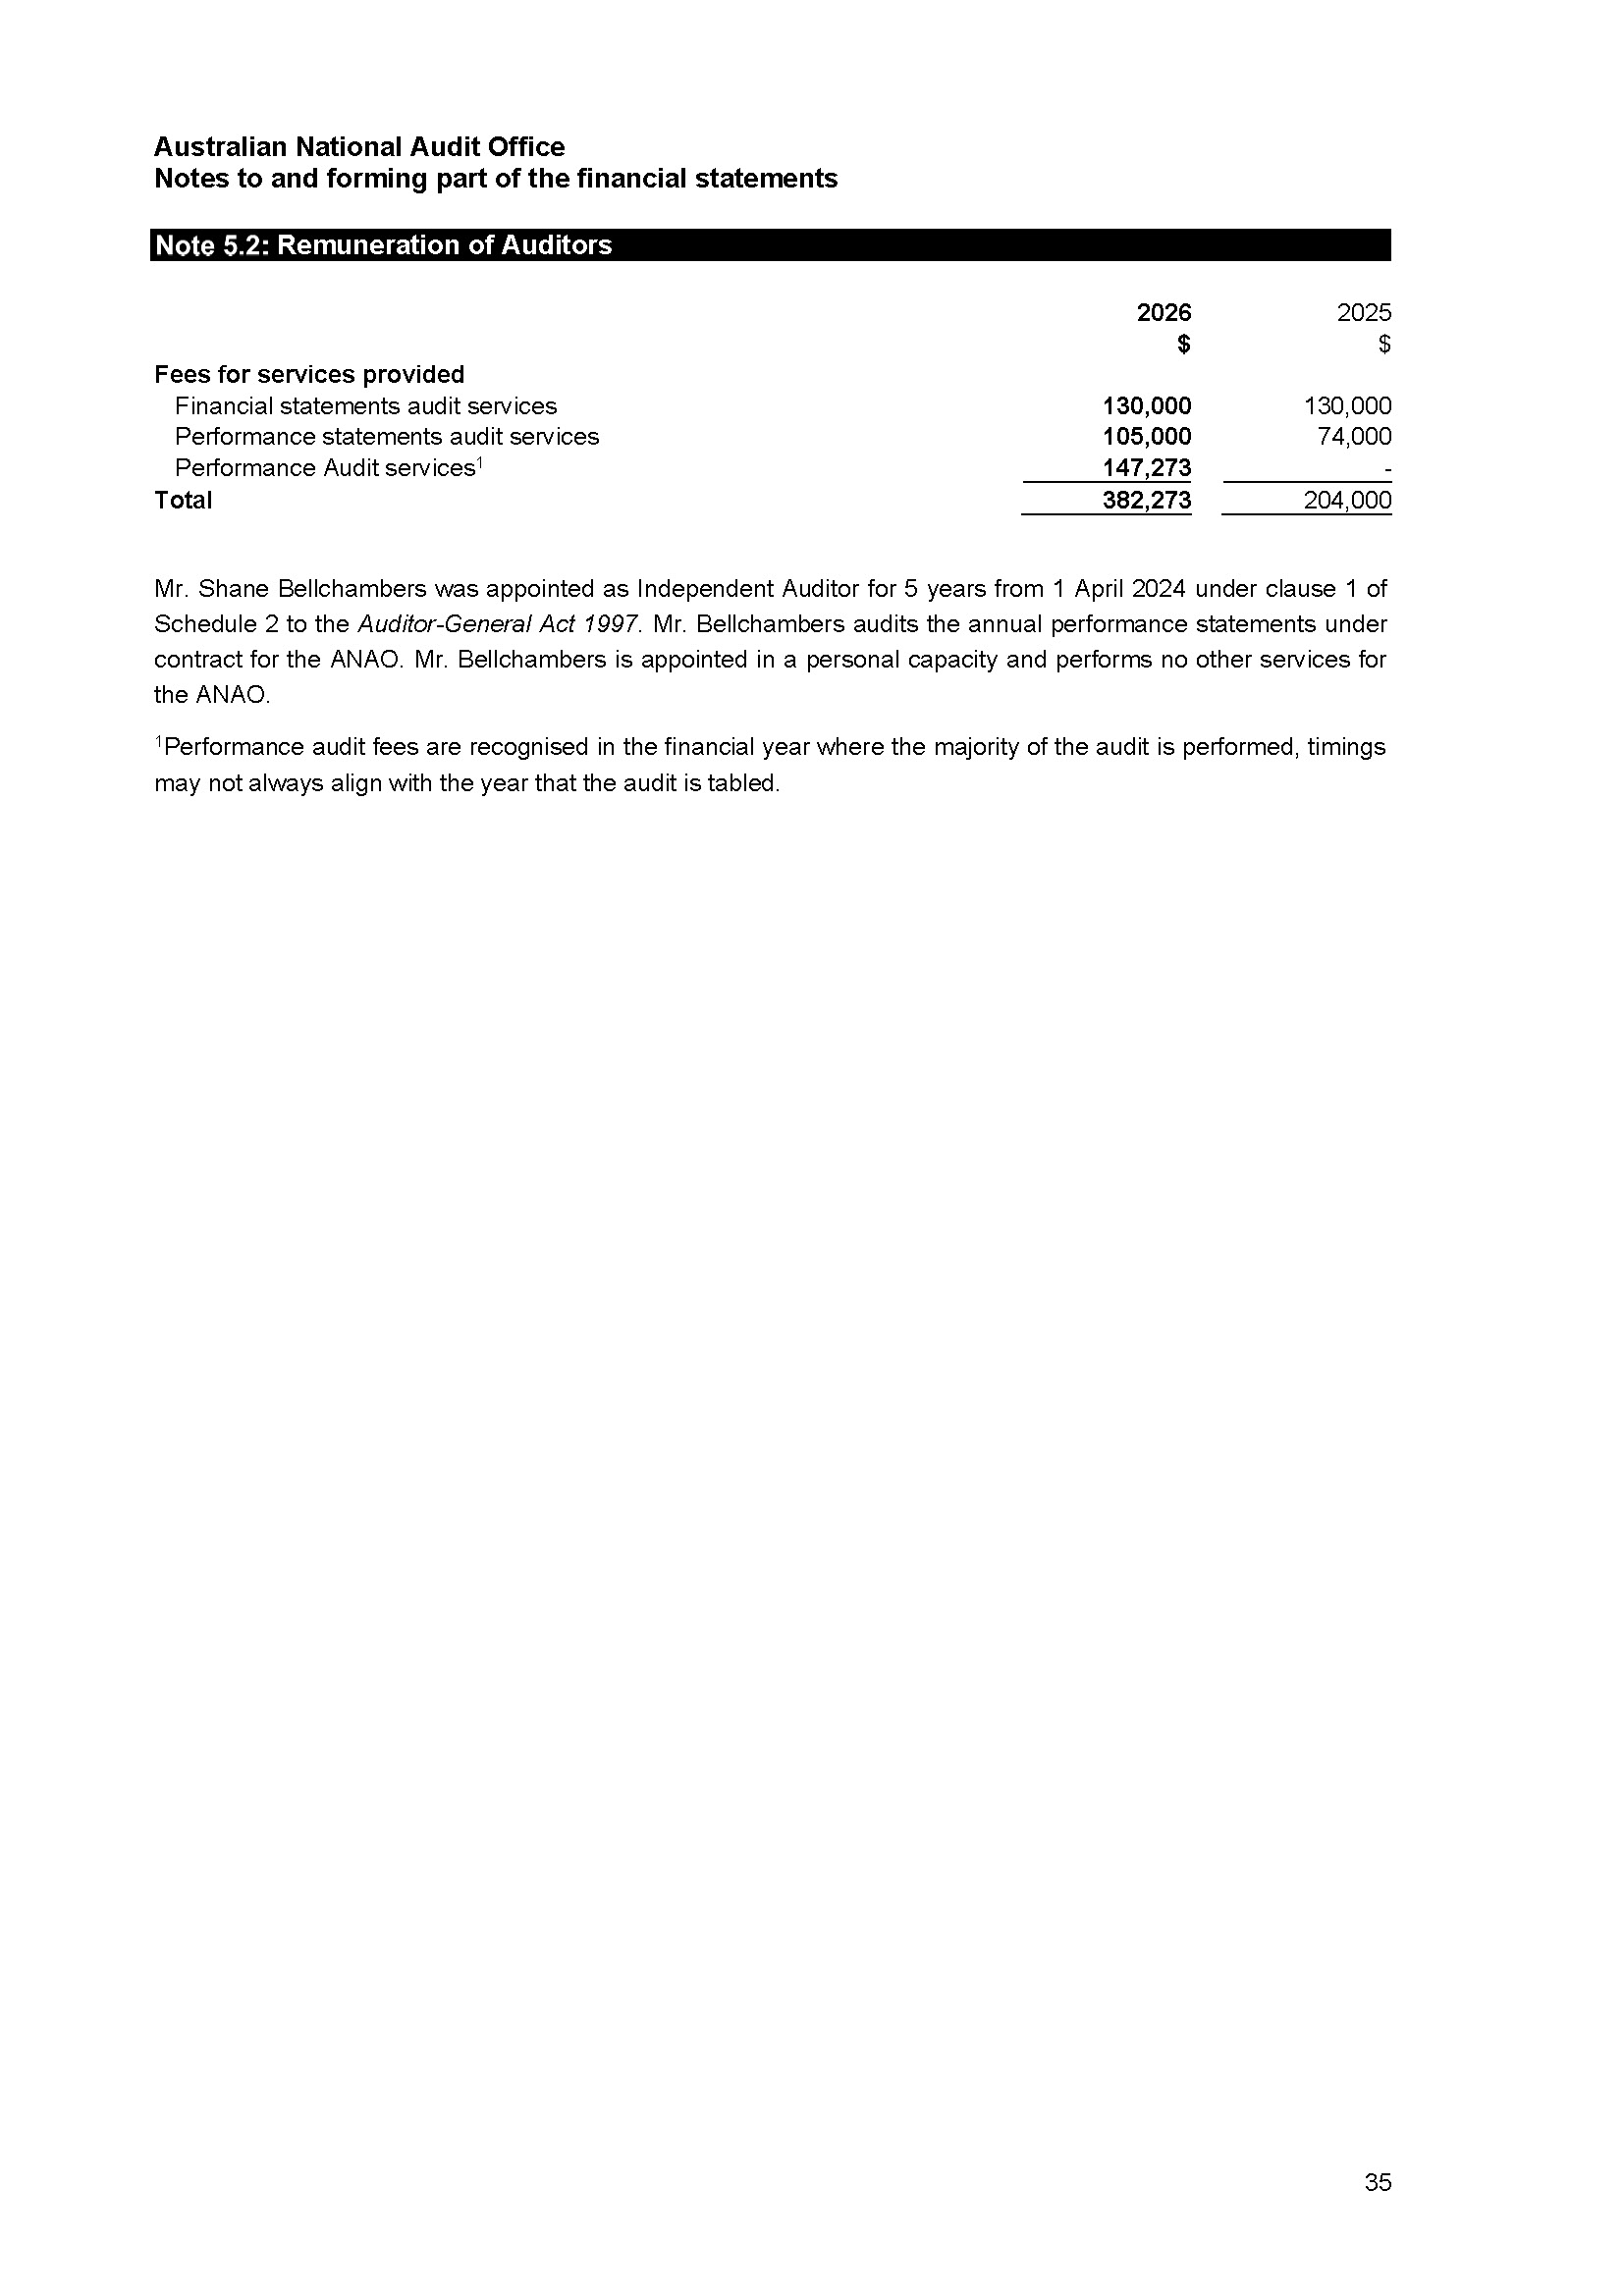
Independent Auditor’s report
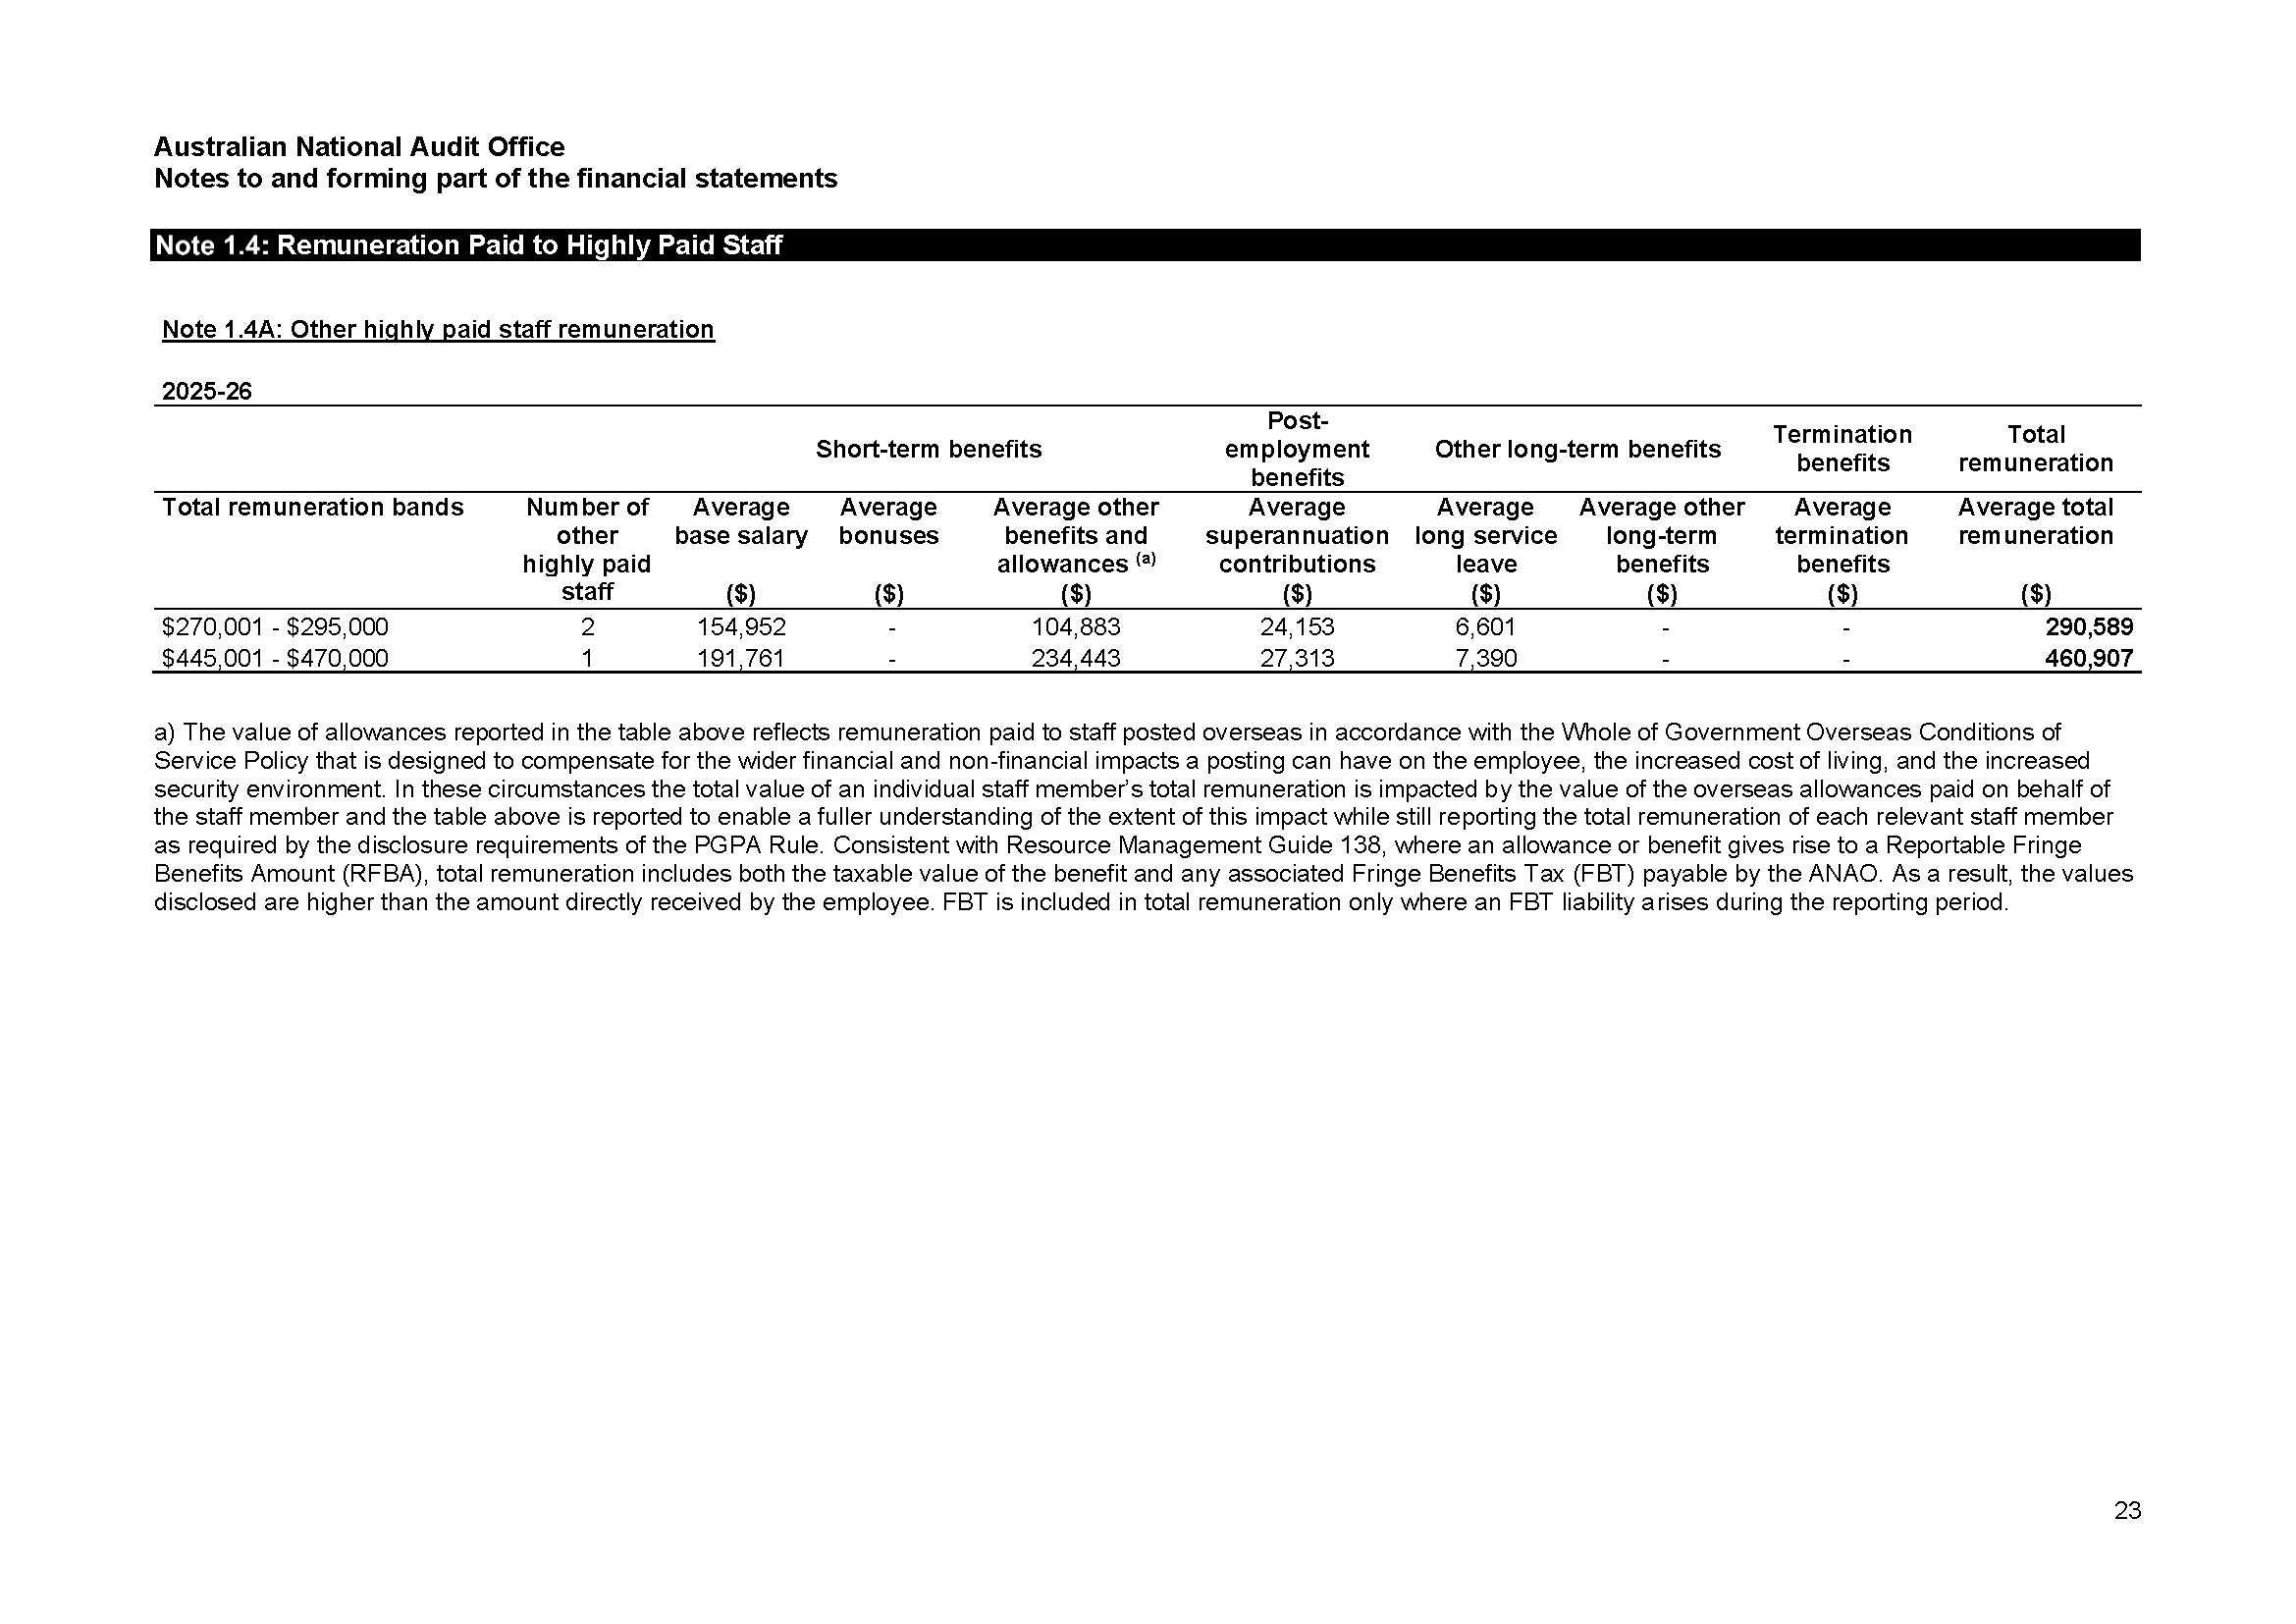
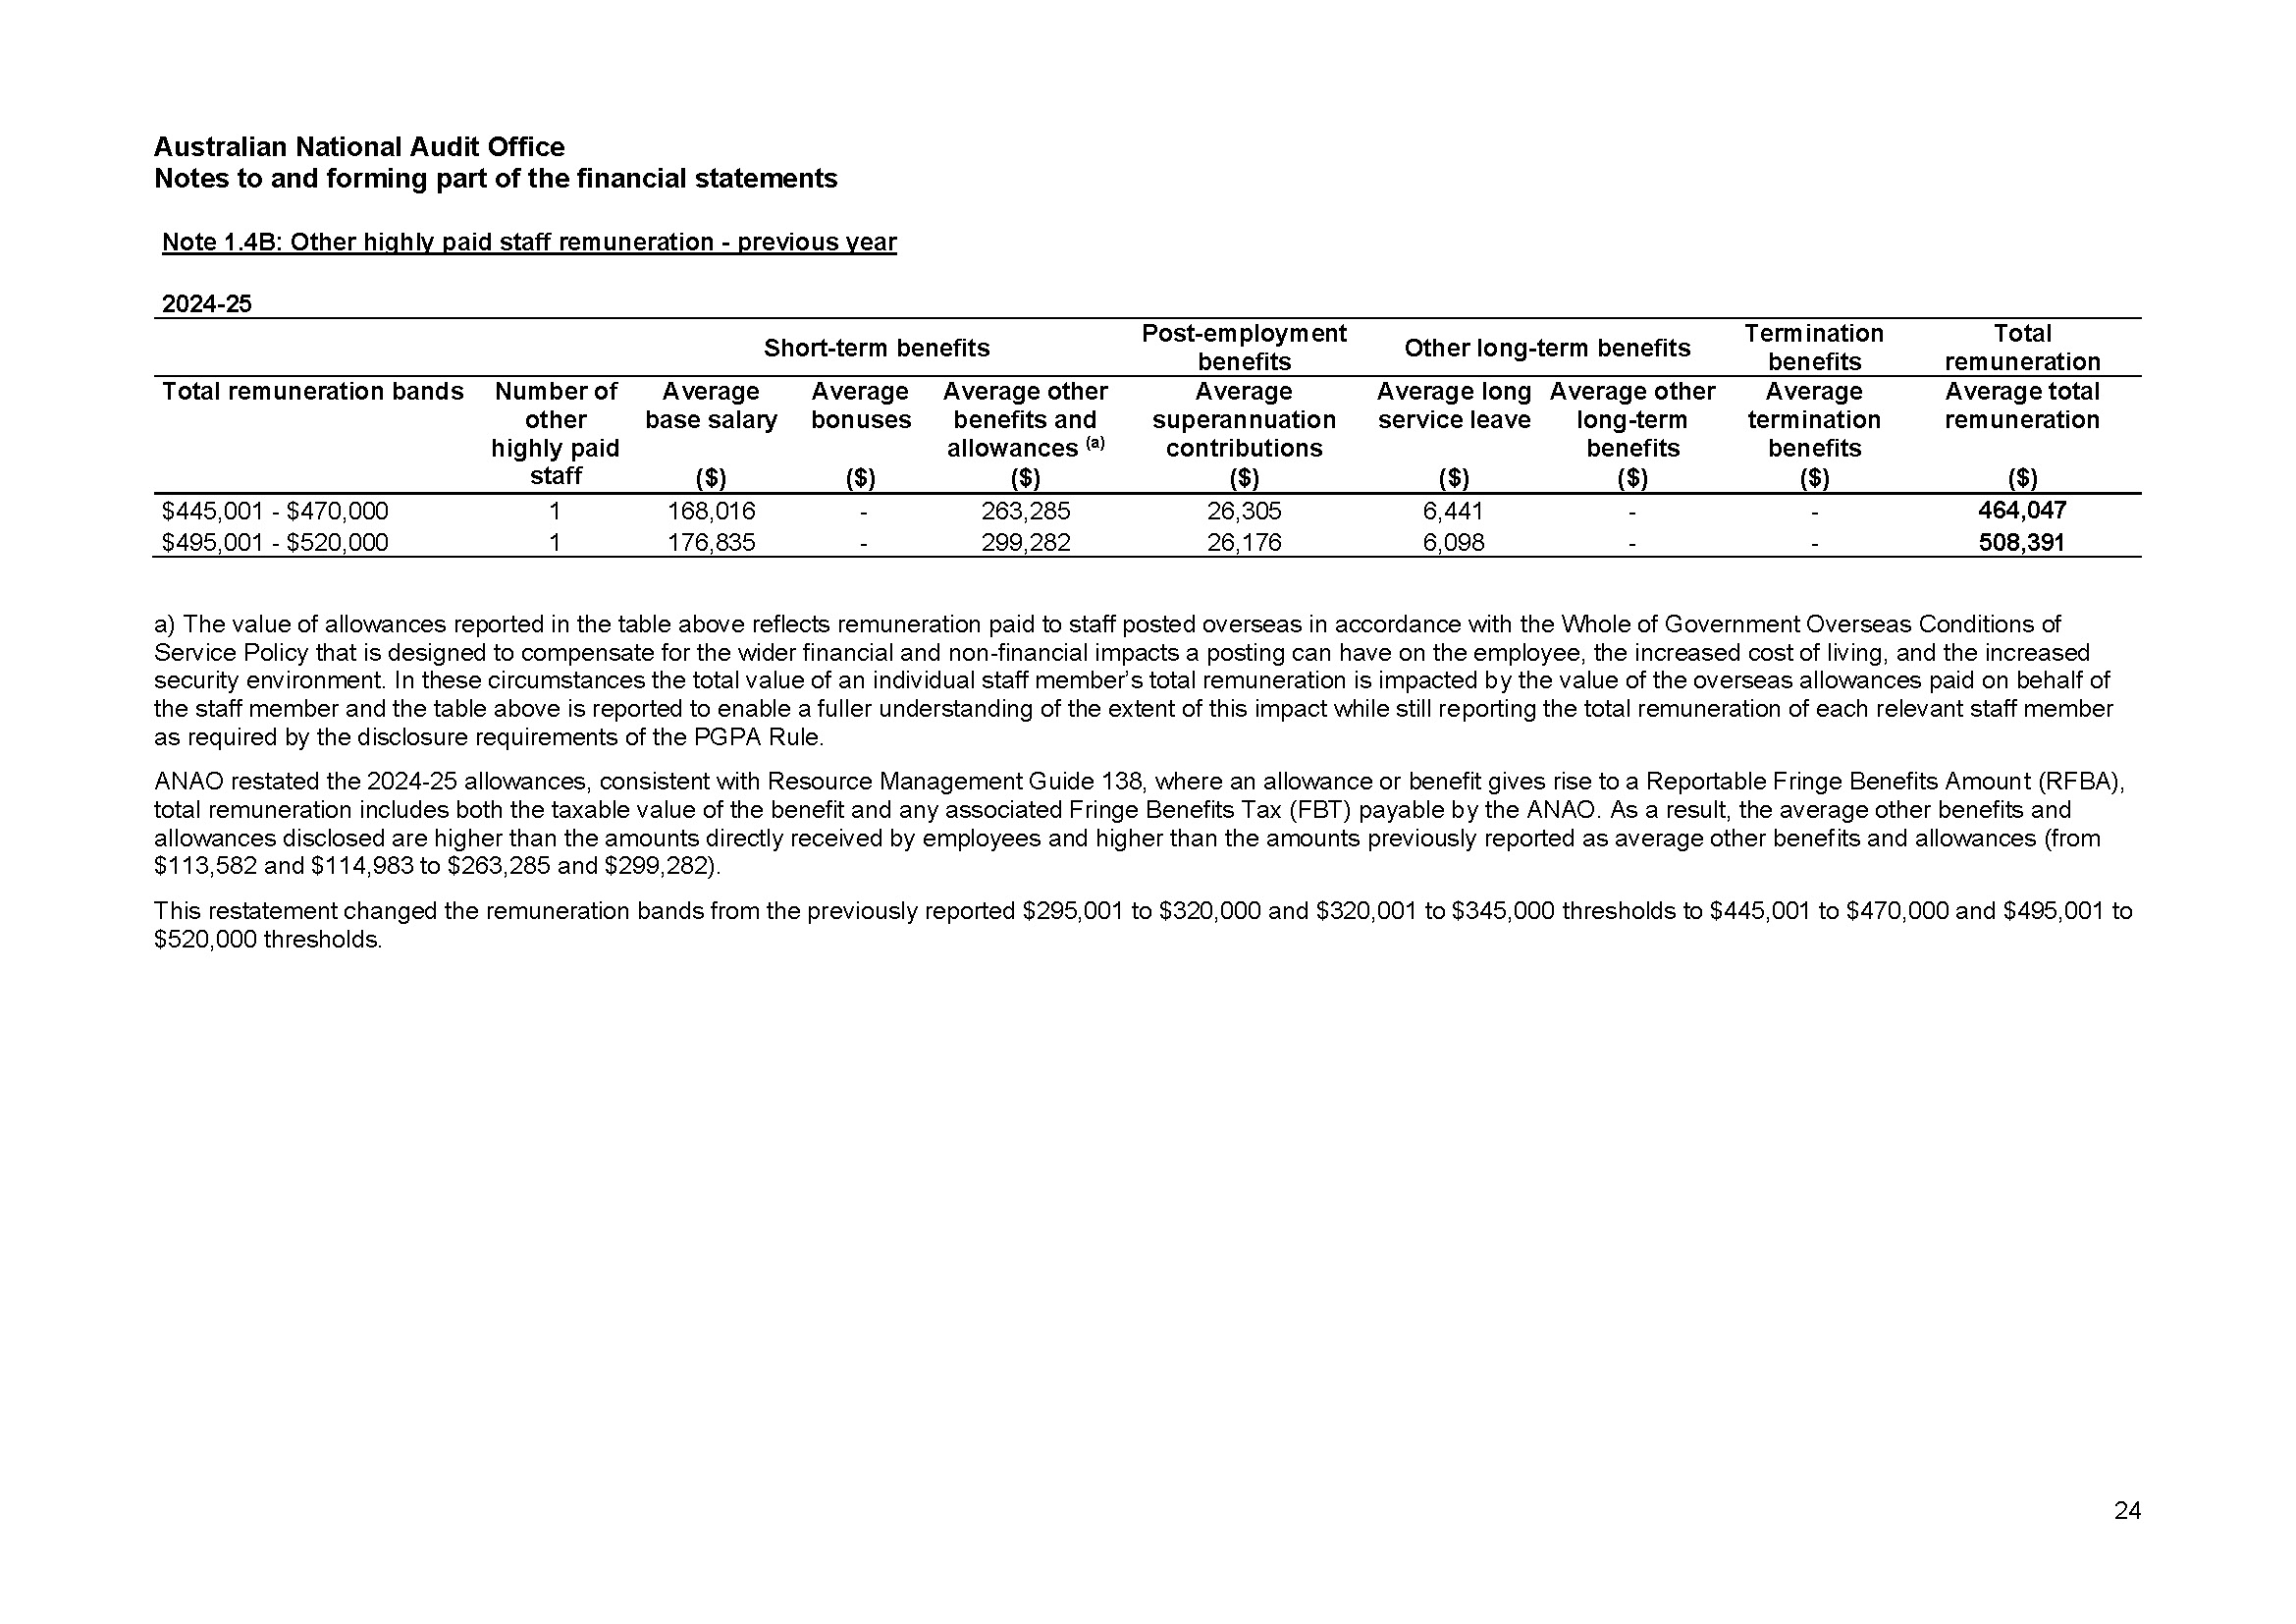
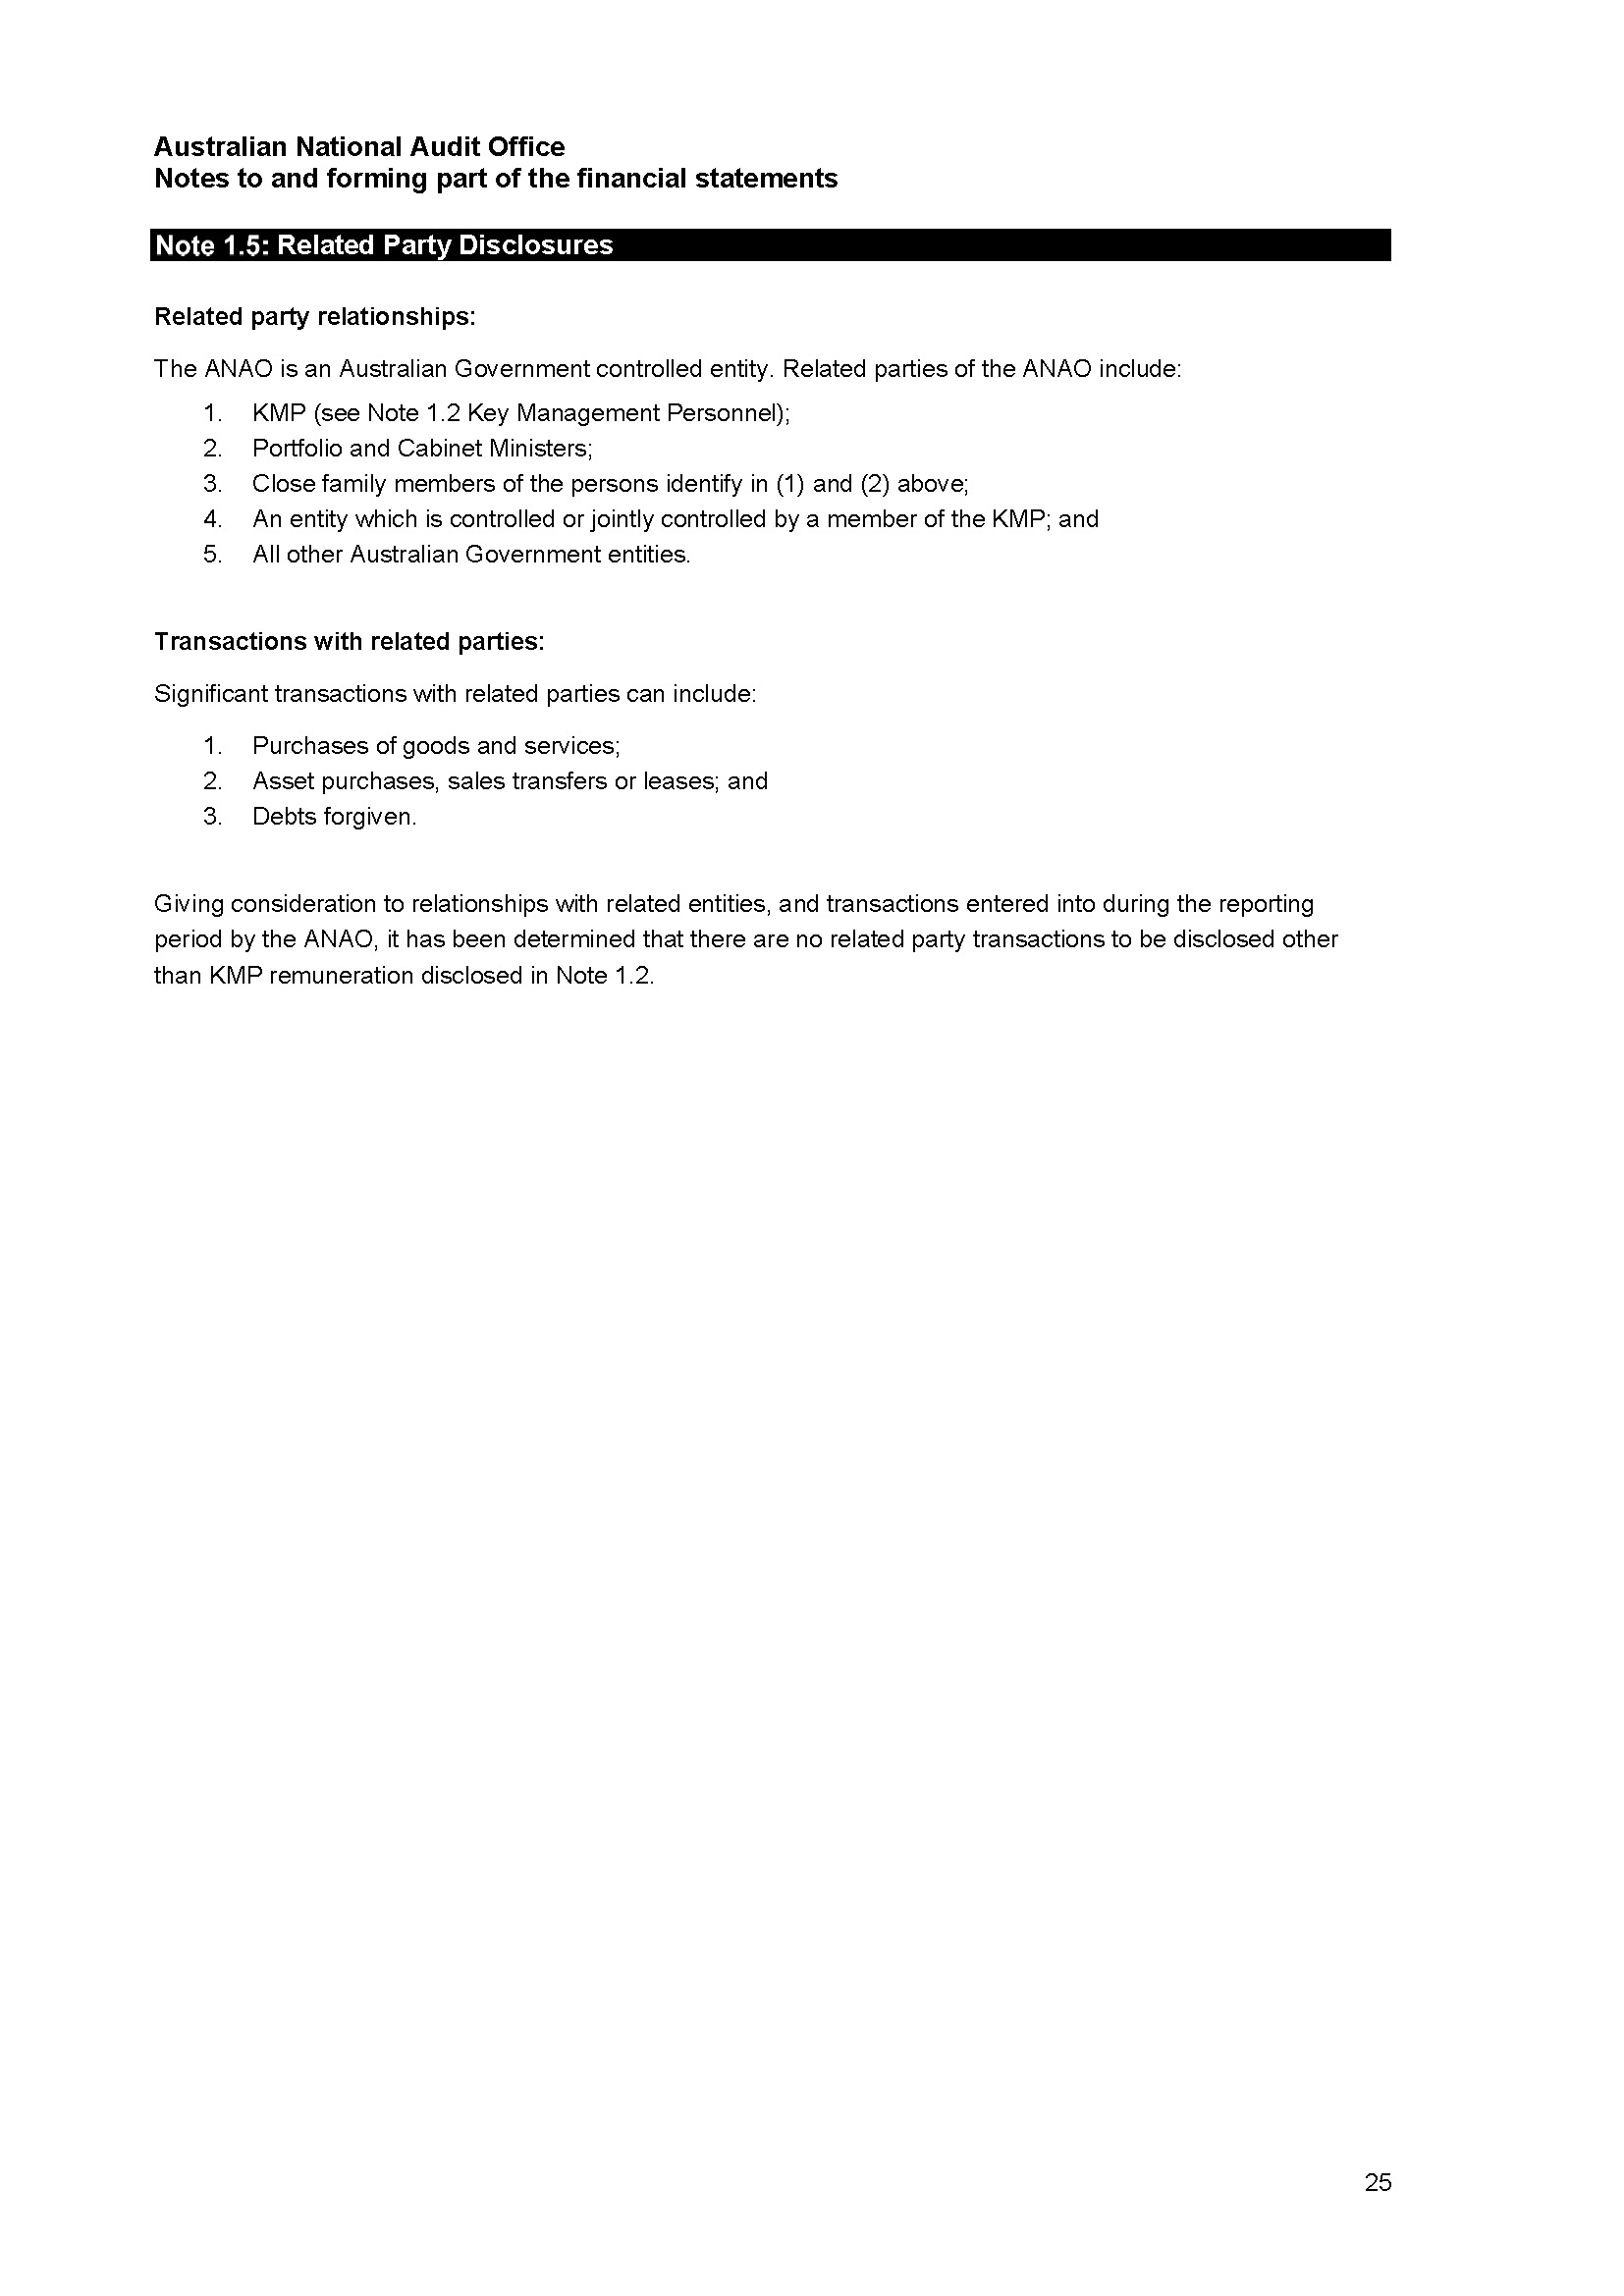
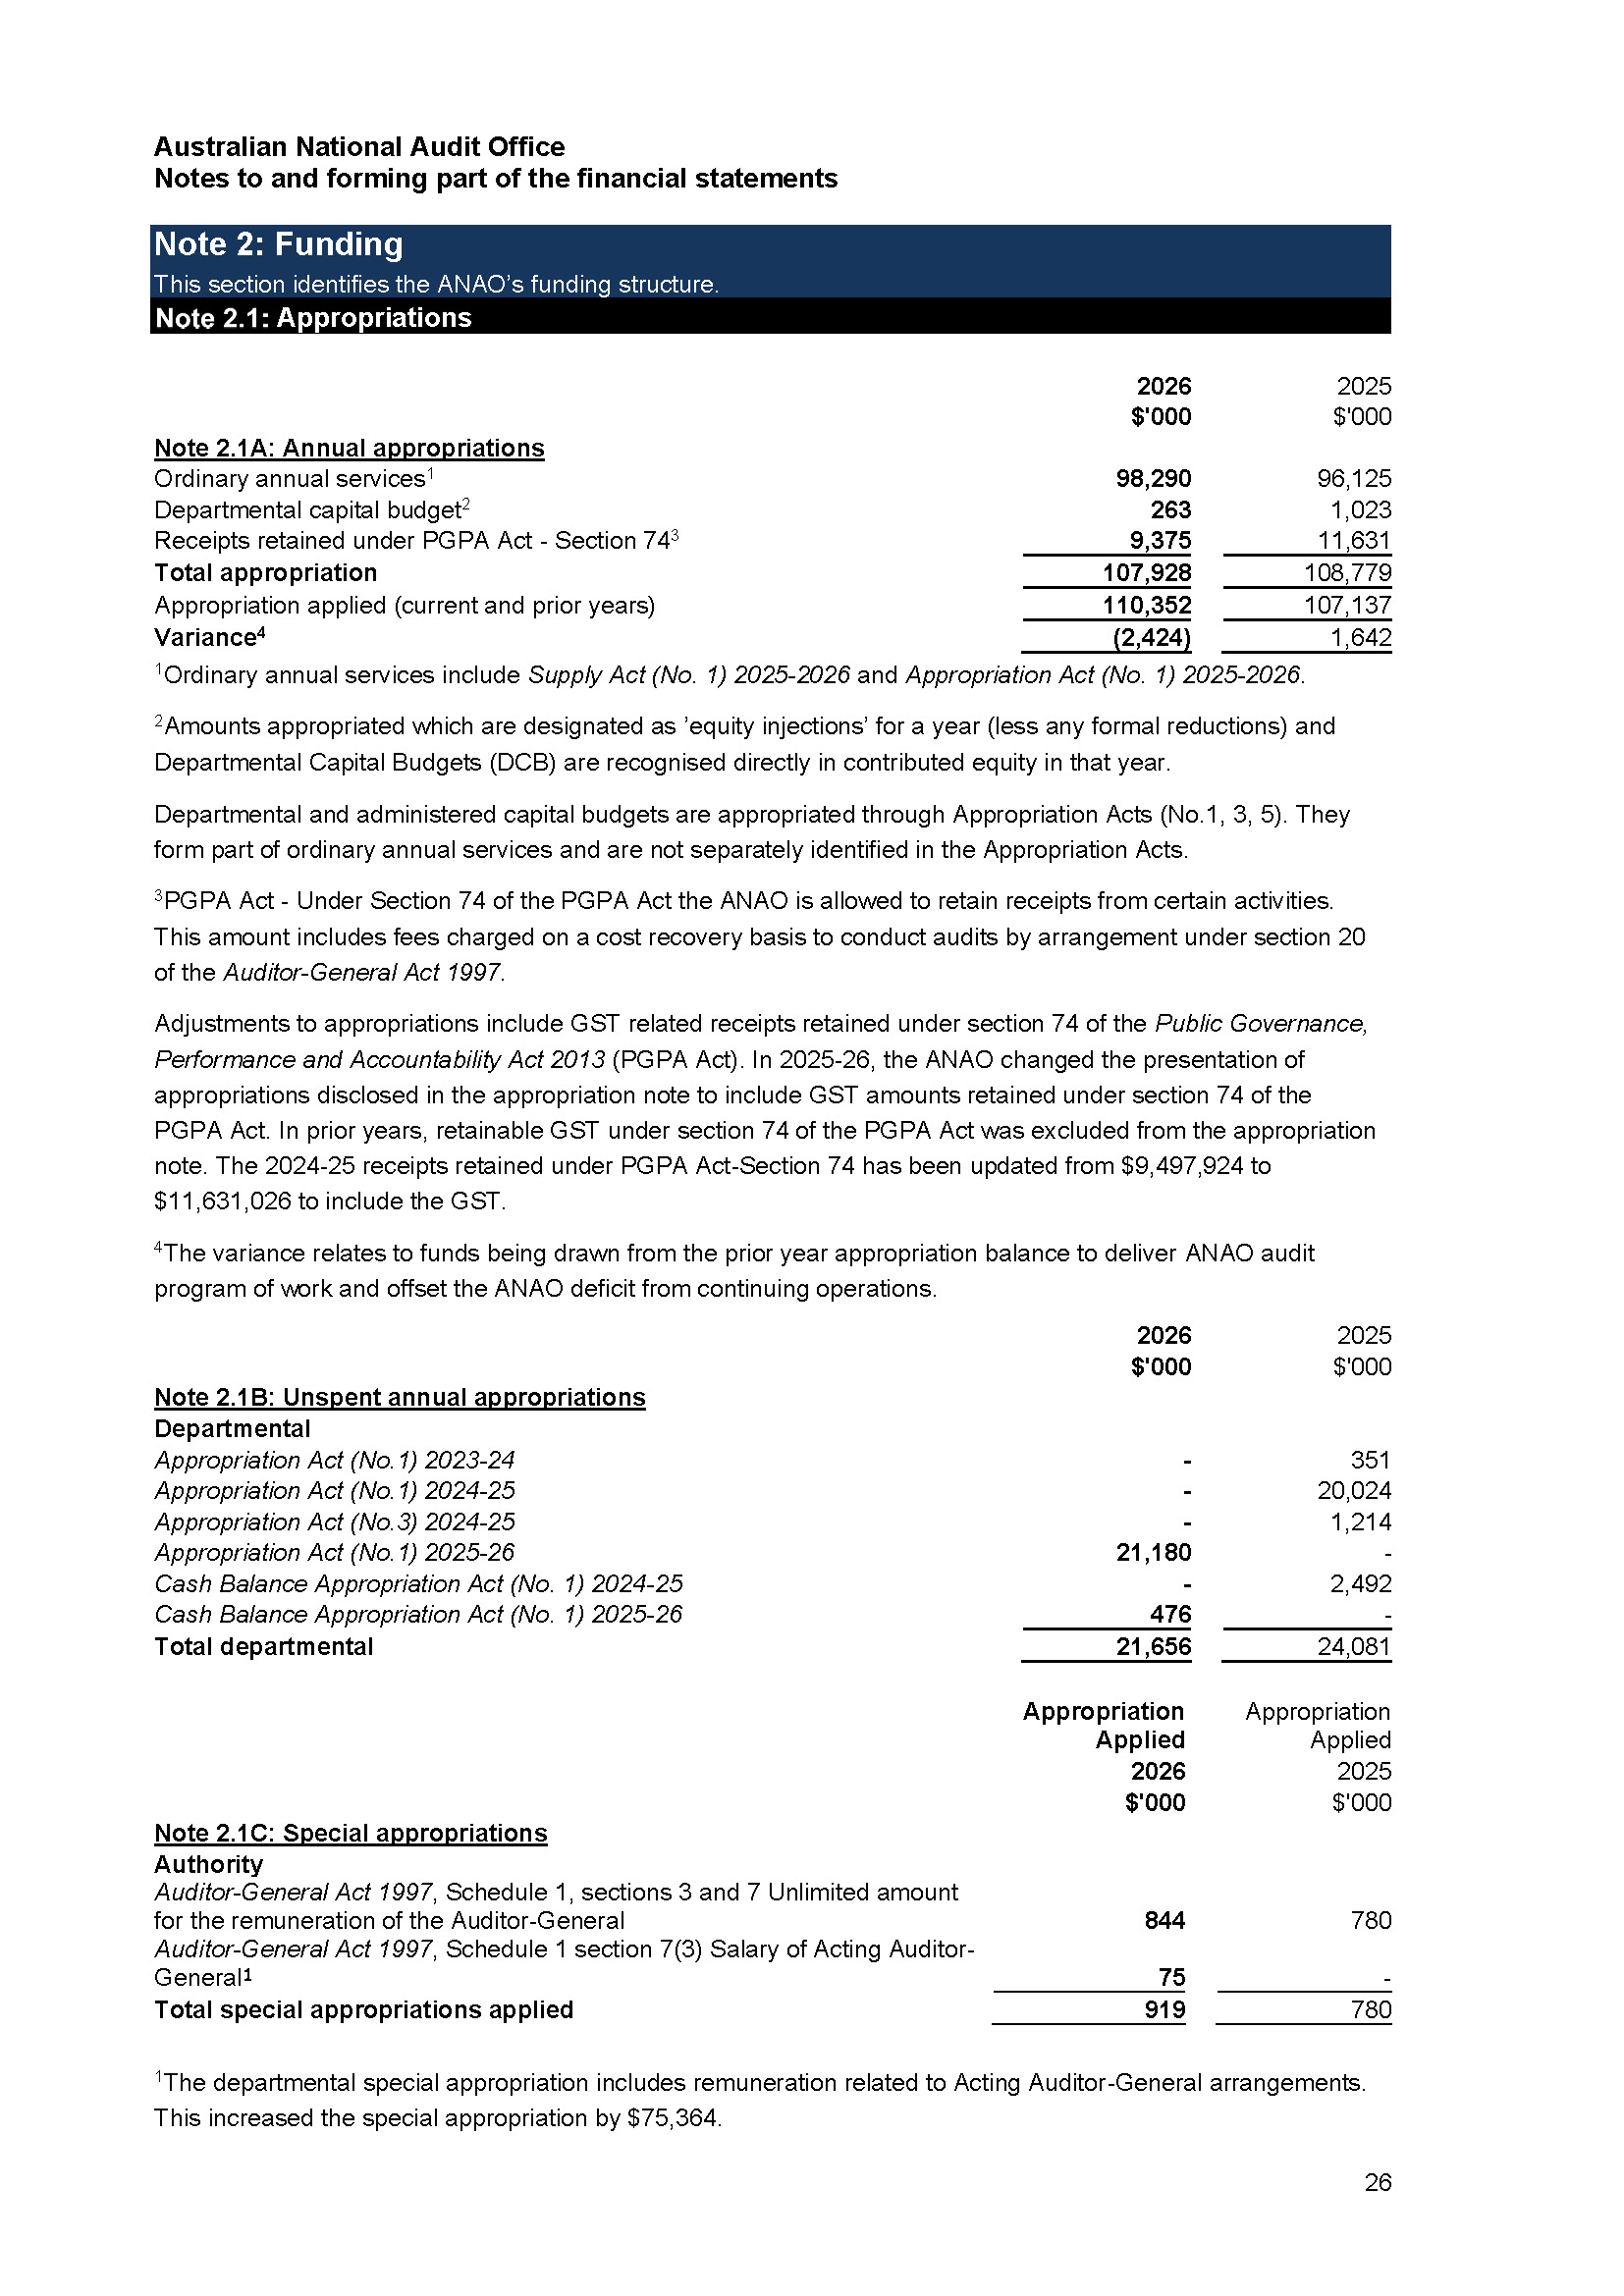
5. Progress against our corporate plan
In 2025–26, the ANAO and the public sector operated in a dynamic environment shaped by parliamentary priorities, increasing complexity in programs across government, fiscal constraints, rapid social change and technological advancement, heightened security and workforce challenges. These factors reinforced the importance of the ANAO’s role in supporting accountability, transparency and the effective use of public resources.
The achievements outlined in this section demonstrate how the ANAO responded to these challenges while progressing its strategy; strengthening relationships with the Parliament, audited entities and other stakeholders; and maintaining the quality of its work.
ANAO Strategy on a Page
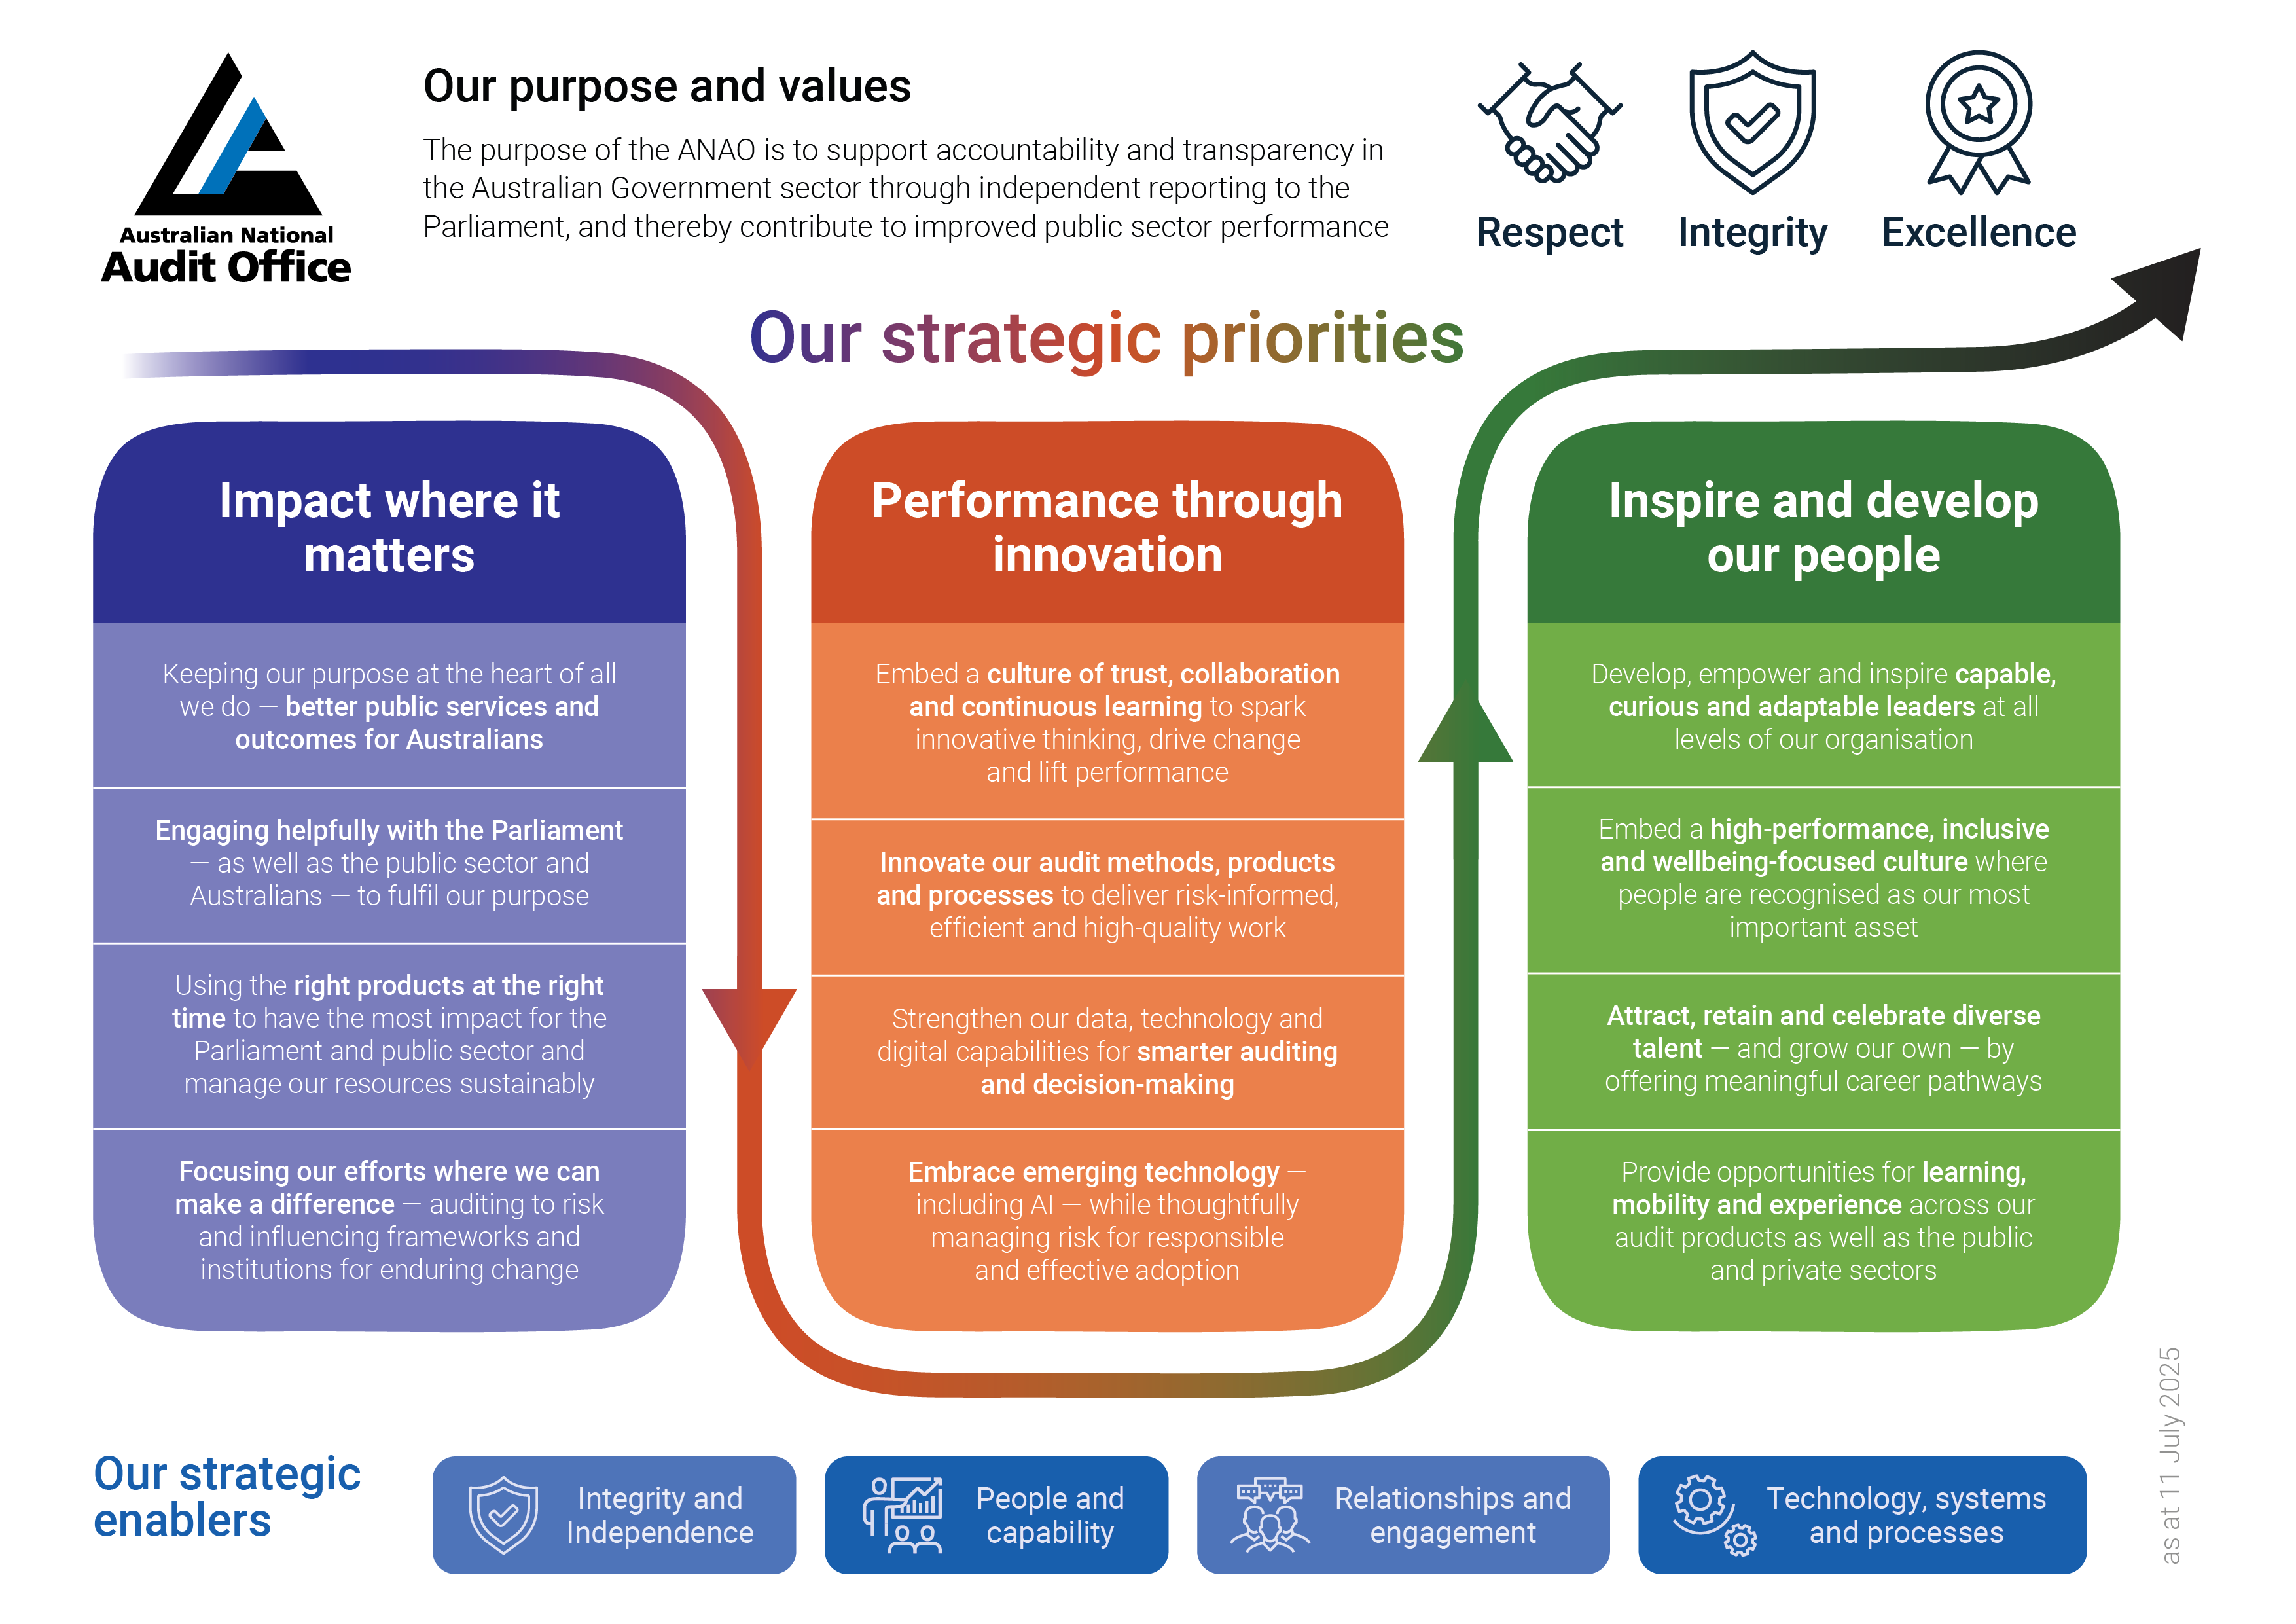
The ANAO introduced its first Strategy on a Page through the ANAO Corporate Plan 2025–26, published in July 2025. The strategy translates the Auditor-General’s vision into three strategic priorities — impact where it matters, performance through innovation, and inspire and develop our people. These three pillars reflect the ANAO’s focus on delivering value for Parliament, the sector and the Australian people, improving how we work, and investing in our employees to support wellbeing, build capability and deliver high-quality outcomes.
In 2025–26, we established a multi-year program of work to deliver on the Strategy on a Page. The program of work was structured around seven enterprise priorities with associated projects and actions and linked to annual and longer-term planning through the corporate plan, group business plans and individual performance agreements.
The program used established ANAO governance arrangements, with oversight by the Executive Board of Management, support from relevant subcommittees and a program office responsible for coordinating regular performance and risk reporting, and ongoing activities for staff engagement and communications.
Figure 5.1: ANAO Strategy on a Page
Impact where it matters
The ANAO has focused on strengthening the way our work is planned, delivered and communicated so that non-mandated audit work is directed to areas of greatest value, and audit insights are more accessible to the Parliament, Commonwealth entities and the public.
In 2025–26, the ANAO trialled new approaches to the design, delivery and presentation of audit products to provide more timely and relevant products to the Parliament and public.
We developed and piloted rapid engagement approaches, which strengthened our capacity to apply more agile, risk-based approaches. We undertook four of these pilots during the year, and the pilots confirmed that rapid engagements are an appropriate approach in certain circumstances, such as responding to emerging risk. They provide earlier insights and inform decisions about follow-on audit coverage where deeper assurance is required. Lessons from these pilots have informed the development of principles for topic selection, resourcing requirements, workflow and stakeholder engagement for future rapid engagements. This gives the ANAO the ability to apply flexible audit approaches, while maintaining audit quality and consistency.
In parallel, we introduced new approaches to how audit findings might be communicated. This included trialling new report formats such as the ‘report at a glance’, which provides a concise summary of what the audit examined and concluded, and its key findings. These enhancements improve the accessibility and usability of audit reports, allowing a broader range of users to quickly understand key messages and apply insights.
The ANAO also trialled a more integrated approach to audit delivery aimed at improving engagement with entities, enhancing collaboration and reducing duplication across the ANAO. Audit teams trialled more coordinated delivery across financial and performance statements audits. This included increasing the number of entities overseen by a single engagement executive, alongside more coordinated planning, joint meetings, and shared audit work across ANAO groups.
We also refreshed our approach to preparing the Annual Audit Work Program (AAWP), moving towards an integrated, multi-year work program that provides greater visibility of potential audit activity in future years. The AAWP was informed by portfolio risk workshops with staff from across audit service groups, supporting the selection of audit focus areas based on a comprehensive view of entity risks and performance.
Performance through innovation
During the year, the ANAO encouraged staff to suggest better ways of working and to try different approaches in the way we plan and deliver both audit and non-audit work. The ANAO conducted engagement activities with all staff and targeted groups to gather feedback and ideas that informed the Strategy on a Page program and other key organisational initiatives. Not only did these activities generate innovative ideas, they also supported inclusion, whole of ANAO approaches and more effective change management.
The ANAO continued to look for new ways to approach its audit work across all audit products, with a view to sustaining or improving audit quality and efficiency. Approaches adopted during 2025–26 included: the increased use of data analytic tools in financial statements audits; refocusing audit work across all audit products onto the areas of higher risk; piloting approaches to better integrating the planning for financial statements and performance statements audits; and expanding the allocation of a single Engagement Executive to oversee both the financial statements audit and performance statements audit to more entities.
The ANAO also launched its Digital Strategy 2025–29, setting out a vision, objectives and principles to enhance organisational digital capability, improve efficiency and support high-quality audit outcomes through the effective use of technology and data.
In July 2025, the ANAO released its Policy for the Use of Artificial Intelligence (AI), establishing a framework for the responsible, safe and ethical use of AI across the organisation. The policy supports innovation while safeguarding audit quality, integrity, security and transparency, and provides staff with clear guidance on the use of AI tools. The ANAO’s approach is aligned with Australian Government and Digital Transformation Agency policy settings, and all mandatory requirements were implemented within the required timeframes. The ANAO continues to review and mature its approach to AI, including opportunities to enhance transparency and public engagement regarding its use.
The ANAO rolled out the generative AI app Microsoft 365 Copilot to all staff during the year, supporting the ANAO’s broader digital capability uplift. Early adoption has improved efficiency in low-risk, administrative and analytical tasks, including meeting summaries, identifying key themes to inform analysis, drafting content, document comparison and summarisation, and preparing research and facilitation materials. Copilot has also streamlined recruitment processes through the introduction of transcription to assist with interview note-taking and scribing.
We commenced work to uplift data literacy, e-discovery and broader digital skills across the workforce. This work will continue and underpin a structured approach to capability development, which will form part of the ANAO’s workforce action plan in 2026–27.
In parallel, the ANAO advanced its capability to audit emerging technologies, including AI. Guidance has been developed to support auditors to assess technology-enabled risks, governance arrangements, controls, transparency and accountability in areas of increasing significance to public administration.
Inspire and develop our people
In 2025–26, the ANAO invested in initiatives to strengthen workforce capability, engagement and wellbeing. This included implementation of the 2025–26 Census Action Plan and the Workforce Action Plan 2025–26, which targeted learning and development, improvements to mobility and career development options, and a range of initiatives to enhance employee wellbeing and experience.
Through the ANAO Academy, more than 100 learning experiences were delivered across priority areas, including technical, leadership, management, communication and stakeholder engagement skills. The learning and development program also targeted emerging areas of strategic importance, including foundational AI capabilities and climate reporting and auditing.
The ANAO also developed human resources dashboards for senior managers, providing real-time workforce data to inform decision-making and support workforce management.
To support workforce mobility and career development, the ANAO established an internal short-term mobility register. The register provided staff with greater visibility of priority projects and opportunities to contribute to them, while supporting workforce development, deployment to the ANAO’s highest priorities, and management of peak workflows.
Over the reporting period, the ANAO delivered a range of initiatives to enhance employee engagement and wellbeing. This included activities such as expanding wellbeing events and resources, holding regular staff dialogue sessions, introducing additional recognition channels, clarifying expectations for manager–staff engagement, and increasing the use of workforce insights through pulse surveys to inform improvements.
We also advanced development of the ANAO People Strategy 2026–29, informed by workforce data analysis and consultation across the ANAO, ensuring alignment with organisational priorities, operating context and reflecting staff feedback.
Development of the ANAO Diversity and Inclusion Strategy 2026–29 also progressed during the year, supported by staff consultation and co-design activities to ensure the strategy reflects the voices and experiences of staff across the ANAO. A diversity and inclusion calendar was published in February 2026, with a program of events and activities complementing existing wellbeing and social club initiatives, supporting a more inclusive and connected workplace.
The ANAO also engaged a First Nations leader to help guide and strengthen ANAO efforts towards Closing the Gap and reconciliation.
Relationships, engagement and cooperation
Engagement is central to how the ANAO extends the value and influence of its audit work. Through its relationships with the Parliament, Australian Government entities, public administration bodies, the auditing profession and international peers, the ANAO promotes greater use of audit insights, supports system-wide learning and contributes to stronger accountability, transparency and public sector performance.
This engagement ensures the ANAO’s work has impact beyond individual reports and remains responsive to the evolving expectations of the Parliament, the public sector, the profession and the community.
Supporting parliamentary accountability
The Australian Parliament is the ANAO’s primary stakeholder. Through audit reports, assurance activities and advice, the ANAO equips the Parliament with objective evidence to scrutinise government administration, test whether public resources are being used as intended, and hold the executive to account. This relationship is central to the ANAO’s public value: strengthening transparency, supporting integrity and improvements in public administration and reinforcing confidence in the performance of government.
The Joint Committee of Public Accounts and Audit (JCPAA) is critical in this relationship. In addition to its statutory role of considering the ANAO’s operations and resources and reviewing all Auditor-General reports tabled in the Parliament, the committee provides an important mechanism for parliamentary scrutiny of audit findings and recommendations.
During 2025–26, the JCPAA commenced eight inquiries reviewing 15 Auditor-General reports and tabled two reports. Six inquiries remained in progress at 30 June 2026. ANAO officers attended seven public hearings, provided 11 private briefings and made two submissions to assist the committee in undertaking its functions.
The ANAO also continued to engage with government on matters arising from the JCPAA’s Report 491: Review of the Auditor-General Act 1997. All recommendations directed to the ANAO have been implemented, and engagement continues in relation to the Government’s broader response and measures to enhance and safeguard the independence of the Auditor-General and the ANAO.
The ANAO continued to support the Parliament’s scrutiny function more broadly by providing information, briefings and advice to parliamentarians, parliamentary committees and committee secretariats. In addition to providing a summary of the ANAO’s work in the relevant portfolios to each Senate Estimates committee in advance of hearings, during 2025–26 we attended seven public hearings, four private briefings and one classified hearing with other parliamentary committees. We also provided 27 private briefings to parliamentarians, compared to 20 in 2024–25, with 18 relating to specific audit reports, demonstrating continued parliamentary interest in and use of Auditor-General reports.
The ANAO also maintained its regular program of seconding staff to the JCPAA secretariat, with one staff member commencing a six-month secondment in March 2026. The secondment program supports the strong working relationship between the ANAO and the committee, and provides staff with first-hand insight into how Auditor-General reports are used by the Parliament.
Strengthening public administration
The ANAO seeks to promote system-wide learning across the Australian public sector by sharing audit insights, lessons learned and better practice. The ANAO helps entities identify common risks, see opportunities to strengthen governance and improve performance, while preserving the independence that underpins its assurance role. We did this in 2025–26 through publication of our products, through our interactions with audited entities, and through our attendance and presentations at public sector forums and events, such as the APSC’s induction for new SES, the biannual Financial and Performance Reporting Forum for chief finance officers and officials responsible for preparing financial and performance statements, communities of practice, and various agency-led and sector-wide conferences.
Engagement with departmental secretaries, agency heads, audit committee members and framework owners supports stronger public sector capability, accountability and performance. During 2025–26, this included one-on-one engagements between agency heads and the Auditor-General, as well as the attendance of the Auditor-General at the Secretaries Board, the Integrity Agencies Group, and the APS Capability and Workforce Committee. Engagement was also increased with audit committee chairs and members through the biannual Audit Committee Chairs’ Forum that has been opened up to include invitations to all audit committee members.
The ANAO also provided feedback on framework guidance materials to help extend the impact of ANAO audits beyond individual reports and to support entities to apply audit lessons, respond to emerging risks and improve governance and performance.
Contributing to the auditing profession
The ANAO contributes to the advancement of public sector auditing through leadership, collaboration and participation in professional and standard-setting forums.
Through the Australasian Council of Auditors-General (ACAG), the ANAO worked with Australian, New Zealand and Pacific audit offices on strategic issues affecting public sector auditing, including auditor-general independence and emerging reporting requirements such as climate disclosures. The ANAO contributed through committee leadership, participation in discussion papers and professional exchanges, and by informing collective positions on emerging auditing and governance issues.
In 2025, a Deakin University survey conducted for ACAG found that Australia’s auditor-general independence arrangements remained stable at 70 per cent of the maximum score. While our score remained stable, the ANAO’s independence ranking fell from seventh in 2020 to ninth in 2025, out of 12 rankings across 13 jurisdictions. The ANAO’s weakest results related to financial and administrative autonomy, and freedom to decide the content of reports. This ranking highlights the importance of ongoing attention to the legislative, institutional and financial safeguards that support the independence of the Auditor-General for Australia.
The ANAO also remained actively involved with CPA Australia and Chartered Accountants Australia and New Zealand (CA ANZ). Ms Carla Jago, Acting Deputy Auditor-General, served on both the CA ANZ ACT Regional Council and the CA ANZ National Council. Ms Michelle Page, Acting Group Executive Director of the Financial Statements Audit Services Group, was a member of the CPA Public Sector Committee. The ANAO maintained its status as a recognised employer under CPA Australia’s Recognised Employer Program. We also supported 118 staff with CA ANZ and CPA membership across the financial year.
During the year, the ANAO contributed to the development of accounting and auditing standards through participation in ACAG responses to exposure drafts issued by Australian and international standard-setting bodies. Through these activities, the ANAO helps ensure that emerging audit issues, public sector risks and practical audit insights inform the ongoing development of professional standards and guidance.
Building international capability and influence
The ANAO maintains a targeted international engagement program that supports capability development, contributes to global public sector auditing and strengthens Australia’s relationships with regional audit institutions. These relationships reflect the ANAO’s standing as a trusted and respected supreme audit institution and create opportunities for both learning and influence.
Contributing to international audit standards and practices
The ANAO is an active member of the International Organization of Supreme Audit Institutions (INTOSAI) and contributes to working groups focused on information technology auditing, environmental auditing, emerging technologies and performance auditing.
The ANAO also contributes to the development of international professional standards through participation in the Forum for INTOSAI Professional Pronouncements (FIPP). Ms Jane Meade, Group Executive Director, Professional Services Group, serves on the FIPP, supporting the development and maintenance of INTOSAI’s professional standards framework.
Through its participation in INTOSAI, the Asian Organization of Supreme Audit Institutions (ASOSAI) and the Pacific Association of Supreme Audit Institutions (PASAI), the ANAO contributes Australian perspectives and practical audit experience to international discussions on accountability, transparency, governance and public sector performance.
Learning from peers and sharing expertise
The ANAO continued to engage with international audit institutions on emerging developments in public sector auditing, including AI, digital innovation, environmental auditing and contemporary audit methodologies.
During 2025–26, these engagements included:
- a performance audit peer review undertaken by New Zealand’s Audit Office;
- quarterly discussions with the UK National Audit Office and New Zealand’s Audit Office on digital innovation and AI;
- quarterly discussions with the Office of the Auditor-General of Canada on audit tools and innovation;
- participation in international discussions on the audit of First Nations issues; and
- engagement with audit institutions from New Zealand, Norway, the Netherlands, the United Kingdom and Canada on the use of AI in performance auditing.
The ANAO also participated in major international forums including the 25th INTOSAI Congress, the 26th PASAI Congress, PASAI Governing Board meetings and discussions at the Mexico, Indonesia, the Republic of Korea, Türkiye and Australia (MIKTA) Heads of Supreme Audit Institutions discussions.
In October 2025, the Auditor-General also participated in a panel discussion on Informal Challenges to SAI Independence at the 25th International Congress of Supreme Audit Institutions (INCOSAI) in Egypt, sharing insights from the project and contributing to global efforts to strengthen SAI resilience, accountability and public trust. The discussion considered practical lessons for protecting independence and their implications for INTOSAI’s future agenda.
These engagements provide the ANAO with access to comparative practice, independent challenge and early insight into emerging audit risks. They help the ANAO test and refine its methodologies, benchmark its approach against peer institutions and identify opportunities to improve audit quality, efficiency and impact. They also enable the ANAO to share its experience in areas such as performance statements auditing, audit quality, governance arrangements and data-enabled auditing with the international audit community, reinforcing Australia’s role in advancing contemporary public sector assurance practice.
Strengthening audit capability in the region
The ANAO’s longstanding partnerships with the Audit Board of the Republic of Indonesia (BPK) and the Papua New Guinea Office of the Auditor-General (PNG AGO) remain an important part of Australia’s international development program and demonstrate the ANAO’s contribution to strengthening integrity and accountability institutions in the Indo-Pacific region.
Under the Australia–Indonesia Partnership for Economic Development (Prospera), the ANAO and BPK delivered 13 of 17 planned activities during 2025–26. Activities focused on leadership and organisational development, audit quality, workforce capability, performance statements auditing, emerging technologies and gender equality, disability equity and social inclusion initiatives. Program delivery also included targeted exchanges, secondments and in-country engagement, supported by an ANAO officer based in Jakarta.
The partnership supports Indonesia’s broader governance and public financial management reforms by strengthening institutional capability and audit quality. It also provides opportunities for mutual learning, including ANAO participation in BPK’s information technology audit activities and exchanges on emerging audit methodologies.
Through the Papua New Guinea Institutional Partnerships Program, the ANAO and PNG AGO delivered all 36 planned activities across five workstreams including coverage of institutional governance, technical audit capability, workforce development and organisational performance. Activities included in-country engagement, targeted exchanges and the deployment of ANAO officials to support capability development.
In March 2026, the Auditor-General visited Papua New Guinea, signed a joint expression of intent with PNG Auditor-General Mr Gordon Kega, committing to the continuation of the partnership, and presented to the PNG AGO and other stakeholders on the role of audit institutions in promoting accountability and good governance.
The ANAO has continued to dedicate effort to strengthening audit capability in the Pacific region, including through the Pacific Association of Supreme Audit Institutions (PASAI). The Auditor-General is a member of the Governing Board of PASAI. The ANAO has also contributed to PASAI through the secondment of an ANAO officer to the role of Program Director. The role supports heads of supreme audit institutions to identify capability needs, develop tailored programs, deliver technical advice and training, and connect supreme audit institutions with specialist support across the region and the broader INTOSAI community. This secondment enabled the ANAO to share its public sector audit expertise in support of regional priorities, while contributing to stronger transparency, accountability and integrity across Pacific public administration.
These partnerships contribute to stronger improved audit capability and enhanced public sector governance in the region, while also strengthening institutional and peer relationships and supporting knowledge exchange between audit offices.
Quality
High-quality audits are fundamental to the ANAO’s ability to provide trusted assurance to the Parliament and contribute to accountability, transparency and improved public sector performance. The ANAO defines audit quality as the provision of timely, accurate and relevant audits, performed independently in accordance with the Auditor-General Act 1997 and the ANAO Auditing Standards and methodologies. Quality, together with independence and integrity, underpins confidence in the findings, conclusions and opinions expressed in ANAO reports.
Maintaining confidence in audit quality
The ANAO’s work is governed by the ANAO Auditing Standards, established by the Auditor-General under section 24 of the Auditor-General Act 1997. These standards incorporate quality management standards issued by the Auditing and Assurance Standards Board, including ASQM 1 — Quality Management for Firms that Perform Audits or Reviews of Financial Reports and Other Financial Information, or Other Assurance or Related Services Engagements.
The ANAO maintains a system of quality management designed to support the consistent delivery of high-quality audit work.
The ANAO published its Quality Management Framework and Plan 2025–26 in July 2025. The framework articulates the ANAO’s system of quality management and the arrangements used to identify, assess and respond to quality risks across the organisation.
The ANAO also promotes transparency through publication of its annual audit quality report. Published in October 2025, the Audit Quality Report 2024–25 provided the Auditor-General’s assessment of the implementation of the ANAO’s quality management system as effective, with reported performance against audit quality indicators and benchmarks, and assessed achievement of quality assurance objectives and deliverables.
Driving continuous improvement
The ANAO’s approach to quality extends beyond compliance with professional standards and focuses on continuous improvement through monitoring, evaluation and learning.
During 2025–26, the ANAO continued to refine its quality management system using lessons identified through quality assurance reviews, root cause analysis and stakeholder feedback. Key improvements included:
- implementation of service groups’ quality plans to support quality outcome ownership and strengthening of stakeholder collaboration;
- application of an efficiency lens to the quality assurance program to enhance learning and delivery of timely insights;
- procurement of a methodology for assurance over sustainability reports prepared by Commonwealth companies under the Corporations Act 2001; and
- quality monitoring and reporting through enhanced metrics, data analysis and exploring use of emerging technologies.
A key focus in 2025–26 was strengthening the ANAO’s focus on auditing to risk. In May 2026, the quality assurance review program of financial statement, performance statement and performance audits reported and identified positive examples of audit teams refocusing audit effort to areas of risk without compromising audit quality. Where deficiencies were identified, root cause analysis of the findings and observations raised was undertaken.
Understanding the deficiency drivers enables the ANAO to design targeted actions to strengthen audit quality. The key improvement opportunities related to designing an audit strategy that efficiently and effectively responds to risks; exercising professional scepticism; and effectively documenting professional judgements.
Supporting quality through methodology
The ANAO Auditing Standards are supported by a methodology that applies across performance audits, financial statements audits and performance statements audits. Embedded in the ANAO Audit Manual, the methodology provides auditors with a consistent framework for planning, conducting and reporting audits in accordance with legislative and professional requirements.
The ANAO regularly reviews and updates its methodology to reflect changes in auditing standards, emerging risks, developments in audit practice and lessons identified through quality assurance activities. This helps ensure audit approaches remain relevant, effective and responsive to a changing public sector environment.
The ANAO’s focus on calibrating audit resourcing and effort to risk is an important initiative in driving audit quality, as well as ensuring efficiency. Higher risk areas are those which are more likely to contain material errors, fraud, non-compliance, or performance issues. By allocating more effort and resources to these areas, audit quality is enhanced.
During 2025–26, the ANAO progressed key deliverables under its sustainability assurance services implementation plan in preparation for auditing Commonwealth companies required to prepare sustainability reports under the Corporations Act 2001. This included procuring a sustainability assurance methodology, reviewing contracted audit providers’ approaches and undertaking capability development activities with ACAG peers.
The ANAO also enhanced the use of quality metrics, data analysis and emerging technologies to support evidence-based quality management and strengthen audit methodologies.
Embracing transparency and independent scrutiny
The ANAO deliberately subjects its audit work to independent scrutiny as part of its commitment to quality, transparency and public confidence.
Quality assurance reviews of performance audits tabled in 2025 were conducted under a reciprocal arrangement with the Victorian Auditor-General’s Office. No thematic or significant findings were identified, and root cause analysis was not required. Lessons from the review will inform the future direction of the ANAO’s external review program.
The ANAO and the New Zealand’s Audit Office also continued their longstanding reciprocal peer review arrangement. In November 2025, New Zealand’s Audit Office reviewed two ANAO performance audit files and provided its findings in March 2026. The review identified opportunities for improvement and highlighted similarities and differences in audit approaches between the two organisations, and is published on the ANAO website.
These reviews provide independent challenge and assurance, helping the ANAO test its methodologies, benchmark its practices and strengthen confidence in the quality of its work.
6. Management and accountability
Corporate governance
The ANAO’s corporate governance arrangements support the organisation to uphold public sector principles and values — including legislative requirements for accountability, leadership, transparency, integrity, efficiency and risk management.
ANAO’s strategic planning framework
The ANAO’s strategic planning framework operates consistently with the Commonwealth performance framework established under the Public Governance, Performance and Accountability Act 2013 (PGPA Act). This planning framework translates the ANAO’s purpose, mandate and strategic intent into clear priorities, delivered through planned work and assessed through transparent public reporting (Figure 6.1).
The corporate plan is the ANAO’s primary annual planning document and, consistent with the PGPA Act, covers a four-year period. Informed by the portfolio budget statements, it sets out what the ANAO seeks to achieve over the forward years, the environment and risks it faces, and how performance will be measured.
The annual audit work program (AAWP) sits alongside the corporate plan as a companion document and is a distinctive feature of the ANAO’s strategic planning framework. The AAWP sets out the ANAO’s planned audit coverage across a multi-year forward program of potential audit activity. Refreshed annually, the AAWP informs the Parliament, the public sector and the public of proposed audit activity, with final selection and timing of audits determined by the Auditor-General based on risk, the Parliament’s priorities, materiality and auditability.
Together, the corporate plan and the AAWP guide delivery across the organisation, with priorities flowing into group business plans and individual performance agreements. The ANAO reports on its activities and performance through its annual report, as required under the PGPA Act.
Figure 6.1: ANAO strategic planning framework
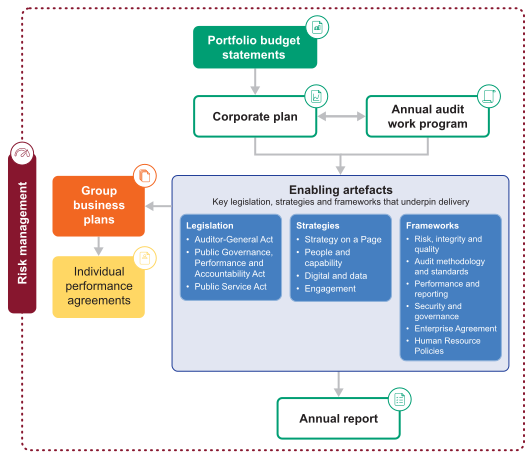
Governance structure
The ANAO’s governance framework gives effect to the strategic planning framework by supporting accountable decision-making, transparency and effective risk management (Figure 6.2). Governance committees play a central role in overseeing the implementation of strategy and the management of organisational performance.
At 30 June 2026, the ANAO’s governance structure comprised the Executive Board of Management as the peak governance committee, supported by six subcommittees, one consultative body and three operational committees. An Audit Committee also provides independent oversight and advice to the Auditor-General.
Figure 6.2: ANAO governance committees, at 30 June 2026
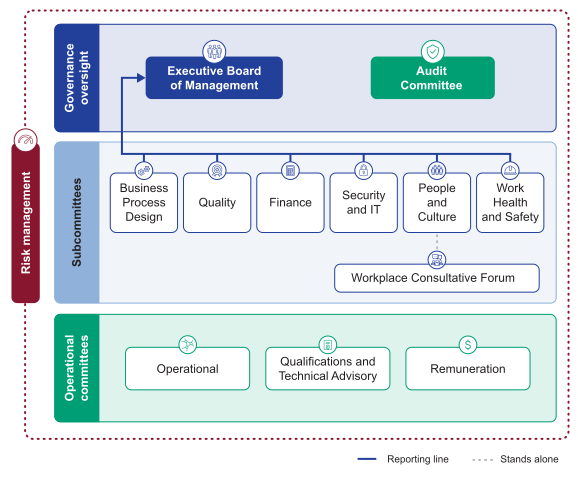
Executive Board of Management
The Executive Board of Management (EBOM) assists the Auditor-General to meet statutory responsibilities as the ANAO’s accountable authority under the PGPA Act. Table 6.1 shows the members of the board at 30 June 2026.
EBOM is responsible for setting, approving and monitoring progress on the ANAO’s strategic direction, supporting delivery of the goals, commitments and initiatives outlined in the corporate plan. The board provides a forum for ANAO leaders to raise issues, risks and opportunities, including monitoring performance against the corporate plan, and overseeing the annual budget and key business initiatives. EBOM meets monthly, and its terms of reference are reviewed annually.
Table 6.1: Membership of the Executive Board of Management, at 30 June 2026
|
Board member |
Position |
|
Dr Caralee McLiesh PSM |
Auditor-General, Chair |
|
Ms Carla Jago |
Acting Deputy Auditor-General |
|
Ms Michelle Page |
Acting Group Executive Director, Financial Statements Audit Services Group |
|
Ms Lesa Craswell |
Group Executive Director, Systems Assurance and Data Analytics Group |
|
Mr Ian Goodwin |
Group Executive Director, Performance Audit Services Group |
|
Ms Peta Lane |
Group Executive Director, Performance Audit Services Group |
|
Mr George Sotiropoulos |
Group Executive Director, Performance Statements Audit Services Group |
|
Ms Jane Meade |
Group Executive Director, Professional Services Group |
|
Ms Sue Goodear |
Chief Operating Officer, Corporate Management Group |
|
Ms Alison Garth |
Chief Finance Officer, Corporate Management Group |
Subcommittees
The ANAO’s subcommittees are chaired by EBOM members and made up of representatives from across each group. They support the board in promoting organisational accountability and transparency and provide oversight and risk management across key operational areas. Subcommittees report to the Executive Board of Management, and their terms of reference are reviewed annually.
At 30 June 2026, the ANAO had six subcommittees and one consultative body:
- People and Culture Committee — advises the board on people and culture development in the ANAO.
- Workplace Consultative Forum — a consultative body of the People and Culture Committee, providing a platform for consultation and resolution of workplace relations matters.
- Quality Committee — provides assurance and advice to the board on the ANAO’s quality framework, and the strategic and operational risks associated with quality.
- Finance Committee — supports financial stewardship by advising the board on financial sustainability, resource allocation and cost pressures, and by monitoring the financial risks that affect the ANAO’s capacity to deliver a high-quality audit program.
- Security and Information Technology Committee — supports the Auditor-General and Chief Security Officer in achieving protective security objectives and monitoring performance, and provides advice on information technology and business systems strategy and investment.
- Business Process Design Committee — provides a strategic approach to audit products and the adoption of a risk-based, portfolio view.
- Work Health and Safety Committee — monitors and reviews the ANAO’s work health and safety (WHS) policies and practices and advises the board on WHS matters.
The People and Culture Committee, Security and Information Technology Committee, Quality Committee, Finance Committee and Business Process Design Committee all oversee work relating to the Strategy on a Page (SOAP) program and associated activities.
Operational committees
Operational committees support the ANAO by providing advice, oversight and decision-making on key operational, remuneration and audit technical matters.
At 30 June 2026, the ANAO had three operational committees:
- Operational Committee — oversees the operational activities of the ANAO, focusing on staffing, performance and external relations. The committee also considers the status of the audit program in service group reporting and any other matter of operational strategic importance to the ANAO.
- Qualifications and Technical Advisory Committee — provides a forum for audit engagement executives to consult on difficult or contentious matters and, where necessary, resolve differences of opinion on audit-related matters. ANAO policy identifies the matters that must be referred to the committee, and the committee meets as required to provide advice to the Auditor-General.
- Remuneration Committee — advises the Auditor-General on remuneration.
Internal audit
The ANAO’s internal audit function is outsourced and delivers a risk-based program of reviews of governance, risk management and internal controls. The internal audit program is informed by the ANAO’s enterprise risk management framework and risk profile, and has the aim of identifying areas of significant operational and financial risk. Internal audit activities assess the effectiveness of controls and risk management practices, with findings and recommendations monitored through the ANAO’s governance arrangements.
The program is overseen by the Audit Committee, which provides independent advice to the Auditor-General, as the accountable authority, on the appropriateness and effectiveness of these arrangements, and monitors the implementation of agreed audit actions. In 2025–26, the ANAO’s internal auditor was Sententia.
Fraud and corruption control and prevention
The ANAO maintains a zero-tolerance approach to fraud and corruption. Fraud and corruption are inconsistent with ANAO values and the Australian Public Service Values and Code of Conduct. All staff, including contractors, are required to act in accordance with these standards.
During 2025–26, the ANAO reviewed and updated its fraud and corruption risk assessments to ensure they remained current and reflected the organisation’s operating environment, key risks and control environment. The ANAO also updated its Fraud and Corruption Strategy and Control Plan to align with the revised risk assessments and the Commonwealth Fraud and Corruption Control Framework.
Fraud and corruption risks are monitored through the ANAO’s governance arrangements, including oversight by the Executive Board of Management and relevant subcommittees. Staff awareness is reinforced through mandatory training and targeted communications, including Integrity Awareness Week.
The certifications required under subsection 17AG(2) of the Public Governance, Performance and Accountability Rule 2014 are included in the Auditor-General’s letter of transmittal on page iii.
Significant non-compliance with finance law
There were no significant issues reported to the Finance Minister under paragraph 19(1)(e) of the PGPA Act, which includes compliance with finance law.
Audit Committee
The Audit Committee provides independent oversight and advice to the Auditor-General, including reviewing the appropriateness of the ANAO’s financial and performance reporting, systems of risk management, and systems of internal control.
The Audit Committee’s charter sets out the committee’s role, authority, membership and functions, and its procedural, reporting and administrative arrangements. The charter is available on the ‘Governance’ page on the ANAO website (anao.gov.au/about/governance).18
The Audit Committee met five times during 2025–26. Details of the Audit Committee’s membership in 2025–26, including remuneration for the period, meeting attendance, and experience and qualifications of members, are provided in Table 6.2.
Table 6.2: Membership of the ANAO Audit Committee for 2025–26
|
Member name |
Qualifications, knowledge, skills and experience |
No. of meetings attended |
No. of meetings eligible to attend |
Total annual remuneration (incl. GST) |
Additional information (including role on committee) |
|
Ms Cath Ingram |
Independent chair and member of several Commonwealth audit committees. Member and Fellow, Institute of Chartered Accountants FCA Member and Fellow, Institute of Public Administration Australia FIPAA Member, Australian Institute of Company Directors Bachelor of Arts in Accounting University of Canberra Certificate IV — Commonwealth Fraud Control (Investigations) |
5 |
5 |
$23,980.00 |
Chair (member since 24 September 2024) |
|
Ms Jenet Connell |
Commonwealth senior executive service for 21 years (15 years as Deputy Secretary) Member of several Commonwealth audit committees. Adjunct Professor, Faculty of Business, Government and Law, University of Canberra (since February 2025). Masters in Organisational Psychology, Curtin University Graduate, Australian Institute of Company Directors. |
5 |
5 |
$12,420.00 |
Member (since 18 October 2024) |
|
Mr Peter Quiggin PSM KC |
Member of several Commonwealth audit committees and non-executive board member. Commonwealth King’s Counsel Public Service Medal (PSM) Formally a Fellow of the Australian Institute of Company Directors Bachelor of Laws, Bachelor of Science (Computing and Pure Mathematics) Australian National University Graduate Diploma in Professional Accounting, University of Canberra Admitted as Barrister and Solicitor, Supreme Court of the ACT On the Roll, High Court of Australia. |
5 |
5 |
$14,300.00 |
Member (since 1 February 2023) |
External scrutiny
The ANAO’s operations, processes and reports are subject to independent external review.
Independent auditor
As provided under the Auditor-General Act 1997, an Independent Auditor is appointed by the Governor-General on the recommendation of the Prime Minister and with the approval of the Joint Committee of Public Accounts and Audit (JCPAA). The Department of the Prime Minister and Cabinet is responsible for the selection process.
Mr Shane Bellchambers was appointed as the ANAO’s Independent Auditor on 1 April 2024 for the period to 31 October 2028.
The Independent Auditor audits the ANAO’s financial statements and may conduct performance audits of the ANAO, providing assurance to the Parliament over its operations and reporting. In 2025–26, the Independent Auditor commenced a performance audit, Review of the ANAO’s Financial Sustainability Framework, which is expected to be completed in late 2026.
The ANAO also requests that the Independent Auditor audit its performance statements, providing additional assurance over non-financial performance information.
The ANAO received unmodified auditor’s reports on its financial statements and annual performance statements for the year ended 30 June 2026.
Other external scrutiny
From 1 July 2025 to 30 June 2026:
- there were no judicial decisions or decisions of administrative tribunals during the year that had, or may have, a significant impact on the ANAO’s operations;
- there were no reports on the operations of the ANAO during the reporting period by a parliamentary committee or the Commonwealth Ombudsman; and
- there were no decisions by the Australian Information Commissioner or Privacy Commissioner that involved the ANAO or that had, or might have, a significant impact on the ANAO’s operations.
Management of human resources
In 2025–26, the ANAO’s workforce strategies focused on building capability, supporting wellbeing, strengthening engagement and inclusion, and maintaining a sustainable, high-performing workforce.
Managing and developing employees
Workforce planning
At 30 June 2026, the ANAO had a headcount of 444 employees (excluding the Auditor-General). The attrition rate was 12.1 per cent, compared to 14.8 per cent in 2024–25.
During the year, we successfully implemented the Workforce Action Plan 2025–26, strengthening alignment between workforce initiatives and organisational priorities, including the corporate plan, census action plan and digital strategy. Key outcomes included enhanced employee capability across technical, leadership and stakeholder engagement domains, increased workforce mobility, increased engagement and wellbeing activities and improved workforce planning through the introduction of human resources dashboards providing real-time data to support strategic decision-making.
We also progressed development of the ANAO People Strategy 2026–29, consulting with staff to establish a clear direction for workforce capability, leadership, culture and employee experience.
Attracting and retaining talent
In 2025–26, 618 candidates applied for externally advertised ANAO roles. Eight external recruitment processes were completed, resulting in the engagement of 11 new ongoing and eight non-ongoing employees, five transfers from other Australian Public Service (APS) agencies, and 12 internal promotions.
Recruitment processes were streamlined to improve consistency and efficiency, including the introduction of artificial intelligence enabled transcription to support selection panels. This reduced reliance on external providers while supporting the safe and appropriate use of artificial intelligence in recruitment. Copilot also assisted us in some of the drafting and document comparisons as input to reports.
A short-term mobility register was introduced to support internal movement and provide greater visibility of opportunities across the ANAO. This enabled staff to contribute to priority work while learning and building capability, strengthening alignment between workforce capacity and business needs.
In 2025–26, the ANAO’s graduate and intern programs continued. Twelve graduates commenced across the Financial Statements Services Group and the Systems Assurance and Data Analytics Group. Four interns were also engaged, strengthening entry pathways into critical capability areas.
Retention efforts focused on recognition, engagement, flexible work and development opportunities.
Learning and development
The ANAO Academy provides a coordinated, organisation-wide approach to capability development across technical, professional and leadership domains. In 2025–26, the academy delivered more than 100 learning activities, including practitioner-led ‘ANAO Academy Accelerator’ sessions, graduate development programs and targeted training in leadership, stakeholder engagement and audit practice.
The ANAO continued to invest in professional development, including studies assistance, professional memberships and continuing professional development requirements for auditors.
LearnFest is the ANAO’s flagship, week-long, staff learning and development event. LearnFest 2025 further supported capability and a culture of continuous learning, delivering a program of events focused on adapting to change and innovation, including keynote sessions and practical workshops on audit, leadership and wellbeing.
Workforce experience, wellbeing and safety
The ANAO maintained its commitment to work health and safety, including psychosocial health, through its wellbeing framework, policies and risk management arrangements. During the year, targeted actions were implemented to strengthen wellbeing, innovation and inclusion, including staff dialogue sessions led by senior leaders and pulse surveys to gather actionable insights.
Flexible work arrangements continue to support a diverse and mobile workforce, with all employees able to access flexible work options. This approach is supported by enterprise agreement settings and updated policies, including strengthened guidance on remote work and psychosocial safety.
Employee wellbeing initiatives included a structured wellbeing program, access to counselling services, targeted training, and regular health and wellbeing activities.
The APS Employee Census 2025 recorded a 93 per cent response rate from ANAO staff, with strong results across engagement and leadership. In response to the census results, the ANAO developed the ANAO Census Action Plan 2025–26 with a focus on leadership, wellbeing and recognition. As part of the plan, the ANAO delivered its inaugural EL2 Leadership Conference, Leading with Impact, in April 2026 to support leadership capability across the EL2 cohort and support the delivery of ANAO strategic priorities.
Productivity and performance
During 2025–26, the ANAO continued to align its workforce to budgeted staffing levels through natural attrition while maintaining delivery of its mandated functions. Despite a reduction in staffing, the ANAO met its annual targets for the number of mandated financial statements audits, performance audits and performance statements audits.
Workforce planning, internal mobility and capability development initiatives supported the effective deployment of resources to priority audit work and business needs. Improved workforce data, strengthened human resources business partnering and maturing performance management arrangements enhanced workforce decision-making and helped ensure capability remained aligned to organisational priorities.
The ANAO also progressed actions under its APS Employee Census Action Plan to strengthen employee engagement, wellbeing and connection to the ANAO’s purpose and values. These initiatives support a high-performing workforce by fostering an environment where employees are engaged, capable and equipped to contribute to the ANAO’s objectives. This is particularly important in an audit environment, where workloads can be demanding and cyclical, requiring employees to remain adaptable and resilient during periods of increased activity. Supporting engagement and wellbeing helps sustain performance while enabling the ANAO to respond effectively to changing workload demands.
Gender equality reporting
In accordance with the Australian Government’s commitment to advancing gender equality through Working for Women: A Strategy for Gender Equality, the ANAO reports on actions taken to support gender equality within its workforce.
The ANAO is tracking well against the six gender equality indicators under the Workplace Gender Equality Act 2012 and we will continue to use workforce data and employee insights to inform actions that support gender equality and inclusion.
The ANAO remains committed to providing a workplace where employees have equitable opportunities to contribute, develop and progress. Women represented approximately 56 per cent of the workforce at the end of the reporting period and were strongly represented in leadership positions, including the Auditor-General, the acting Deputy Auditor-General and the broader membership of the Executive Board of Management.
During the reporting period, the ANAO supported access to leadership development opportunities, professional networks and events that promote the advancement of women in leadership and professions. The ANAO also undertook initiatives that support workplace flexibility, wellbeing, and equitable access to employment and career development.
The ANAO continued to support flexible work arrangements that assist employees to balance work and caring responsibilities, helping to remove barriers to workforce participation and career development.
Workplace agreements
Table 6.3 contains information on the number of Senior Executive Service (SES) and non-SES staff covered by the ANAO Enterprise Agreement 2024–2027 and other workplace agreements at 30 June 2026.
Table 6.3: APS employment arrangements, at 30 June 2026
|
Employment arrangement |
SES |
Non-SES |
Total |
|
ANAO Enterprise Agreement 2024–2027 |
– |
413 |
413 |
|
Common law contracts |
31 |
– |
31 |
|
Total |
31 |
413 |
444 |
Note: The numbers shown in this table are headcounts. This table includes ongoing, non-ongoing and casual employees as at 30 June 2026.
Non-salary benefits
The ANAO offers employees a number of non-salary benefits, which include:
- individual development including coaching, support for tertiary qualifications and training;
- professional development delivered by the ANAO Academy;
- study assistance;
- flexible working arrangements;
- contributions to relevant professional memberships;
- annual influenza immunisation;
- spectacles reimbursement;
- health checks; and
- a free, confidential employee assistance program for employees and their immediate families.
All ANAO employees have laptops and mobile phones, predominantly to provide multi-factor authentication for access to ANAO systems. Employees can also make use of a range of salary sacrifice benefits, including additional superannuation and leased motor vehicles.
Performance pay
The ANAO’s employment arrangements for SES and non-SES employees do not provide for performance pay. Under the ANAO’s Enterprise Agreement 2024–2027, incremental salary advancements within non-SES classification levels are linked to performance ratings.
Executive remuneration
Information on executive remuneration is provided in the ANAO’s financial statements (see pages 51–53).
The ANAO has elected to report executive remuneration within its financial statements so that the information is subject to independent audit. This provides additional assurance and transparency over the information disclosed.
Workforce data
Information on the ANAO’s workforce, including overall employee statistics and APS employee statistics, is provided in Appendix C.
Asset management
Management of ANAO’s assets is governed by Auditor-General Instructions and supporting financial management procedures aligning with accounting standards and government best practice. The ANAO maintains an asset register, asset management policies and a capital management plan.
Purchasing
The ANAO has reviewed its internal procurement policies, and its compliance aligned with the Commonwealth Procurement Rules.
Further information on the ANAO’s procurement activities can be found on AusTender Homepage: AusTender.
The ANAO had six (2024–25: 6) instances where procurements made by the ANAO were registered on AusTender after 42 days and three (2024–25: 1) instances of section 23 of non-compliance with the PGPA Act, where delegate approval was not obtained prior to varying a contract. Our aim is to have no breaches and we will be monitoring where and why they occur in the future.
Consultancy and non-consultancy contract expenditure
This section summarises the ANAO’s expenditure on reportable consultancy and non-consultancy contracts during 2025–26.
Reportable consultancy contracts
During 2025–26, seven new reportable consultancy contracts were entered into involving total actual expenditure of $0.193 million. In addition, 11 ongoing reportable consultancy contracts were active during the period, involving total actual expenditure of $0.607 million (Table 6.4).
Table 6.5 shows the organisations that received the six largest shares of the ANAO’s total expenditure on reportable consultancy contracts during 2025–26. Annual reports contain information about actual expenditure on reportable consultancy contracts. Information on the value of reportable consultancy contracts is available on the AusTender website.
Decisions to engage consultants during 2025–26 were made in accordance with the PGPA Act and related regulations including the Commonwealth Procurement Rules and relevant internal policies. The ANAO selects consultants through the use of the panel arrangements or by making an open approach to market. The ANAO engages consultants when it requires specialist advice (e.g. actuarial or valuation expertise) to support the conduct of audit work. Independent evaluations on the ANAO outcomes are also required.
Table 6.4: Expenditure on reportable consultancy contracts, 2025–26
|
Category |
Number |
Expenditure $’000 (GST inc.) |
|
New contracts entered into during the reporting period |
7 |
193 |
|
Ongoing contracts entered into during a previous reporting period |
11 |
607 |
|
Total |
18 |
800 |
Table 6.5: Organisations receiving the largest shares of reportable consultancy contract expenditure, 2025–26
|
Name of organisation |
ABN |
Expenditure $’000 (GST inc.) |
|
Ernst and Young |
75 288 172 749 |
150 |
|
Finity Consulting Pty Ltd |
89 111 470 270 |
130 |
|
RSM Australia Pty Ltd atf the Birdanco Practice Trust |
65 319 382 479 |
103 |
|
The Social Research Centre |
91 096 153 212 |
85 |
|
ORIMA Research |
77 076 347 914 |
85 |
|
Acumentis Pty Ltd |
30 109 670 671 |
77 |
Reportable non-consultancy contracts
During 2025–26, 42 new reportable non-consultancy contracts were entered into involving total actual expenditure of $7.907 million. In addition, 149 ongoing reportable non-consultancy contracts were active during the period, involving total actual expenditure of $26.647 million (Table 6.6).
Table 6.7 shows the organisations that received the eight largest shares of the ANAO’s total expenditure on reportable non-consultancy contracts during 2025–26.
Table 6.6: Expenditure on reportable non-consultancy contracts, 2025–26
|
Category |
Number |
Expenditure $’000 (GST inc.) |
|
New contracts entered into during the reporting period |
42 |
7,907 |
|
Ongoing contracts entered into during a previous reporting period |
149 |
26,647 |
|
Total |
191 |
34,554 |
Table 6.7: Organisations receiving the largest shares of reportable non-consultancy contract expenditure, 2025–26
|
Name of organisation |
ABN |
Expenditure $’000 (GST inc.) |
|
xAmplify Services Pty Ltd |
74 632 045 080 |
4,668 |
|
Ernst and Young |
75 288 172 749 |
4,552 |
|
CUSHMAN & WAKEFIELD PTY LTD |
77 074 196 991 |
3,912 |
|
Pricewaterhouse Coopers |
52 780 433 757 |
3,754 |
|
Deloitte Touche Tohmatsu |
74 490 121 060 |
2,430 |
|
Crowe Audit Australia |
13 969 921 386 |
2,118 |
|
Macquarie Technology Operations Pty Limited |
21 082 930 916 |
1,946 |
|
KPMG |
51 194 660 183 |
1,724 |
Small business
The ANAO supports small business participation in the Commonwealth Government procurement market. Small and Medium Enterprises (SME) and Small Enterprise participation statistics are available on the Department of Finance’s website. The ANAO supports small and medium sized enterprises through its procurement practices through the following key initiatives:
- Simplified Procurement Processes — For low-risk contracts valued under $200,000, we utilise the Commonwealth Contracting Suite to streamline engagement, reducing administrative burdens for SMEs. Additionally, we align with the Commonwealth Procurement Rules 2025 to ensure equitable access.
- Prompt Payment Practices — We employ electronic payment systems, including payment cards, to ensure on-time payments within 20 calendar days or five business days for e-invoices, supporting SME cash flow as mandated by the Payment Times Reporting Act 2020. The ANAO recognises the importance of paying small business on time.
- Indigenous Business Support — In line with the Indigenous Procurement Policy (IPP), we actively encourage participation from Indigenous SMEs, contributing to economic empowerment and reconciliation.
APS Strategic Commissioning Framework
The Auditor-General’s independence drives the ANAO’s approach to commissioning. The ANAO acknowledges the intent of the APS Strategic Commissioning Framework in building the capability and expertise of the Australian Public Service (APS) by requiring that core government work be done by APS employees.
To deliver against the Auditor-General’s mandate, the ANAO uses in-house audit teams as well as private sector audit firms to achieve the quality expected by the Parliament and timeliness required in the Commonwealth resource management framework. The ANAO maintains quality of audit work conducted by private sector firms through robust oversight, requiring contractors to adhere to ANAO auditing standards and the ANAO audit manual, and subjecting their work to the same quality assurance reviews and performance monitoring as in-house audit teams.
All signing responsibilities remain with the Auditor-General.
7. Other mandatory information
Work health and safety
The ANAO is committed to providing a safe and healthy workplace and meeting its obligations under the Work Health and Safety Act 2011 (WHS Act).
Under section 38 of the WHS Act, the ANAO is required to notify Comcare of incidents arising from its operations that result in death, serious injury or serious illness of a person, or that involve a dangerous incident. There were no notifiable incidents in 2025–26.
During the year, the ANAO continued to strengthen its work health and safety (WHS) framework through governance, risk management and employee consultation. The Work Health and Safety Committee met regularly throughout the year as the ANAO’s formal consultation forum for WHS matters, bringing together management, health and safety representatives, first aid officers, wardens and harassment contact officers to discuss workplace health and safety risks, review incidents and hazards, and monitor the effectiveness of controls.
The ANAO continued to promote a strong reporting culture through its incident and hazard reporting processes. Employees were encouraged to report accidents, incidents, dangerous occurrences and near misses regardless of whether they occurred in the office, while working from home or at a client site. We used information from reports to identify and manage WHS risks, monitor trends, support preventive action and meet legislative obligations. We regularly review incident and hazard data through established governance arrangements to support continuous improvement in workplace health and safety.
During 2025–26, the ANAO further embedded the management of physical and psychosocial hazards into its core business processes. This included incorporating WHS risk assessments into audit planning and audit work plan templates — ensuring health and safety considerations form part of the planning and delivery of audit activities.
The ANAO continued to engage constructively with Comcare throughout the year. A Comcare inspection of the ANAO’s WHS risk management systems, conducted in October 2025, provided an overall positive assessment and did not identify any compliance issues. The inspection identified opportunities to further strengthen the documentation of consultation, cooperation and coordination on WHS matters. In response, the ANAO implemented the WHS consultation register and enhanced its consultation and record-keeping arrangements. These improvements support a more systematic approach to evidencing worker consultation and demonstrate the ANAO’s commitment to continuous improvement in work health and safety.
Advertising and market research (Commonwealth Electoral Act 1918)
Under section 311A of the Commonwealth Electoral Act 1918, we are required to disclose payments of $16,900 or more (inclusive of GST) to advertising agencies, market research organisations, polling organisations, media advertising organisations and direct mail organisations.
During 2025–26, the ANAO conducted advertising campaigns for graduate recruitment amounting to $62,731 (inclusive of GST).
Payments over $16,900 (including GST) to market research organisations, incurred in the course of client surveys on performance are set out in Table 7.1.
Table 7.1: Payments made to market research organisations 2025–26
|
Organisation |
Purpose |
Payment (GST inc.) |
|
ORIMA Research |
Client survey |
$85,164 |
|
The Social Research Centre |
Client Survey |
$85,327 |
Grants
The ANAO does not administer any grant programs.
Disability reporting
Australia’s Disability Strategy 2021–2031 is the overarching framework for inclusive policies, programs and infrastructure. Its goal is to support people with disability to take part in all aspects of Australian life. The strategy outlines practical changes to improve the lives of people with disability in Australia. It ensures that Australia’s policies and programs align with the principles of the UN Convention on the Rights of Persons with Disabilities, affecting people with disability, their families, and carers. All levels of government have committed to deliver more comprehensive and transparent reporting under the strategy. Progress reports on the strategy’s action plans and outcomes are available at Australia’s Disability Strategy Hub.
In December 2020, the Australian Government released the Australian Public Service Disability Employment Strategy 2020–2025, with the goal of increasing the employment of people with disability across the Australian Public Service to seven per cent by 2025. Disability reporting is included in the Australian Public Service Commission’s State of the Service reports and APS Employment Data series. These documents are available at the APSC’s website.
The ANAO is committed to building and maintaining a diverse and inclusive workforce. As at 30 June 2026, 5.2 per cent of employees identified as having a disability, contributing to the breadth of experiences and perspectives across the organisation.
Throughout the year, the ANAO delivered a range of initiatives under its Diversity and Inclusion Calendar and Wellbeing Calendar to promote inclusion, accessibility, psychological safety and employee wellbeing. These activities help strengthen a workplace culture where all employees can participate fully and thrive.
Freedom of information
The Freedom of Information Act 1982 provides the Auditor-General with an exemption from the provisions of the Act. In 2015, the Australian Information Commissioner determined that the Auditor-General’s exemption extends to the ANAO.
The Auditor-General is exempt from the requirement to publish an Information Publication Scheme.
Appendices
Appendix A — Additional transparency information
Consistent with its commitment to accountability and transparency, the ANAO voluntarily publishes information on a range of matters that support public confidence in its work.
Governance and control environment
The ANAO maintains a robust control environment to support compliance with the Commonwealth resource management framework, including the Public Governance, Performance and Accountability Act 2013 (PGPA Act). Key elements of the control environment include the Auditor-General’s Instructions, financial management procedures and delegated authorities. Together, these establish the principles, responsibilities and internal controls that support the effective, ethical and accountable management of public resources.
Probity and independence
As Australia’s national audit institution, the ANAO places a strong emphasis on independence, integrity and ethical conduct. These principles underpin the quality of our work and support the confidence of the Parliament, audited entities and the public.
The ANAO Auditing Standards and related independence policies establish the requirements that support the delivery of independent, objective and high-quality audits. Staff and contractors engaged in audits are required to comply with applicable professional independence requirements, including APES 110 — Code of Ethics for Professional Accountants (including Independence Standards). Threats to independence are required to be identified, assessed and appropriately managed.
The ANAO also applies probity and conflict of interest requirements to non-audit activities, including procurement activities, consistent with the Department of Finance’s Ethics and Probity in Procurement principles, with controls proportionate to the scale, complexity and risk of the activity.
These arrangements are supported by the ANAO Integrity Framework, which brings together the legislative, governance and operational settings that underpin institutional integrity, accountability and transparency. The integrity framework and annual integrity reporting arrangements further support ethical decision-making and assist in identifying and managing risks related to integrity, fraud and misconduct.
Auditor-General disclosure of expenses
The Auditor-General voluntarily discloses expenses incurred in undertaking official duties, including travel and administrative expenses. Expense disclosures are published every six months on the ANAO website. Expenses for the 2025 calendar year and for January to June 2026 are available online.
Gifts and benefits
The ANAO’s gifts and benefits policy recommends that employees do not accept gifts or benefits in connection with their official duties, and requires all gifts and benefits offered to employees to be declared. Information from the ANAO’s gifts and benefits register is published monthly on the ANAO website.
Audit fee methodology
For some financial statements audits, Commonwealth bodies are liable to pay fees. Subsection 14(1) of the Auditor-General Act 1997 provides for the Auditor-General to determine a scale of audit fees.
The current funding model for financial statement audits of Commonwealth corporate entities and companies creates a sustainability risk for the ANAO. While audit fees are collected as administered revenue and transferred to the Official Public Account (OPA), the ANAO does not receive a separate appropriation to offset the cost of delivering this work; the work is funded through the ANAO’s annual appropriation. As audit complexity, quality expectations and assurance effort increase, any gap between fees recovered and actual audit costs must be absorbed by the ANAO, placing pressure on the ANAO’s resources and its capacity to maintain audit quality, respond to emerging risks and deliver its broader mandate.
Paragraph 8(1)(k) of the Public Accounts and Audit Committee Act 1951 requires the Joint Committee of Public Accounts and Audit to consider the level of fees determined by the Auditor-General under subsection 14(1) of the Auditor-General Act 1997. Information relating to the methodology utilised to determine the ANAO level of fees is outlined below.
Charge-out rates are used to determine the notional or actual audit fee in respect of financial statement audits and to report the cost of performance audits and performance statements audits. The audit fees for financial statements audits of non-corporate Commonwealth entities are notionally calculated for information purposes and inclusion in the notes of the agency’s financial statements. Other entities — mainly Commonwealth statutory authorities and companies — are required to pay audit fees.
Consistent with government policy, the ANAO aims to establish charge-out rates at a level sufficient to recover the costs of its activities over time. An hourly charge-out rate is determined for each staff classification. The establishment of charge-out rates is guided by a costing model that considers all relevant costs, including the attribution of overhead costs, and is designed to achieve full notional cost recovery of the ANAO operating budget. When determining the basis for allocating overhead costs, the ANAO takes into account the nature of the expenditure and calculates the charge-out rate using an accrual-based costing model.
Using the methodology outlined, the average hourly charge-out rate for the ANAO in 2025–26 was $254.20 (2024–25: $247.12), ranging from $166.67 (2024–25: $161.06) per hour for a junior auditor through to $481.72 (2024–25: $480.13) for a senior executive.
Appendix B — Environmental performance
Under section 516A of the Environment Protection and Biodiversity Conservation Act 1999, the annual reports of Commonwealth entities must include information on environmental matters, including:
- how the agency’s activities have accorded with the principles of ecologically sustainable development;
- how the agency’s outcomes contributed to ecologically sustainable development;
- the environmental impacts of the agency’s operations and the measures taken to minimise those impacts; and
- the mechanisms used to improve the effectiveness of measures to minimise the agency’s environmental impact.
Ecologically sustainable development
The ANAO contributes to ecologically sustainable development by incorporating environmental considerations into its operational decision-making and supporting the Australian Government’s commitment to sustainable and responsible public sector operations. This includes taking steps to reduce our environmental impact and adopting environmentally friendly options where practical.
In 2025–26, the ANAO continued to improve its environmental performance and reduce the impact of its operations on the environment through:
- encouraging responsible waste management through the use of organic waste bins;
- maintaining energy-efficient practices, including efficient lighting and office equipment, regular servicing of heating, ventilation and air-conditioning systems, and aligning building operating times with core working hours;
- installing block-out blinds to reduce demand on heating, ventilation and air-conditioning systems and lower energy consumption;
- using motion-activated lighting, power-saving settings, timers and other controls to minimise unnecessary energy consumption;
- supporting reduced travel-related emissions through increased use of videoconferencing and hybrid collaboration technologies;
- reusing office equipment and fit-out materials where possible, purchasing environmentally sustainable products and supplies in bulk, and recycling organic waste, paper, cardboard, batteries, printer cartridges and office furniture; and
- promoting employee awareness of environmental issues, including reconsidering the need to print documents in line with paper-lite principles.
The ANAO continually reviews the environmental impacts of its operations and implements measures to reduce energy use, waste generation and greenhouse gas emissions. Integrating energy-efficiency practices into organisational planning and operations helps the ANAO minimise energy costs and reduce resource consumption.
The ANAO also strengthened its environmental governance and reporting by maintaining its Emissions Reduction Plan, participating in the Chief Sustainability Officer network and using the Australian Government Emissions Data Portal to support the review and validation of its emissions information. These measures support the Australian Government’s Net Zero in Government Operations Strategy and directly contribute to more efficient resource use, improved data quality and progress towards the Australian Public Service Net Zero 2030 target.
Effect of activities on the environment
The ANAO continued to monitor its energy and water consumption and waste management as key indicators of the environmental impact of its operations. Accurate reporting and the identification of opportunities for improvement support the ongoing strengthening of the environmental performance of office operations.
Australian Public Service (APS) Net Zero 2030
The Australian Public Service (APS) Net Zero 2030 policy requires non-corporate and corporate Commonwealth entities to report on their greenhouse gas emissions. This reporting supports the broader effort to achieve net zero emissions by 2030 and enhance transparency in government operations.
To support the APS Net Zero 2030 target, the ANAO recognises the need to maintain momentum on existing emissions reduction initiatives while exploring new opportunities for improvement. As electricity use is the largest contributor to the ANAO’s scope 2 emissions, the ANAO participated in the whole-of-government renewable electricity purchasing arrangement led by the Department of Finance in 2025–26. The objective of the arrangement is to procure 80 per cent of electricity from renewable sources by 2028 and 100 per cent from renewable sources by 2030.
Using the Greenhouse Gas Emissions Inventory, the ANAO has presented its emissions for the 2025–26 reporting period in Table B.1 and Table B.2. Results are presented as carbon dioxide equivalent (CO2-e) emissions.
Greenhouse gas emissions have been calculated using a methodology consistent with the whole-of-Australian-Government approach under the APS Net Zero 2030 policy.
The ANAO’s recorded environmental emissions for the 2025–26 financial year are detailed below.
Table B.1: 2025–26 greenhouse gas emissions inventory — location-based method
|
Emission sourcea |
Scope 1 kg CO2-e |
Scope 2 kg CO2-e |
Scope 3 kg CO2-e |
Total kg CO2-e |
|
Electricity (location-based approach) |
N/A |
135.24 |
6.34 |
141.58 |
|
Natural gas |
– |
N/A |
– |
– |
|
Solid waste |
10.46 |
N/A |
N/A |
10.46 |
|
Refrigerants |
– |
N/A |
N/A |
– |
|
Fleet and other vehicles |
– |
N/A |
– |
– |
|
Domestic commercial flightsb |
N/A |
N/A |
40.74 |
40.74 |
|
Domestic hire carc |
N/A |
N/A |
0.81 |
0.81 |
|
Domestic travel accommodation |
N/A |
N/A |
32.27 |
32.27 |
|
Other energy |
– |
N/A |
– |
– |
|
Total kg CO2-e |
10.46 |
135.24 |
80.16 |
225.86 |
Note a: The table above presents emissions related to electricity usage using the location-based accounting method. CO2-e = carbon dioxide equivalent.
Note b: Any travel records with departure dates, pick up date or check in dates outside of the reporting year were not included in emissions calculations.
Note c: Emissions from hire cars for 2025–26 have been sourced from third party providers and may be incomplete. The quality of data is expected to improve over time as emissions reporting matures.
In the 2025–26 financial year, the ANAO was responsible for total carbon emissions of 225.86 (2024–25: 294.21) kilograms of carbon dioxide equivalent. Scope 2 emissions accounted for approximately 59.9 per cent of total emissions, while Scope 3 emissions accounted for 35.5 per cent. This represents a more even spread of emissions than in 2024–25.
For Scope 2 and 3 emissions, emissions related to electricity decreased in 2025–26 from 150.0 to 141.6 kilograms of carbon dioxide equivalent. The use of alternative travel options and technology to support virtual meetings has reduced carbon emissions associated with air travel.
These measures contributed to a reduction in total emissions, from 294.2 kilograms of carbon dioxide equivalent in 2024–25 to 225.9 kilograms of carbon dioxide equivalent in 2025–26. Through these combined strategies, the ANAO has reduced its environmental impact and continued to support more sustainable business operations.
The APS Net Zero calculator recognises activities such as GreenPower, individually purchased large-scale generation certificates and state-purchased large-scale generation certificates, as demonstrated by the Australian Capital Territory. Carbon emissions are then calculated using a market-based approach. The results are provided in the table below.
Table B.2: 2025–26 electricity greenhouse gas emissions
|
Emission sourcea |
Scope 2 kg CO2-e |
Scope 3 kg CO2-e |
Total kg CO2-e |
Electricity kWh |
|
Electricity (market-based approach) |
135.24 |
6.34 |
141.58 |
211,309.55 |
|
Market-based electricity emissions |
4.1 |
0.56 |
4.65 |
5,050.3 |
|
Total renewable electricity consumed |
N/A |
N/A |
N/A |
206,259.26 |
|
Renewable power percentageb |
N/A |
N/A |
N/A |
36,535.43 |
|
Jurisdictional renewable power |
N/A |
N/A |
N/A |
169,723.84 |
|
Green powerc |
N/A |
N/A |
N/A |
– |
|
Large-scale generation certificates |
N/A |
N/A |
N/A |
– |
|
Behind the meter solard |
N/A |
N/A |
N/A |
– |
|
Total renewable electricity produced |
N/A |
N/A |
N/A |
– |
|
Large-scale generation certificates |
N/A |
N/A |
N/A |
– |
|
Behind the meter solar |
N/A |
N/A |
N/A |
– |
Note a: The table above presents emissions related to electricity usage using both the location-based and the market-based accounting methods. CO2-e = carbon dioxide equivalent. Electricity usage is measured in kilowatt hours (kWh).
Note b: Listed as Mandatory renewables in 2025–26 annual reports. The renewable power percentage (RPP) accounts for the portion of electricity used, from the grid, that falls within the Renewable Energy Target (RET).
Note c: Listed as Voluntary renewables in 2025–26 annual reports.
Note d: Reporting behind the meter solar consumption and/or production is optional. The quality of data is expected to improve over time as emissions reporting matures.
Under the market-based approach, the ANAO was responsible for total carbon emissions of 146.23 kilograms of carbon dioxide equivalent in 2025–26. Analysis of emission sources shows that Scope 2 emissions accounted for approximately 95 per cent of total emissions, while Scope 3 emissions represented a significantly smaller proportion, at five per cent of total emissions.
Not all data sources were available at the time of reporting, and adjustments to baseline data may be required in future reports.
APS Net Zero minimum energy performance standards
The ANAO has a Green Lease Schedule, which includes an obligation to undertake an annual tenancy rating under the National Australian Built Environment Rating System (NABERS). In 2025–26, the ANAO’s tenancy retained its 6-star NABERS rating, unchanged from the previous year and exceeding policy requirements.
Waste
The ANAO continued to separate waste streams during 2025–26 to support recycling and minimise waste sent to landfill. Organic waste collection, introduced in February 2022, remained in place. Emissions from solid waste represented less than three per cent of the ANAO’s location-based greenhouse gas emissions.
Climate risk and opportunity
Climate change has the potential to affect the ANAO’s operating environment over time, including through both physical impacts and the transition to a net zero economy. The ANAO recognises climate-related risks and opportunities as important organisational considerations and assesses them through its broader risk oversight and management arrangements.
In 2025–26, the ANAO prepared for its future climate disclosure obligations by undertaking climate-related risk assessments and integrating the results into existing governance and risk management activities. Climate-related risks and opportunities are considered across the ANAO’s functions, operations, assets and enabling services, and are incorporated into existing risk management, business continuity and corporate planning processes.
In 2026–27, the ANAO will commence reporting under Tranche 3 of the Commonwealth Climate Disclosure arrangements. This preparatory work has positioned the ANAO to meet these reporting requirements by strengthening its understanding of climate-related risks and opportunities and informing how identified risks are managed within existing governance and business planning frameworks.
Appendix C — Workforce information
Employee statistics
Table C.1: All ongoing employees, at 30 June 2026
|
Location |
Man/Male |
Woman/Female |
Non-binary |
Prefers not to answer |
Uses a different term |
Total |
|||||||||||
|
|
Full-time |
Part-time |
Total |
Full-time |
Part-time |
Total |
Full-time |
Part-time |
Total |
Full-time |
Part-time |
Total |
Full-time |
Part-time |
Total |
|
|
|
NSW |
0 |
0 |
0 |
0 |
0 |
0 |
0 |
0 |
0 |
0 |
0 |
0 |
0 |
0 |
0 |
0 |
|
|
Qld |
0 |
0 |
0 |
0 |
0 |
0 |
0 |
0 |
0 |
0 |
0 |
0 |
0 |
0 |
0 |
0 |
|
|
SA |
0 |
0 |
0 |
0 |
0 |
0 |
0 |
0 |
0 |
0 |
0 |
0 |
0 |
0 |
0 |
0 |
|
|
Tas |
0 |
0 |
0 |
0 |
0 |
0 |
0 |
0 |
0 |
0 |
0 |
0 |
0 |
0 |
0 |
0 |
|
|
Vic |
0 |
0 |
0 |
0 |
0 |
0 |
0 |
0 |
0 |
0 |
0 |
0 |
0 |
0 |
0 |
0 |
|
|
WA |
0 |
0 |
0 |
0 |
0 |
0 |
0 |
0 |
0 |
0 |
0 |
0 |
0 |
0 |
0 |
0 |
|
|
ACT |
177 |
6 |
183 |
218 |
34 |
252 |
0 |
0 |
0 |
0 |
0 |
0 |
3 |
0 |
3 |
438 |
|
|
NT |
0 |
0 |
0 |
0 |
0 |
0 |
0 |
0 |
0 |
0 |
0 |
0 |
0 |
0 |
0 |
0 |
|
|
External territories |
0 |
0 |
0 |
0 |
0 |
0 |
0 |
0 |
0 |
0 |
0 |
0 |
0 |
0 |
0 |
0 |
|
|
Overseas |
0 |
0 |
0 |
0 |
0 |
0 |
0 |
0 |
0 |
0 |
0 |
0 |
0 |
0 |
0 |
0 |
|
|
Total |
177 |
6 |
183 |
218 |
34 |
252 |
0 |
0 |
0 |
0 |
0 |
0 |
3 |
– |
3 |
438 |
|
|
84 |
77 |
82 |
51 |
79 |
81 |
52 |
77 |
82 |
51 |
79 |
81 |
59 |
43 |
78 |
81 |
52 |
55 |
Note: Includes all operative and inoperative employees. Inoperative employees are defined as employees who are absent from work for more than 13 weeks.
Table C.2: All ongoing employees, at 30 June 2025
|
Location |
Man/Male |
Woman/Female |
Non-binary |
Prefers not to answer |
Uses a different term |
Total |
||||||||||
|
|
Full-time |
Part-time |
Total |
Full-time |
Part-time |
Total |
Full-time |
Part-time |
Total |
Full-time |
Part-time |
Total |
Full-time |
Part-time |
Total |
|
|
NSW |
0 |
0 |
0 |
0 |
0 |
0 |
0 |
0 |
0 |
0 |
0 |
0 |
0 |
0 |
0 |
0 |
|
Qld |
0 |
0 |
0 |
0 |
0 |
0 |
0 |
0 |
0 |
0 |
0 |
0 |
0 |
0 |
0 |
0 |
|
SA |
0 |
0 |
0 |
0 |
0 |
0 |
0 |
0 |
0 |
0 |
0 |
0 |
0 |
0 |
0 |
0 |
|
Tas |
0 |
0 |
0 |
0 |
0 |
0 |
0 |
0 |
0 |
0 |
0 |
0 |
0 |
0 |
0 |
0 |
|
Vic |
0 |
0 |
0 |
0 |
0 |
0 |
0 |
0 |
0 |
0 |
0 |
0 |
0 |
0 |
0 |
0 |
|
WA |
0 |
0 |
0 |
0 |
0 |
0 |
0 |
0 |
0 |
0 |
0 |
0 |
0 |
0 |
0 |
0 |
|
ACT |
198 |
8 |
206 |
228 |
34 |
262 |
0 |
0 |
0 |
0 |
0 |
0 |
3 |
0 |
3 |
471 |
|
NT |
0 |
0 |
0 |
0 |
0 |
0 |
0 |
0 |
0 |
0 |
0 |
0 |
0 |
0 |
0 |
0 |
|
External territories |
0 |
0 |
0 |
0 |
0 |
0 |
0 |
0 |
0 |
0 |
0 |
0 |
0 |
0 |
0 |
0 |
|
Overseas |
0 |
0 |
0 |
0 |
0 |
0 |
0 |
0 |
0 |
0 |
0 |
0 |
0 |
0 |
0 |
0 |
|
Total |
198 |
8 |
206 |
228 |
34 |
262 |
0 |
0 |
0 |
0 |
0 |
0 |
3 |
0 |
3 |
471 |
|
84 |
77 |
82 |
51 |
79 |
81 |
52 |
77 |
82 |
51 |
79 |
81 |
59 |
77 |
82 |
57 |
55 |
Note: Includes all operative and inoperative employees. Inoperative employees are defined as employees who are absent from work for more than 13 weeks.
Table C.3: All non-ongoing employees, at 30 June 2026
|
Location |
Man/Male |
Woman/Female |
Non-binary |
Prefers not to answer |
Uses a different term |
Total |
||||||||||
|
|
Full-time |
Part-time |
Total |
Full-time |
Part-time |
Total |
Full-time |
Part-time |
Total |
Full-time |
Part-time |
Total |
Full-time |
Part-time |
Total |
|
|
NSW |
0 |
0 |
0 |
0 |
0 |
0 |
0 |
0 |
0 |
0 |
0 |
0 |
0 |
0 |
0 |
0 |
|
Qld |
0 |
0 |
0 |
0 |
0 |
0 |
0 |
0 |
0 |
0 |
0 |
0 |
0 |
0 |
0 |
0 |
|
SA |
0 |
0 |
0 |
0 |
0 |
0 |
0 |
0 |
0 |
0 |
0 |
0 |
0 |
0 |
0 |
0 |
|
Tas |
0 |
0 |
0 |
0 |
0 |
0 |
0 |
0 |
0 |
0 |
0 |
0 |
0 |
0 |
0 |
0 |
|
Vic |
0 |
0 |
0 |
0 |
0 |
0 |
0 |
0 |
0 |
0 |
0 |
0 |
0 |
0 |
0 |
0 |
|
WA |
0 |
0 |
0 |
0 |
0 |
0 |
0 |
0 |
0 |
0 |
0 |
0 |
0 |
0 |
0 |
0 |
|
ACT |
2 |
0 |
2 |
0 |
1 |
1 |
0 |
0 |
0 |
0 |
0 |
0 |
0 |
0 |
0 |
3 |
|
NT |
0 |
0 |
0 |
0 |
0 |
0 |
0 |
0 |
0 |
0 |
0 |
0 |
0 |
0 |
0 |
0 |
|
External territories |
0 |
0 |
0 |
0 |
0 |
0 |
0 |
0 |
0 |
0 |
0 |
0 |
0 |
0 |
0 |
0 |
|
Overseas |
0 |
0 |
0 |
0 |
0 |
0 |
0 |
0 |
0 |
0 |
0 |
0 |
0 |
0 |
0 |
0 |
|
Total |
2 |
0 |
2 |
0 |
1 |
1 |
0 |
0 |
0 |
0 |
0 |
0 |
0 |
0 |
0 |
3 |
|
84 |
77 |
82 |
51 |
79 |
81 |
52 |
77 |
82 |
51 |
79 |
81 |
59 |
77 |
82 |
57 |
55 |
Note: Excludes casual employees. Includes all operative and inoperative employees. Inoperative employees are defined as employees who are absent from work for more than 13 weeks.
Table C.4: All non-ongoing employees, at 30 June 2025
|
Location |
Man/Male |
Woman/Female |
Non-binary |
Prefers not to answer |
Uses a different term |
Total |
||||||||||
|
|
Full-time |
Part-time |
Total |
Full-time |
Part-time |
Total |
Full-time |
Part-time |
Total |
Full-time |
Part-time |
Total |
Full-time |
Part-time |
Total |
|
|
NSW |
0 |
0 |
0 |
0 |
0 |
0 |
0 |
0 |
0 |
0 |
0 |
0 |
0 |
0 |
0 |
0 |
|
Qld |
0 |
0 |
0 |
0 |
0 |
0 |
0 |
0 |
0 |
0 |
0 |
0 |
0 |
0 |
0 |
0 |
|
SA |
0 |
0 |
0 |
0 |
0 |
0 |
0 |
0 |
0 |
0 |
0 |
0 |
0 |
0 |
0 |
0 |
|
Tas |
0 |
0 |
0 |
0 |
0 |
0 |
0 |
0 |
0 |
0 |
0 |
0 |
0 |
0 |
0 |
0 |
|
Vic |
0 |
0 |
0 |
0 |
0 |
0 |
0 |
0 |
0 |
0 |
0 |
0 |
0 |
0 |
0 |
0 |
|
WA |
0 |
0 |
0 |
0 |
0 |
0 |
0 |
0 |
0 |
0 |
0 |
0 |
0 |
0 |
0 |
0 |
|
ACT |
3 |
2 |
5 |
4 |
1 |
5 |
0 |
0 |
0 |
0 |
0 |
0 |
0 |
0 |
0 |
10 |
|
NT |
0 |
0 |
0 |
0 |
0 |
0 |
0 |
0 |
0 |
0 |
0 |
0 |
0 |
0 |
0 |
0 |
|
External territories |
0 |
0 |
0 |
0 |
0 |
0 |
0 |
0 |
0 |
0 |
0 |
0 |
0 |
0 |
0 |
0 |
|
Overseas |
0 |
0 |
0 |
0 |
0 |
0 |
0 |
0 |
0 |
0 |
0 |
0 |
0 |
0 |
0 |
0 |
|
Total |
3 |
2 |
5 |
4 |
1 |
5 |
0 |
0 |
0 |
0 |
0 |
0 |
0 |
0 |
0 |
10 |
|
84 |
77 |
82 |
51 |
79 |
81 |
52 |
77 |
82 |
51 |
79 |
81 |
59 |
77 |
82 |
57 |
55 |
Note: Excludes casual employees. Includes all operative and inoperative employees. Inoperative employees are defined as employees who are absent from work for more than 13 weeks.
APS employee statistics
Table C.5: APS ongoing employees, at 30 June 2026
|
Classification |
Man/Male |
Woman/Female |
Non-binary |
Prefers not to answer |
Uses a different term |
Total |
|||||||||||
|
|
Full-time |
Part-time |
Total |
Full-time |
Part-time |
Total |
Full-time |
Part-time |
Total |
Full-time |
Part-time |
Total |
Full-time |
Part-time |
Total |
|
|
|
SES 3 |
0 |
0 |
0 |
0 |
0 |
0 |
0 |
0 |
0 |
0 |
0 |
0 |
0 |
0 |
0 |
0 |
|
|
SES 2 |
2 |
0 |
2 |
4 |
1 |
5 |
0 |
0 |
0 |
0 |
0 |
0 |
0 |
0 |
0 |
7 |
|
|
SES 1 |
11 |
0 |
11 |
11 |
2 |
13 |
0 |
0 |
0 |
0 |
0 |
0 |
0 |
0 |
0 |
24 |
|
|
EL 2 |
36 |
1 |
37 |
43 |
9 |
52 |
0 |
0 |
0 |
0 |
0 |
0 |
1 |
0 |
1 |
90 |
|
|
EL 1 |
35 |
2 |
37 |
55 |
11 |
66 |
0 |
0 |
0 |
0 |
0 |
0 |
0 |
0 |
0 |
103 |
|
|
APS 6 |
30 |
2 |
32 |
43 |
8 |
51 |
0 |
0 |
0 |
0 |
0 |
0 |
0 |
0 |
0 |
83 |
|
|
APS 5 |
20 |
1 |
21 |
32 |
3 |
35 |
0 |
0 |
0 |
0 |
0 |
0 |
0 |
0 |
0 |
56 |
|
|
APS 4 |
35 |
0 |
35 |
25 |
0 |
25 |
0 |
0 |
0 |
0 |
0 |
0 |
2 |
0 |
2 |
62 |
|
|
APS 3 |
8 |
0 |
8 |
5 |
0 |
5 |
0 |
0 |
0 |
0 |
0 |
0 |
0 |
0 |
0 |
13 |
|
|
APS 2 |
0 |
0 |
0 |
0 |
0 |
0 |
0 |
0 |
0 |
0 |
0 |
0 |
0 |
0 |
0 |
0 |
|
|
APS 1 |
0 |
0 |
0 |
0 |
0 |
0 |
0 |
0 |
0 |
0 |
0 |
0 |
0 |
0 |
0 |
0 |
|
|
Other |
0 |
0 |
0 |
0 |
0 |
0 |
0 |
0 |
0 |
0 |
0 |
0 |
0 |
0 |
0 |
0 |
|
|
Total |
177 |
6 |
183 |
218 |
34 |
252 |
0 |
0 |
0 |
0 |
0 |
0 |
3 |
0 |
3 |
438 |
|
|
119 |
77 |
82 |
51 |
36 |
42 |
81 |
52 |
77 |
82 |
51 |
79 |
81 |
59 |
77 |
82 |
57 |
55 |
Note: Graduates are captured under the APS 3 classification. Numbers are based on headcount and substantive classifications at 30 June 2026. Includes all operative and inoperative employees. Inoperative employees are defined as employees who are absent from work for more than 13 weeks. Information in this table covers the headcount based on substantive classification of staff and does not include acting arrangements.
Table C.6: APS ongoing employees, at 30 June 2025
|
Classification |
Man/Male |
Woman/Female |
Non-binary |
Prefers not to answer |
Uses a different term |
Total |
|||||||||||
|
|
Full-time |
Part-time |
Total |
Full-time |
Part-time |
Total |
Full-time |
Part-time |
Total |
Full-time |
Part-time |
Total |
Full-time |
Part-time |
Total |
|
|
|
SES 3 |
0 |
0 |
0 |
1 |
0 |
1 |
0 |
0 |
0 |
0 |
0 |
0 |
0 |
0 |
0 |
1 |
|
|
SES 2 |
3 |
0 |
3 |
4 |
1 |
5 |
0 |
0 |
0 |
0 |
0 |
0 |
0 |
0 |
0 |
8 |
|
|
SES 1 |
10 |
0 |
10 |
10 |
1 |
11 |
0 |
0 |
0 |
0 |
0 |
0 |
0 |
0 |
0 |
21 |
|
|
EL 2 |
42 |
2 |
44 |
46 |
10 |
56 |
0 |
0 |
0 |
0 |
0 |
0 |
1 |
0 |
1 |
101 |
|
|
EL 1 |
36 |
2 |
38 |
53 |
10 |
63 |
0 |
0 |
0 |
0 |
0 |
0 |
0 |
0 |
0 |
101 |
|
|
APS 6 |
42 |
1 |
43 |
45 |
8 |
53 |
0 |
0 |
0 |
0 |
0 |
0 |
0 |
0 |
0 |
96 |
|
|
APS 5 |
24 |
1 |
25 |
37 |
4 |
41 |
0 |
0 |
0 |
0 |
0 |
0 |
0 |
0 |
0 |
66 |
|
|
APS 4 |
26 |
2 |
28 |
18 |
0 |
18 |
0 |
0 |
0 |
0 |
0 |
0 |
0 |
0 |
0 |
46 |
|
|
APS 3 |
0 |
0 |
0 |
1 |
0 |
1 |
0 |
0 |
0 |
0 |
0 |
0 |
0 |
0 |
0 |
1 |
|
|
APS 2 |
0 |
0 |
0 |
0 |
0 |
0 |
0 |
0 |
0 |
0 |
0 |
0 |
0 |
0 |
0 |
– |
|
|
APS 1 |
0 |
0 |
0 |
0 |
0 |
0 |
0 |
0 |
0 |
0 |
0 |
0 |
0 |
0 |
0 |
– |
|
|
Other |
15 |
0 |
15 |
13 |
0 |
13 |
0 |
0 |
0 |
0 |
0 |
0 |
2 |
0 |
2 |
30 |
|
|
Total |
198 |
8 |
206 |
228 |
34 |
262 |
0 |
0 |
0 |
0 |
0 |
0 |
3 |
0 |
3 |
471 |
|
|
119 |
77 |
82 |
51 |
77 |
82 |
51 |
31 |
46 |
82 |
51 |
79 |
81 |
59 |
77 |
82 |
57 |
55 |
Note: Graduates are captured under the APS 3 classification. Numbers are based on headcount and substantive classifications at 30 June 2026. Includes all operative and inoperative employees. Inoperative employees are defined as employees who are absent from work for more than 13 weeks. Information in this table covers the headcount based on substantive classification of staff and does not include acting arrangements.
Table C.7: APS non-ongoing employees, at 30 June 2026
|
Classification |
Man/Male |
Woman/Female |
Non-binary |
Prefers not to answer |
Uses a different term |
Total |
|||||||||||
|
|
Full-time |
Part-time |
Total |
Full-time |
Part-time |
Total |
Full-time |
Part-time |
Total |
Full-time |
Part-time |
Total |
Full-time |
Part-time |
Total |
|
|
|
SES 3 |
0 |
0 |
0 |
0 |
0 |
0 |
0 |
0 |
0 |
0 |
0 |
0 |
0 |
0 |
0 |
0 |
|
|
SES 2 |
0 |
0 |
0 |
0 |
0 |
0 |
0 |
0 |
0 |
0 |
0 |
0 |
0 |
0 |
0 |
0 |
|
|
SES 1 |
0 |
0 |
0 |
0 |
0 |
0 |
0 |
0 |
0 |
0 |
0 |
0 |
0 |
0 |
0 |
0 |
|
|
EL 2 |
0 |
0 |
0 |
0 |
0 |
0 |
0 |
0 |
0 |
0 |
0 |
0 |
0 |
0 |
0 |
0 |
|
|
EL 1 |
0 |
0 |
0 |
0 |
0 |
0 |
0 |
0 |
0 |
0 |
0 |
0 |
0 |
0 |
0 |
0 |
|
|
APS 6 |
1 |
0 |
1 |
0 |
1 |
1 |
0 |
0 |
0 |
0 |
0 |
0 |
0 |
0 |
0 |
2 |
|
|
APS 5 |
0 |
0 |
0 |
0 |
0 |
0 |
0 |
0 |
0 |
0 |
0 |
0 |
0 |
0 |
0 |
0 |
|
|
APS 4 |
0 |
0 |
0 |
0 |
0 |
0 |
0 |
0 |
0 |
0 |
0 |
0 |
0 |
0 |
0 |
0 |
|
|
APS 3 |
1 |
0 |
1 |
0 |
0 |
0 |
0 |
0 |
0 |
0 |
0 |
0 |
0 |
0 |
0 |
1 |
|
|
APS 2 |
0 |
0 |
0 |
0 |
0 |
0 |
0 |
0 |
0 |
0 |
0 |
0 |
0 |
0 |
0 |
0 |
|
|
APS 1 |
0 |
0 |
0 |
0 |
0 |
0 |
0 |
0 |
0 |
0 |
0 |
0 |
0 |
0 |
0 |
0 |
|
|
Other |
0 |
0 |
0 |
0 |
0 |
0 |
0 |
0 |
0 |
0 |
0 |
0 |
0 |
0 |
0 |
0 |
|
|
Total |
2 |
0 |
2 |
0 |
1 |
1 |
0 |
0 |
0 |
0 |
0 |
0 |
0 |
0 |
0 |
3 |
|
|
119 |
77 |
82 |
51 |
36 |
42 |
81 |
52 |
77 |
82 |
51 |
79 |
81 |
59 |
77 |
82 |
57 |
55 |
Table C.8: APS non-ongoing employees, at 30 June 2025
|
Classification |
Man/Male |
Woman/Female |
Non-binary |
Prefers not to answer |
Uses a different term |
Total |
||||||||||
|
|
Full-time |
Part-time |
Total |
Full-time |
Part-time |
Total |
Full-time |
Part-time |
Total |
Full-time |
Part-time |
Total |
Full-time |
Part-time |
Total |
|
|
SES 3 |
0 |
0 |
0 |
0 |
0 |
0 |
0 |
0 |
0 |
0 |
0 |
0 |
0 |
0 |
0 |
0 |
|
SES 2 |
0 |
0 |
0 |
0 |
0 |
0 |
0 |
0 |
0 |
0 |
0 |
0 |
0 |
0 |
0 |
0 |
|
SES 1 |
0 |
0 |
0 |
0 |
0 |
0 |
0 |
0 |
0 |
0 |
0 |
0 |
0 |
0 |
0 |
0 |
|
EL 2 |
0 |
1 |
1 |
1 |
0 |
1 |
0 |
0 |
0 |
0 |
0 |
0 |
0 |
0 |
0 |
2 |
|
EL 1 |
1 |
0 |
1 |
2 |
1 |
3 |
0 |
0 |
0 |
0 |
0 |
0 |
0 |
0 |
0 |
4 |
|
APS 6 |
2 |
0 |
2 |
0 |
0 |
0 |
0 |
0 |
0 |
0 |
0 |
0 |
0 |
0 |
0 |
2 |
|
APS 5 |
0 |
1 |
1 |
1 |
0 |
1 |
0 |
0 |
0 |
0 |
0 |
0 |
0 |
0 |
0 |
2 |
|
APS 4 |
0 |
0 |
0 |
0 |
0 |
0 |
0 |
0 |
0 |
0 |
0 |
0 |
0 |
0 |
0 |
0 |
|
APS 3 |
0 |
0 |
0 |
0 |
0 |
0 |
0 |
0 |
0 |
0 |
0 |
0 |
0 |
0 |
0 |
0 |
|
APS 2 |
0 |
0 |
0 |
0 |
0 |
0 |
0 |
0 |
0 |
0 |
0 |
0 |
0 |
0 |
0 |
0 |
|
APS 1 |
0 |
0 |
0 |
0 |
0 |
0 |
0 |
0 |
0 |
0 |
0 |
0 |
0 |
0 |
0 |
0 |
|
Other |
0 |
0 |
0 |
0 |
0 |
0 |
0 |
0 |
0 |
0 |
0 |
0 |
0 |
0 |
0 |
0 |
|
Total |
3 |
2 |
5 |
4 |
1 |
5 |
0 |
0 |
0 |
0 |
0 |
0 |
0 |
0 |
0 |
10 |
|
119 |
77 |
82 |
51 |
79 |
81 |
52 |
77 |
82 |
51 |
79 |
81 |
59 |
77 |
82 |
57 |
55 |
Table C.9: APS employees, by full-time and part-time status, at 30 June 2026
|
Classification |
Ongoing |
Non-ongoing |
Total |
||||
|
|
Full-time |
Part-time |
Total ongoing |
Full-time |
Part-time |
Total non-ongoing |
|
|
SES 3 |
0 |
0 |
0 |
0 |
0 |
0 |
0 |
|
SES 2 |
6 |
1 |
7 |
0 |
0 |
0 |
7 |
|
SES 1 |
22 |
2 |
24 |
0 |
0 |
0 |
24 |
|
EL 2 |
80 |
10 |
90 |
0 |
0 |
0 |
90 |
|
EL 1 |
90 |
13 |
103 |
0 |
0 |
0 |
103 |
|
APS 6 |
73 |
10 |
83 |
1 |
1 |
2 |
85 |
|
APS 5 |
52 |
4 |
56 |
0 |
0 |
0 |
56 |
|
APS 4 |
62 |
– |
62 |
0 |
0 |
0 |
62 |
|
APS 3 |
13 |
– |
13 |
1 |
0 |
1 |
14 |
|
APS 2 |
– |
– |
– |
0 |
0 |
0 |
0 |
|
APS 1 |
– |
– |
– |
0 |
0 |
0 |
0 |
|
Other |
– |
– |
– |
0 |
0 |
0 |
0 |
|
Total |
398 |
40 |
438 |
2 |
1 |
3 |
441 |
|
119 |
78 |
80 |
74 |
78 |
80 |
105 |
55 |
Note: Includes all operative and inoperative employees. Inoperative employees are defined as employees who are absent from work for more than 13 weeks. Information in this table covers the headcount based on substantive classification of employees and does not include acting arrangements.
Table C.10: APS employees, by full-time and part-time status, at 30 June 2025
|
Classification |
Ongoing |
Non-ongoing |
Total |
||||
|
|
Full-time |
Part-time |
Total ongoing |
Full-time |
Part-time |
Total non-ongoing |
|
|
SES 3 |
1 |
0 |
1 |
0 |
0 |
0 |
1 |
|
SES 2 |
7 |
1 |
8 |
0 |
0 |
0 |
8 |
|
SES 1 |
20 |
1 |
21 |
0 |
0 |
0 |
21 |
|
EL 2 |
89 |
12 |
101 |
1 |
1 |
2 |
103 |
|
EL 1 |
89 |
12 |
101 |
3 |
1 |
4 |
105 |
|
APS 6 |
87 |
9 |
96 |
2 |
0 |
2 |
98 |
|
APS 5 |
61 |
5 |
66 |
1 |
1 |
2 |
68 |
|
APS 4 |
44 |
2 |
46 |
0 |
0 |
0 |
46 |
|
APS 3 |
1 |
0 |
1 |
0 |
0 |
0 |
1 |
|
APS 2 |
0 |
0 |
0 |
0 |
0 |
0 |
0 |
|
APS 1 |
0 |
0 |
0 |
0 |
0 |
0 |
0 |
|
Other |
30 |
0 |
30 |
0 |
0 |
0 |
30 |
|
Total |
429 |
42 |
471 |
7 |
3 |
10 |
481 |
|
119 |
78 |
80 |
74 |
78 |
80 |
105 |
55 |
Note: Includes all operative and inoperative employees. Inoperative employees are defined as employees who are absent from work for more than 13 weeks. Information in this table covers the headcount based on substantive classification of employees and does not include acting arrangements.
Table C.11: APS employment type, by location, at 30 June 2026
|
Location |
Ongoing |
Non-ongoing |
Total |
|
NSW |
0 |
0 |
0 |
|
Qld |
0 |
0 |
0 |
|
SA |
0 |
0 |
0 |
|
Tas |
0 |
0 |
0 |
|
Vic |
0 |
0 |
0 |
|
WA |
0 |
0 |
0 |
|
ACT |
438 |
3 |
441 |
|
NT |
0 |
0 |
0 |
|
External territories |
0 |
0 |
0 |
|
Overseas |
0 |
0 |
0 |
|
Total |
438 |
3 |
441 |
Note: All ANAO positions are Canberra based. The ANAO has flexible working arrangements that allow staff to work remotely.
Table C.12: APS employment type, by location, at 30 June 2025
|
Location |
Ongoing |
Non-ongoing |
Total |
|
NSW |
0 |
0 |
0 |
|
Qld |
0 |
0 |
0 |
|
SA |
0 |
0 |
0 |
|
Tas |
0 |
0 |
0 |
|
Vic |
0 |
0 |
0 |
|
WA |
0 |
0 |
0 |
|
ACT |
471 |
10 |
481 |
|
NT |
0 |
0 |
0 |
|
External territories |
0 |
0 |
0 |
|
Overseas |
0 |
0 |
0 |
|
Total |
471 |
10 |
481 |
Note: All ANAO positions are Canberra based. The ANAO has flexible working arrangements that allow staff to work remotely.
Table C.13: APS Indigenous employment, at 30 June 2026
|
Employment basis |
Total |
|
Ongoing |
3 |
|
Non-ongoing |
0 |
|
Total |
3 |
Table C.14: APS Indigenous employment, at 30 June 2025
|
Employment basis |
Total |
|
Ongoing |
3 |
|
Non-ongoing |
– |
|
Total |
3 |
Table C.15: APS employment salary ranges, by classification level, at 30 June 2026
|
Classification |
Minimum salary ($) |
Maximum salary ($) |
|
SES 3 |
0 |
0 |
|
SES 2 |
280,993 |
344,323 |
|
SES 1 |
206,396 |
259,761 |
|
EL 2 |
147,773 |
184,425 |
|
EL 1 |
128,684 |
145,014 |
|
APS 6 |
104,852 |
120,514 |
|
APS 5 |
94,643 |
103,130 |
|
APS 4 |
82,398 |
90,560 |
|
APS 3 |
75,797 |
81,971 |
|
APS 2 |
69,625 |
75,796 |
|
APS 1 |
57,497 |
69,624 |
|
Other |
0 |
0 |
|
Minimum–maximum range |
57,497 |
344,323 |
Note: SES = Senior Executive Service; EL = Executive Level; APS = Australian Public Service.
Appendix D — Entity resource statement and expenses by outcome
Table D.1: Entity resource statement
|
|
Current available appropriation |
Payments made |
Balance remaining |
|
|
(A) $’000 |
(B) $’000 |
(A–B) $’000 |
|
Departmental |
|||
|
Annual appropriations — ordinary annual services |
107,928 |
86,272 |
21,656 |
|
Prior year appropriations available — ordinary annual services |
24,080 |
24,080 |
– |
|
Total departmental annual appropriations (C) |
132,008 |
110,352 |
21,656 |
|
Departmental special appropriations Auditor-General Salary |
847 |
844 |
3 |
|
Departmental special appropriations Acting Auditor-General Salary |
75 |
75 |
– |
|
Total departmental special appropriations (D) |
922 |
919 |
3 |
|
Total departmental resourcing (C+D) |
132,930 |
111,271 |
21,659 |
|
Total resourcing and payments for ANAO |
132,930 |
111,271 |
21,659 |
Note: Appropriation Act (No. 1) 2025–26, prior-year departmental appropriation and retained revenue receipts under section 74 of the Public Governance, Performance and Accountability Act 2013.
Note: Special appropriation remaining balance is returned to the Consolidated Revenue Fund (CRF) at the end of each year.
Table D.2: Expenses by outcome — Outcome 1
|
Outcome 1: To improve public sector performance and accountability through independent reporting on Australian Government administration to Parliament, the Executive and the public. |
Budgeta 2025–26 $’000 |
Actual expenses 2025–26 $’000 |
Variation 2025–26 $’000 |
|
(A) |
(B) |
(A–B) |
|
|
Program 1.1: Financial Statements Audit Services — Departmental expenses |
|||
|
Departmental appropriation |
48,675 |
49,935 |
-1,260 |
|
s74 External Revenueb |
2,427 |
3,217 |
-790 |
|
Special appropriations |
377 |
437 |
-60 |
|
Expenses not requiring appropriation in the Budget yearc |
562 |
616 |
-54 |
|
Departmental total |
52,041 |
54,205 |
-2,164 |
|
Total expenses for Program 1.1 |
52,041 |
54,205 |
-2,164 |
|
Program 1.2: Performance Audit Services — Departmental expenses |
|||
|
Departmental appropriation |
38,463 |
40,350 |
-1,887 |
|
s74 External Revenueb |
1,958 |
2,586 |
-628 |
|
Special appropriations |
305 |
353 |
-48 |
|
Expenses not requiring appropriation in the Budget yearc |
477 |
287 |
190 |
|
Departmental total |
41,203 |
43,576 |
-2,373 |
|
Total expenses for Program 1.2 |
41,203 |
43,576 |
-2,373 |
|
Program 1.3: Performance Statements Audit Services — Departmental expenses |
|||
|
Departmental appropriation |
11,282 |
7,566 |
3,716 |
|
s74 External Revenueb |
715 |
505 |
210 |
|
Special appropriations |
118 |
129 |
-11 |
|
Expenses not requiring appropriation in the Budget yearc |
287 |
304 |
-17 |
|
Departmental total |
12,402 |
8,504 |
3,898 |
|
Total expenses for Program 1.3 |
12,402 |
8,504 |
3,898 |
|
Outcome 1 totals by appropriation type — Departmental expenses |
|||
|
Departmental appropriation |
98,420 |
97,851 |
569 |
|
s74 External Revenueb |
5,100 |
6,308 |
-1,208 |
|
Special appropriations |
800 |
919 |
-119 |
|
Special accounts |
– |
– |
– |
|
Expenses not requiring appropriation in the budget yearc |
1,326 |
1,207 |
119 |
|
Departmental total |
105,646 |
106,285 |
-640 |
|
Total expenses for Outcome 1 |
105,646 |
106,285 |
-640 |
|
|
2025–26 |
2024–25 |
|
|
Average staffing level (number) |
434 |
451 |
|
|
280 |
95 |
95 |
95 |
Note a: Full-year budget, including any subsequent adjustment.
Note b: Estimated expenses incurred in relation to receipts retained under section 74 of the PGPA Act 2013.
Note c: Expenses not requiring appropriation in the Budget year are made up of depreciation expenses.
Appendix E — List of requirements
Table E.1: List of annual report requirements, 2025–26
|
PGPA Rule reference |
Description |
Requirement |
Page in report |
|
17AD(g) |
Letter of transmittal |
||
|
17AI |
A copy of the letter of transmittal signed and dated by accountable authority on date final text approved, with statement that the report has been prepared in accordance with section 46 of the PGPA Act and any enabling legislation that specifies additional requirements in relation to the annual report |
Mandatory |
iii |
|
17AD(h) |
Aids to access |
||
|
17AJ(a) |
Table of contents |
Mandatory |
v–vi |
|
17AJ(b) |
Alphabetical index |
Mandatory |
126 |
|
17AJ(c) |
Abbreviations and acronyms |
Mandatory |
124 |
|
17AJ(d) |
List of requirements |
Mandatory |
117 |
|
17AJ(e) |
Details of contact officer |
Mandatory |
inside front cover |
|
17AJ(f) |
Entity’s website address |
Mandatory |
inside front cover |
|
17AJ(g) |
Electronic address of report |
Mandatory |
inside front cover |
|
17AD(a) |
Review by accountable authority |
||
|
17AD(a) |
A review by the accountable authority of the entity |
Mandatory |
1 |
|
17AD(b) |
Overview of the entity |
||
|
17AE(1)(a)(i) |
A description of the role and functions of the entity |
Mandatory |
5 |
|
17AE(1)(a)(ii) |
A description of the organisational structure of the entity |
Mandatory |
6 |
|
17AE(1)(a)(iii) |
A description of the outcomes and programs administered by the entity |
Mandatory |
6 |
|
17AE(1)(a)(iv) |
A description of the purposes of the entity as included in corporate plan |
Mandatory |
5 |
|
17AE(1)(aa)(i) |
Name of the accountable authority or each member of the accountable authority |
Mandatory |
5 |
|
17AE(1)(aa)(ii) |
Position title of the accountable authority or each member of the accountable authority |
Mandatory |
5 |
|
17AE(1)(aa)(iii) |
Period as the accountable authority or member of the accountable authority within the reporting period |
Mandatory |
5 |
|
17AE(1)(b) |
An outline of the structure of the portfolio of the entity |
Portfolio departments — mandatory |
n/a |
|
17AE(2) |
Where the outcomes and programs administered by the entity differ from any portfolio budget statements, portfolio additional estimates statements or other portfolio estimates statements that were prepared for the entity for the period, include details of variation and reasons for change |
If applicable, mandatory |
n/a |
|
17AD(c) |
Report on the performance of the entity |
||
|
16F |
Annual performance statements |
||
|
17AD(c)(i) |
Annual performance statements in accordance with paragraph 39(1)(b) of the PGPA Act and section 16F of the PGPA Rule |
Mandatory |
11 |
|
17AD(c)(ii) |
Report on financial performance |
||
|
17AF(1)(a) |
A discussion and analysis of the entity’s financial performance |
Mandatory |
32 |
|
17AF(1)(b) |
A table summarising the total resources and total payments of the entity |
Mandatory |
115 |
|
17AF(2) |
If there may be significant changes in the financial results during or after the previous or current reporting period, information on those changes, including the cause of any operating loss of the entity; how the entity has responded to the loss and the actions that have been taken in relation to the loss; and any matter or circumstances that it can reasonably be anticipated will have a significant impact on the entity’s future operation or financial results |
If applicable, mandatory |
n/a |
|
17AD(d) |
Management and accountability |
||
|
Corporate governance |
|||
|
17AG(2)(a) |
Information on compliance with section 10 of the PGPA Rule (fraud and corruption systems) |
Mandatory |
iii |
|
17AG(2)(b)(i) |
A certification by accountable authority that fraud and corruption risk assessments have been conducted and fraud and corruption control plans have been prepared |
Mandatory |
iii |
|
17AG(2)(b)(ii) |
A certification by accountable authority that appropriate mechanisms are in place for preventing, detecting incidents of, investigating or otherwise dealing with, and recording or reporting fraud and corruption that meet the specific needs of the entity |
Mandatory |
iii |
|
17AG(2)(b)(iii) |
A certification by accountable authority that all reasonable measures have been taken to deal appropriately with fraud and corruption relating to the entity |
Mandatory |
iii |
|
17AG(2)(c) |
An outline of structures and processes in place for the entity to implement principles and objectives of corporate governance |
Mandatory |
80 |
|
17AG(2)(d) – (e) |
A statement of significant issues reported to minister under paragraph 19(1)(e) of the PGPA Act that relates to noncompliance with finance law and action taken to remedy noncompliance |
If applicable, mandatory |
85 |
|
Audit committee |
|||
|
17AG(2A)(a) |
A direct electronic address of the charter determining the functions of the entity’s audit committee |
Mandatory |
85 |
|
17AG(2A)(b) |
The name of each member of the entity’s audit committee |
Mandatory |
86 |
|
17AG(2A)(c) |
The qualifications, knowledge, skills or experience of each member of the entity’s audit committee |
Mandatory |
86 |
|
17AG(2A)(d) |
Information about the attendance of each member of the entity’s audit committee at committee meetings |
Mandatory |
86 |
|
17AG(2A)(e) |
The remuneration of each member of the entity’s audit committee |
Mandatory |
86 |
|
External scrutiny |
|||
|
17AG(3) |
Information on the most significant developments in external scrutiny and the entity’s response to the scrutiny |
Mandatory |
87 |
|
17AG(3)(a) |
Information on judicial decisions and decisions of administrative tribunals and by the Australian Information Commissioner that may have a significant effect on the operations of the entity |
If applicable, mandatory |
n/a |
|
17AG(3)(b) |
Information on any reports on operations of the entity by the Auditor-General (other than a report under section 43 of the PGPA Act), a parliamentary committee, or the Commonwealth Ombudsman |
If applicable, mandatory |
n/a |
|
17AG(3)(c) |
Information on any capability reviews on the entity that were released during the period |
If applicable, mandatory |
n/a |
|
Management of human resources |
|||
|
17AG(4)(a) |
An assessment of the entity’s effectiveness in managing and developing employees to achieve entity objectives |
Mandatory |
87 |
|
17AG(4)(aa) |
Statistics on the entity’s employees on an ongoing and non-ongoing basis, including statistics on the following:
|
Mandatory |
103 |
|
17AG(4)(b) |
Statistics on the entity’s APS employees on an ongoing and non-ongoing basis, including statistics on the following:
|
Mandatory |
103 |
|
17AG(4)(c) |
Information on any enterprise agreements, individual flexibility arrangements, Australian workplace agreements, common law contracts and determinations under subsection 24(1) of the Public Service Act 1999 |
Mandatory |
90 |
|
17AG(4)(c)(i) |
Information on the number of SES and non-SES employees covered by agreements, etc. identified in paragraph 17AG(4)(c) |
Mandatory |
90 |
|
17AG(4)(c)(ii) |
The salary ranges available for APS employees by classification level |
Mandatory |
114 |
|
17AG(4)(c)(iii) |
A description of non-salary benefits provided to employees |
Mandatory |
90 |
|
17AG(4)(d)(i) |
Information on the number of employees at each classification level who received performance pay |
If applicable, mandatory |
n/a |
|
17AG(4)(d)(ii) |
Information on aggregate amounts of performance pay at each classification level |
If applicable, mandatory |
n/a |
|
17AG(4)(d)(iii) |
Information on the average amount of performance payment, and range of such payments, at each classification level |
If applicable, mandatory |
n/a |
|
17AG(4)(d)(iv) |
Information on aggregate amount of performance payments |
If applicable, mandatory |
n/a |
|
Asset management |
|||
|
17AG(5) |
An assessment of effectiveness of asset management where asset management is a significant part of the entity’s activities |
If applicable, mandatory |
91 |
|
Purchasing |
|||
|
17AG(6) |
An assessment of entity performance against the Commonwealth Procurement Rules |
Mandatory |
91 |
|
Reportable consultancy contracts |
|||
|
17AG(7)(a) |
A summary statement detailing the number of new reportable consultancy contracts entered into during the period; the total actual expenditure on all such contracts (inclusive of GST); the number of ongoing reportable consultancy contracts that were entered into during a previous reporting period; and the total actual expenditure in the reporting period on those ongoing contracts (inclusive of GST) |
Mandatory |
91 |
|
17AG(7)(b) |
A statement that ‘During [reporting period], [specified number] new reportable consultancy contracts were entered into involving total actual expenditure of $[specified million]. In addition, [specified number] ongoing reportable consultancy contracts were active during the period, involving total actual expenditure of $[specified million].’ |
Mandatory |
91 |
|
17AG(7)(c) |
A summary of the policies and procedures for selecting and engaging consultants and the main categories of purposes for which consultants were selected and engaged |
Mandatory |
91 |
|
17AG(7)(d) |
A statement that ‘Annual reports contain information about actual expenditure on reportable consultancy contracts. Information on the value of reportable consultancy contracts is available on the AusTender website.’ |
Mandatory |
91 |
|
Reportable non-consultancy contracts |
|||
|
17AG(7A)(a) |
A summary statement detailing the number of new reportable non-consultancy contracts entered into during the period; the total actual expenditure on such contracts (inclusive of GST); the number of ongoing reportable non-consultancy contracts that were entered into during a previous reporting period; and the total actual expenditure in the reporting period on those ongoing contracts (inclusive of GST) |
Mandatory |
92 |
|
17AG(7A)(b) |
A statement that ‘Annual reports contain information about actual expenditure on reportable non-consultancy contracts. Information on the value of reportable non-consultancy contracts is available on the AusTender website.’ |
Mandatory |
92 |
|
17AD(daa) |
Additional information about organisations receiving amounts under reportable consultancy or non-consultancy contracts |
||
|
17AGA |
Additional information, in accordance with section 17AGA, about organisations receiving amounts under reportable consultancy contracts or reportable non-consultancy contracts |
Mandatory |
91 |
|
Australian National Audit Office access clauses |
|||
|
17AG(8) |
If an entity entered into a contract with a value of more than $100,000 (inclusive of GST) and the contract did not provide the Auditor-General with access to the contractor’s premises, the report must include the name of the contractor, purpose and value of the contract, and the reason why a clause allowing access was not included in the contract |
If applicable, mandatory |
n/a |
|
Exempt contracts |
|||
|
17AG(9) |
If an entity entered into a contract or there is a standing offer with a value greater than $10,000 (inclusive of GST) which has been exempted from being published in AusTender because it would disclose exempt matters under the FOI Act, the annual report must include a statement that the contract or standing offer has been exempted, and the value of the contract or standing offer, to the extent that doing so does not disclose the exempt matters |
If applicable, mandatory |
n/a |
|
Small business |
|||
|
17AG(10)(a) |
A statement that ‘[Name of entity] supports small business participation in the Commonwealth Government procurement market. Small and medium-sized enterprise (SME) and small enterprise participation statistics are available on the Department of Finance’s website.’ |
Mandatory |
93 |
|
17AG(10)(b) |
An outline of the ways in which the procurement practices of the entity support small and medium-sized enterprises |
Mandatory |
93 |
|
17AG(10)(c) |
If the entity is considered by the department administered by the Finance Minister as material in nature — a statement that ‘[Name of entity] recognises the importance of ensuring that small businesses are paid on time. Further information on payment times can be found at [entity web address].’ |
If applicable, mandatory |
n/a |
|
Financial statements |
|||
|
17AD(e) |
Inclusion of the annual financial statements in accordance with subsection 43(4) of the PGPA Act. |
Mandatory |
34 |
|
Executive remuneration |
|||
|
17AD(da) |
Information about executive remuneration in accordance with Subdivision C of Division 3A of Part 2–3 of the PGPA Rule |
Mandatory |
51 |
|
17AD(f) |
Other mandatory information |
||
|
17AH(1)(a)(i) |
If the entity conducted advertising campaigns, a statement that ‘During [reporting period], the [name of entity] conducted the following advertising campaigns: [name of advertising campaigns undertaken]. Further information on those advertising campaigns is available at [address of entity’s website] and in the reports on Australian Government advertising prepared by the Department of Finance. Those reports are available on the Department of Finance’s website.’ |
If applicable, mandatory |
94 |
|
17AH(1)(a)(ii) |
If the entity did not conduct advertising campaigns, a statement to that effect |
If applicable, mandatory |
n/a |
|
17AH(1)(b) |
A statement that ‘Information on grants awarded by [name of entity] during [reporting period] is available at [address of entity’s website].’ |
If applicable, mandatory |
n/a |
|
17AH(1)(c) |
Outline of mechanisms of disability reporting, including reference to website for further information |
Mandatory |
95 |
|
17AH(1)(d) |
Website reference to where the entity’s Information Publication Scheme statement pursuant to Part II of the FOI Act can be found. |
Mandatory |
95 |
|
17AH(1)(e) |
Correction of material errors in previous annual report |
If applicable, mandatory |
n/a |
|
17AH(2) |
Information required by other legislation |
Mandatory |
iii |
Abbreviations and acronyms
AAWP Annual Audit Work Program
ACAG Australasian Council of Auditors-General
AI artificial intelligence
ANAO Australian National Audit Office
APES Australian professional and ethical standard
APS Australian Public Service
ASIC Australian Securities and Investments Commission
ASOSAI Asian Organization of Supreme Audit Institutions
ASQM Australian standard on quality management
BPK Badan Pemeriksa Keuangan [Republik Indonesia] (Audit Board of the Republic of Indonesia)
CA ANZ Chartered Accountants Australia and New Zealand
CFS consolidated financial statements
CPA certified practising accountant
DAFF Department of Agriculture, Fisheries and Forestry
DEWR Department of Employment and Workplace Relations
DSS Department of Social Services
EBOM Executive Board of Management
FIPP Forum for INTOSAI Professional Pronouncements
FOI Act Freedom of Information Act 1982
FSASG Financial Statements Audit Services Group
GST goods and services tax
INTOSAI International Organization of Supreme Audit Institutions
JCPAA Joint Committee of Public Accounts and Audit
NDIA National Disability Insurance Agency
NIAA National Indigenous Australians Agency
PASAI Pacific Association of Supreme Audit Institutions
PASG Performance Audit Services Group
PGPA Act Public Governance, Performance and Accountability Act 2013
PNG Papua New Guinea
PNG AGO Papua New Guinea Auditor-General’s Office
PSASG Performance Statements Audit Services Group
SES Senior Executive Service
WHS work health and safety
WHS Act Work Health and Safety Act 2011
Footnotes
1 Further information about the ANAO’s briefings can be found at Parliamentary briefings | Australian National Audit Office (ANAO).
2 The level of parliamentary engagement with the ANAO is influenced by the parliamentary cycle. As the first year of the 48th Parliament, 2025–26 saw levels of demand broadly consistent with the first year of the 47th Parliament (2022–23), including requests for briefings, submissions, and engagement with parliamentary committees.
3 The Annual Audit Work Program sets out planned future audit activity, whereas an audit cycle refers to audit activity completed for a specific reporting period.
4 Findings are classified into six categories (A, B, C, L1, L2 and L3). Only Category A (significant) and Category B (moderate) findings are reported under performance statements measure 1 reporting mechanisms 2 and 3. Category A findings present significant risk to business, financial management or performance statements integrity; Category B findings present moderate risk.
5 Audit cycle refers to the year of the entity’s financial or performance statements — so the 2024–25 audit cycle concerns audits of entities’ 2024–25 financial or performance statements completed by the ANAO in the 2025–26 financial year. Please note, a small number of audits follow the calendar year rather than the financial year, so have December year ends.
6 The methodology for this measure for financial statements has changed in 2025–26 for consistency across financial statements and performance statements audit products. The ANAO’s 2025–26 performance statements report on the percentage of findings agreed from the 2024–25 audit cycle only. This differs from the methodology used for the ANAO Annual Report 2024–25, which included all open significant and moderate findings for material entities, including findings carried over from previous years.
7 The ANAO reports on entities’ financial statements in its end-of-year report. See paragraphs 4.4.42 to 4.4.45 in Auditor-General Report No. 17 2025–26 Audits of the Financial Statements of Australian Government Entities for the Period Ended 30 June 2025.
8 Audit cycle refers to the year of the entity’s financial or performance statements — so the 2024–25 audit cycle concerns audits of entities’ 2024–25 financial or performance statements completed by the ANAO in the 2025–26 financial year.
9 This methodology for financial statements was revised in 2025–26 to ensure consistency across the ANAO’s audit products. It now considers only significant and moderate findings for material entities raised in the year to which the 24-month window applies (for example, 2022–23 for 2025–26 performance reporting), and excludes findings raised within the 24-month window that remained open at its end. This differs from the approach used for the 2024–25 reporting period, which included all significant and moderate findings for material entities from the year to which the 24-month window applied.
10 Auditor-General Report No. 6 2019–20 Implementation of ANAO and Parliamentary Committee Recommendations; Auditor-General Report No. 46 2019–20 Implementation of ANAO and Parliamentary Committee Recommendations — Education and Health Portfolios; Auditor-General Report No. 34 2020–21 Implementation of ANAO and Parliamentary Committee Recommendations — Department of Defence; Auditor-General Report No. 25 2021–22 Implementation of Parliamentary Committee and Auditor-General Recommendations — Department of Home Affairs, Auditor-General Report No. 22 2022–23 Implementation of Parliamentary Committee and Auditor-General Recommendations — Attorney-General’s Portfolio; Auditor-General Report No. 17 2023–24 Implementation of Parliamentary Committee and Auditor-General Recommendations — Department of Finance; Auditor-General Report No. 14 2024–25 Implementation of Parliamentary Committee and Auditor-General Recommendations — Indigenous Affairs Portfolio; Auditor-General Report No. 29 2025–26 Implementation of Auditor-General Recommendations — Department of Industry, Science and Resources.
11 This calculation covers ANAO performance audit recommendations that the entities had reported as implemented that were assessed by the ANAO as ‘not implemented’ or ‘partly implemented’.
12 The Australian National University and its subsidiaries report on a calendar year basis so this measure includes auditor’s reports issued for the year ended 31 December 2025.
13 The provision of auditor’s reports in a timely manner also supports entities in meeting requirements to provide audit-cleared financial information to the Department of Finance in accordance with deadlines that are set to assist the Australian Government to prepare the Final Budget Outcome by 30 September for the financial statements with a 30 June year end, and the consolidated financial statements by 30 November each year. The consolidated financial statements present whole-of-government financial results, inclusive of all Australian Government–controlled entities.
14 The timely preparation of financial statements and completion of audits of those financial statements supports the timely publication of an entity’s annual report. Annual reports that are not tabled in a timely manner prior to budget supplementary estimates hearings decreases the opportunity for the Senate to scrutinise an entity’s performance. Department of Finance guidance indicates, ‘Normally annual reports are tabled on or before 31 October and it is expected annual reports are tabled prior to the October Estimates Hearings. This ensures annual reports are available for scrutiny by the relevant Senate standing committee.’ Department of Finance, Annual reports for non-corporate Commonwealth entities, last updated March 2026, Finance, available from Publication & presentation requirements | Department of Finance [accessed 27 July 2026].
15 Noting the increasing classification of relevant information and the reduced ability to report projects publicly through a single consolidated report, the JCPAA ‘resolved not to request that the Department of Defence and the ANAO continue to produce the Major Projects Report.’ Public Statement by the Joint Committee of Public Accounts and Audit on the Major Projects Report, JCPAA Public Statement - Major Projects Report [accessed 4 August 2026].
16 Auditor-General Report No. 22 2025–26 Performance Statements of Major Australian Government Entities — Outcomes from the 2024–25 Audit Program, Table 3.1.
17 Auditor-General Report No. 22 2025–26 Performance Statements of Major Australian Government Entities — Outcomes from the 2024–25 Audit Program, paras 3.19 to 3.44.
18 The direct electronic address for the charter is available via the ANAO Audit Committee Charter.